. 2024 Aug 6;12(8):e0016724.
doi: 10.1128/spectrum.00167-24. Epub 2024 Jun 25.

Host-directed therapy with amiodarone in preclinical models restricts mycobacterial infection and enhances autophagy

Affiliations

Host-directed therapy with amiodarone in preclinical models restricts mycobacterial infection and enhances autophagy

Gül Kilinç et al. Microbiol Spectr. .

Abstract

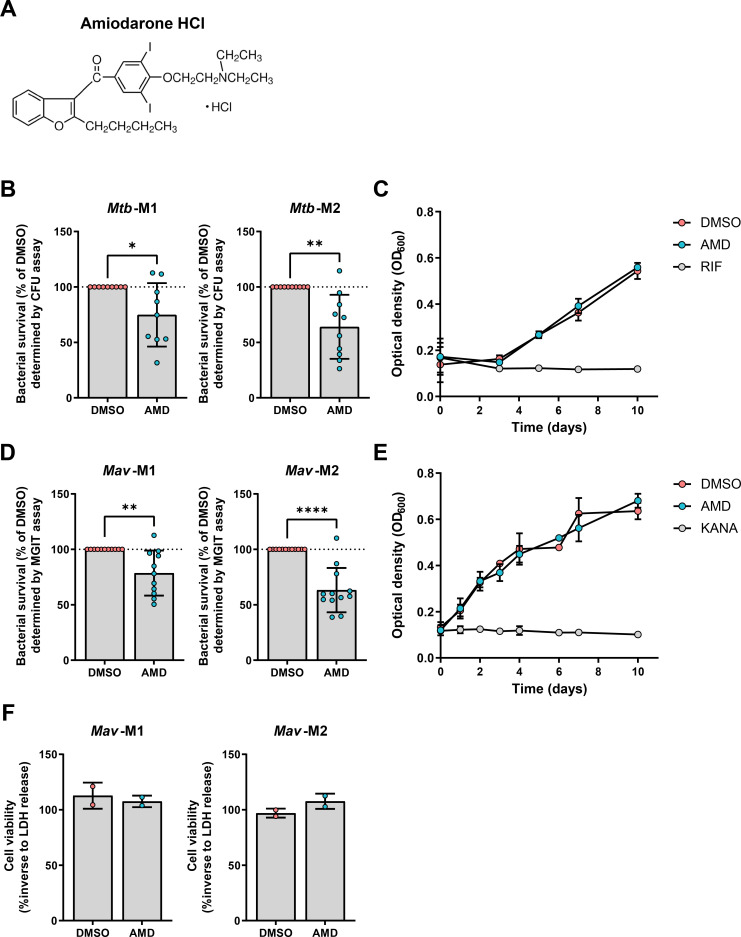
Mycobacterium tuberculosis (Mtb) as well as nontuberculous mycobacteria are intracellular pathogens whose treatment is extensive and increasingly impaired due to the rise of mycobacterial drug resistance. The loss of antibiotic efficacy has raised interest in the identification of host-directed therapeutics (HDT) to develop novel treatment strategies for mycobacterial infections. In this study, we identified amiodarone as a potential HDT candidate that inhibited both intracellular Mtb and Mycobacterium avium in primary human macrophages without directly impairing bacterial growth, thereby confirming that amiodarone acts in a host-mediated manner. Moreover, amiodarone induced the formation of (auto)phagosomes and enhanced autophagic targeting of mycobacteria in macrophages. The induction of autophagy by amiodarone is likely due to enhanced transcriptional regulation, as the nuclear intensity of the transcription factor EB, the master regulator of autophagy and lysosomal biogenesis, was strongly increased. Furthermore, blocking lysosomal degradation with bafilomycin impaired the host-beneficial effect of amiodarone. Finally, amiodarone induced autophagy and reduced bacterial burden in a zebrafish embryo model of tuberculosis, thereby confirming the HDT activity of amiodarone in vivo. In conclusion, we have identified amiodarone as an autophagy-inducing antimycobacterial HDT that improves host control of mycobacterial infections.

Importance: Due to the global rise in antibiotic resistance, there is a strong need for alternative treatment strategies against intracellular bacterial infections, including Mycobacterium tuberculosis (Mtb) and non-tuberculous mycobacteria. Stimulating host defense mechanisms by host-directed therapy (HDT) is a promising approach for treating mycobacterial infections. This study identified amiodarone, an antiarrhythmic agent, as a potential HDT candidate that inhibits the survival of Mtb and Mycobacterium avium in primary human macrophages. The antimycobacterial effect of amiodarone was confirmed in an in vivo tuberculosis model based on Mycobacterium marinum infection of zebrafish embryos. Furthermore, amiodarone induced autophagy and inhibition of the autophagic flux effectively impaired the host-protective effect of amiodarone, supporting that activation of the host (auto)phagolysosomal pathway is essential for the mechanism of action of amiodarone. In conclusion, we have identified amiodarone as an autophagy-inducing HDT that improves host control of a wide range of mycobacteria.

Keywords: Mycobacterium avium; Mycobacterium marinum; Mycobacterium tuberculosis; amiodarone; host-directed therapy; human macrophages; zebrafish.


Conflict of interest statement

The authors declare no conflict of interest.

Figures

Fig 1
Fig 1
Identification of amiodarone as host-directed therapeutic for mycobacterial infections in primary human macrophages. (A) Chemical structure of amiodarone HCl (AMD). (B) Mtb H37Rv-infected M1 and M2 macrophages were treated for 24 hours with 10 µM amiodarone or an equal volume of vehicle control dimethyl sulfoxide (DMSO). Cells were subsequently lysed and bacterial survival was determined by CFU assay. Bacterial survival data represent the mean ± standard deviation (SD) from different donors (n = 9 or 10). Dots represent the mean from triplicate wells of a single donor. Bacterial survival is expressed as the percentage of vehicle control DMSO (=100%, indicated with the dotted line) per donor. Statistical significance was tested using a paired t-test. (C) Growth of Mtb H37Rv in liquid broth was monitored for 10 days after exposure to positive control 20 µg/mL rifampicin (RIF), 10 µM amiodarone, or vehicle control DMSO. Data represent the mean ± SD of triplicate wells from three independent experiments. (D) Bacterial survival of Mav within M1 and M2 macrophages after treatment for 24 hours with 10 µM amiodarone or an equal volume of vehicle control DMSO. Cells were subsequently lysed and bacterial survival was determined by mycobacteria growth indicator tube (MGIT) assay. Data represent the mean ± SD from different donors (n = 11 or 12). Dots represent the mean from triplicate wells of a single donor. Bacterial survival is expressed as the percentage of vehicle control DMSO (=100%, indicated with the dotted line) per donor. Statistical significance was tested using a paired t-test. (E) Growth of Mav in liquid broth was monitored for 10 days after exposure to positive control 100 µg/mL kanamycin (KANA), 10 µM amiodarone, or vehicle control DMSO. Data represent the mean ± SD of triplicate wells from three independent experiments. (F) Percentage of viable M1 and M2 macrophages [based on lactate dehydrogenase (LDH) release] after 24 hours of treatment with 10 µM amiodarone or an equal volume of vehicle control DMSO (0.1%, vol/vol). Data represent the mean ± SD from different donors (n = 2). *P < 0.05, **P < 0.01, and ****P < 0.0001.
Fig 2
Fig 2
Amiodarone controls Mav infection in primary human macrophages by promoting antimycobacterial autophagy and activating master autophagy regulator TFEB. (A) Western blot analysis of autophagy markers in M2 macrophages treated for 24 hours with 10 µM amiodarone or an equal volume of vehicle control dimethyl sulfoxide (DMSO) (0.1%, vol/vol) in the presence or absence of bafilomycin A1 (Baf) (10 nM) during Mav infection. Shown are blots from one representative donor out of six donors tested. The image depicts the boxed lanes from the unprocessed original images (Fig. S2). (B) Quantification of LC3-II (+Baf) protein levels from panel A. Protein levels were first normalized to actin and subsequently compared to DMSO control (=100%, indicated with the dotted line) per donor. Data represent the mean ± SD from different donors (n = 6). Statistical significance was tested using a repeated-measures one-way ANOVA with Bonferroni’s multiple comparison correction. (C) Quantification of p62 (+Baf) protein levels from panel A. Protein levels were first normalized to actin and subsequently compared to DMSO control (=100%, indicated with the dotted line) per donor. Data represent the mean ± SD from different donors (n = 5). Statistical significance was tested using a repeated-measures one-way ANOVA with Bonferroni’s multiple comparison correction. (D) M2 macrophages were treated for 24 hours with 10 µM amiodarone or an equal volume of vehicle control DMSO (0.1%, vol/vol) after infection with Wasabi-expressing Mav (green). Cells were subsequently stained with LC3-II (red) and Hoechst 33342 (blue) and analyzed by confocal microscopy. Images shown are of one representative donor out of eight donors tested. Arrows indicate colocalization of Mav-Wasabi with LC3-II puncta. (E) Quantification of the LC3-II area per cell count. Dots represent the mean from three wells (three images/well) per condition of a single donor (n = 8). Data are expressed as the percentage of vehicle control DMSO (=100%, indicated with the dotted line) per donor. Statistical significance was tested using a Wilcoxon matched-pairs test. (F) The percentage colocalization (indicated by white arrows in panel D) of intracellular mycobacteria with LC3-II puncta was determined. Dots represent the mean from three wells (three images/well) per condition of a single donor (n = 8). Statistical significance was tested using a Wilcoxon matched-pairs test. (G) M2 macrophages were treated for 4 hours with 10 µM amiodarone or an equal volume of vehicle control DMSO (0.1%, vol/vol) in the presence or absence of 10 nM Baf after infection with Wasabi-expressing Mav (green). Cells were subsequently stained with p62 (red) and Hoechst 33342 (blue) and analyzed by confocal microscopy. Images shown are of one representative donor out of five donors tested. Arrows indicate colocalization of Mav-Wasabi with p62. (H) Quantification of the p62 area per cell count. Dots represent the mean from three wells (three images/well) per condition of a single donor (n = 5). Data are expressed as the percentage of vehicle control DMSO (=100%, indicated with the dotted line) per donor. Statistical significance was tested using a Wilcoxon matched-pairs test. (I) The percentage colocalization (indicated by white arrows in panel G) of intracellular mycobacteria with p62 was determined. Dots represent the mean from three wells (three images/well) per condition of a single donor (n = 5). Data are expressed as the percentage of vehicle control DMSO. Statistical significance was tested using a Wilcoxon matched-pairs test. (J) Confocal microscopy of Wasabi-expressing (green) Mav-infected M2 macrophages treated with 10 µM amiodarone or an equal volume of vehicle control DMSO for 4 hours. Cells were subsequently stained for TFEB (yellow) and Hoechst 33342 (blue). Shown are images of one representative donor out of seven donors tested. (K) Quantification of the total intensity of TFEB within the mark of the cell nucleus. Data represent the mean ± SD from different donors (n = 7). Dots represent the mean from three wells (three images/well) per condition of a single donor. Data are expressed as the percentage of vehicle control DMSO (=100%, indicated with the dotted line) per donor. Statistical significance was tested using a paired t-test. (L) Bacterial survival of Mav within M2 macrophages after treatment for 24 hours with 10 µM amiodarone or an equal volume of vehicle control DMSO in the absence or presence of 10 nM Baf. Cells were subsequently lysed and bacterial survival was determined by MGIT assay. Data represent the mean ± SD from different donors (n = 6). Dots represent the mean from triplicate wells of a single donor. Bacterial survival is expressed as the percentage of vehicle control DMSO (=100%, indicated with the dotted line) per donor. Statistical significance was tested using a repeated-measures one-way ANOVA with Bonferroni’s multiple comparison correction. ns, non-significant; *P < 0.05; **P < 0.01; and ***P < 0.001.
Fig 3
Fig 3
Amiodarone restricts Mmar infection in a host-directed manner. (A) Bacterial burden assay of mWasabi-expressing Mmar-infected zebrafish larvae treated with increasing doses of amiodarone (5, 10, and 20 µM) or vehicle control dimethyl sulfoxide (DMSO). Treatment was started at 1 hpi. and larvae were anesthetized at 4 dpi for imaging. Representative stereo fluorescent images of whole larvae infected with mWasabi-expressing Mmar. Magenta shows Mmar. Scale bar annotates 1 mm. (B) Quantification of bacterial burden shown in panel A. Bacterial burden was normalized to the mean of the control. Data from two independent experiments were combined (n = 39–42 per group). Boxplots with 95% confidence intervals are shown, and the black line in the boxplots indicates the group median. Statistical significance was tested using a Kruskal-Wallis with Dunn’s multiple comparisons test. (C) Bacterial burden assay of mWasabi-expressing Mmar-infected zebrafish larvae treated with 5 µM of amiodarone or vehicle control DMSO. Treatment was started at 1 hpi, and larvae were anesthetized at 1, 2, 3, and 4 dpi for imaging. Bacterial burden was normalized to the control (DMSO at 1 dpi), and data from two experimental repeats were combined (n = 65–70 per group). Boxplots with 95% confidence intervals are shown, and the black line in the boxplots indicates the group median. Statistical significance was tested using a Kruskal-Wallis with Dunn’s multiple comparisons test. ns, non-significant; *P < 0.05; **P < 0.01; and ****P < 0.0001.
Fig 4
Fig 4
Amiodarone induces an increase in (auto)phagosomes, without affecting autophagic targeting of Mmar clusters. (A) Confocal microscopy max projection of transgenic GFP-LC3 zebrafish larvae treated with 5 µM of amiodarone or vehicle control dimethyl sulfoxide (DMSO). Treatment was started at 3 dpf and larvae were fixed with 4% paraformaldehyde at 4 dpf for imaging. Representative max projection images of GFP-LC3-positive vesicles in the indicated region of imaging (ROI) in the tail fin are shown. Cyan shows GFP-LC3-positive vesicles. Scale bar annotates 10 µm. (B) Quantification of GFP-LC3 structures is shown in panel A. Data were normalized to the control, and data from two independent experiments were combined (n = 16–17 per group). Boxplots with 95% confidence intervals are shown, and the black line in the boxplots indicates the group median. Statistical significance was tested using a Mann-Whitney test. (C) Confocal microscopy max projection of mCherry-expressing Mmar-infected transgenic GFP-LC3 zebrafish larvae treated with 5 µM of amiodarone or vehicle control DMSO. Treatment was started at 1 hpi, and at 2 dpi, larvae were fixed with 4% paraformaldehyde for imaging. Representative max projection images of the ROI in the CHT region are shown. Cyan shows GFP-LC3-positive vesicles and magenta shows Mmar. Scale bar annotates 50 µm. Enlargement of areas indicated in panel C: cyan shows GFP-LC3-positive vesicles and magenta shows Mmar. Arrowheads indicate GFP-LC3-positive Mmar clusters. Scale bar in the left panel annotates 50 µm and in the right panel 10 µm. (D) Confocal microscopy max projection of mCherry-expressing Mmar-infected transgenic GFP-Lc3 zebrafish larvae treated with 5 µM of amiodarone and 160 nm of bafilomycin or vehicle control DMSO. Treatment was started at 1 hpi, and at 2 dpi, larvae were fixed with 4% paraformaldehyde for imaging. Representative max projection images of the ROI in the CHT region are shown. Cyan shows GFP-Lc3-positive vesicles and magenta shows Mmar. Scale bar annotates 50 µm. Enlargement of areas indicated in panel D: cyan shows GFP-LC3-positive vesicles and magenta shows Mmar. Arrowheads indicate GFP-LC3-positive Mmar clusters. Scale bar in the left panel annotates 50 µm and in the right panel 10 µm. (E) Quantification of GFP-LC3-positive Mmar clusters in the CHT region shown in panels A and D normalized to the control (n = 8 per group). Boxplots with 95% confidence intervals are shown, and the black line in the boxplots indicates the group median. Statistical analysis was performed using a Kruskal-Wallis with Dunn’s multiple comparisons test. ns, non-significant and ****P < 0.0001.

References

    1. Global tuberculosis report 2023. 2023. Licence: CC BY-NC-SA 30 IGO. 2023. Geneva: World Health Organization
    1. Ramakrishnan L. 2012. Revisiting the role of the granuloma in tuberculosis. Nat Rev Immunol 12:352–366. doi:10.1038/nri3211 - DOI - PubMed
    1. Boshoff HIM, Barry III CE. 2005. Tuberculosis - metabolism and respiration in the absence of growth. Nat Rev Microbiol 3:70–80. doi:10.1038/nrmicro1065 - DOI - PubMed
    1. Friedrich N, Hagedorn M, Soldati-Favre D, Soldati T. 2012. Prison break: pathogens' strategies to egress from host cells. Microbiol Mol Biol Rev 76:707–720. doi:10.1128/MMBR.00024-12 - DOI - PMC - PubMed
    1. Cilloni L, Fu H, Vesga JF, Dowdy D, Pretorius C, Ahmedov S, Nair SA, Mosneaga A, Masini E, Sahu S, Arinaminpathy N. 2020. The potential impact of the COVID-19 pandemic on the tuberculosis epidemic a modelling analysis. EClinicalMedicine 28:100603. doi:10.1016/j.eclinm.2020.100603 - DOI - PMC - PubMed

MeSH terms

LinkOut - more resources