. 2024 Oct 4;14(10):1838-1859.
doi: 10.1158/2159-8290.CD-23-1452.

Biologic and Clinical Analysis of Childhood Gamma Delta T-ALL Identifies LMO2/STAG2 Rearrangements as Extremely High Risk

Shunsuke Kimura  1 Chun Shik Park  1 Lindsey E Montefiori  1 Ilaria Iacobucci  1 Petri Pölönen  1 Qingsong Gao  1 Elizabeth D Arnold  2 Andishe Attarbaschi  3   4 Anthony Brown  5 Barbara Buldini  6   7 Kenneth J Caldwell  8 Yunchao Chang  1 Chelsey Chen  1 Cheng Cheng  9 Zhongshan Cheng  10 John Choi  11 Valentino Conter  12 Kristine R Crews  5 Hester A de Groot-Kruseman  13 Takao Deguchi  14 Mariko Eguchi  15 Hannah E Muhle  16 Sarah Elitzur  17 Gabriele Escherich  16 Burgess B Freeman 3rd  18 Zhaohui Gu  1   19   20 Katie Han  21 Keizo Horibe  22 Toshihiko Imamura  23 Sima Jeha  24 Motohiro Kato  25 Kean H Chiew  26 Tanya Khan  1 Michal Kicinski  27 Stefan Köhrer  28 Steven M Kornblau  29 Rishi S Kotecha  30   31   32 Chi-Kong Li  33 Yen-Chun Liu  1 Franco Locatelli  34 Selina M Luger  35 Elisabeth M Paietta  36 Atsushi Manabe  37 Hanne V Marquart  38   39 Riccardo Masetti  40 Mellissa Maybury  41 Pauline Mazilier  42 Jules P P Meijerink  13 Sharnise Mitchell  43 Takako Miyamura  44 Andrew S Moore  41   45 Koichi Oshima  46 Katarzyna Pawinska-Wasikowska  47 Rob Pieters  13 Mollie S Prater  2 Shondra M Pruett-Miller  2 Ching-Hon Pui  21 Chunxu Qu  1 Michaela Reiterova  48 Noemi Reyes  5 Kathryn G Roberts  1 Jacob M Rowe  49 Atsushi Sato  50 Kjeld Schmiegelow  51 Martin Schrappe  52 Shuhong Shen  53 Szymon Skoczeń  47 Orietta Spinelli  54 Jan Stary  55 Michael Svaton  4   48   56 Masatoshi Takagi  57 Junko Takita  58 Yanjing Tang  53 David T Teachey  59 Paul G Thomas  60 Daisuke Tomizawa  61 Jan Trka  48 Elena Varotto  6 Tiffaney L Vincent  59 Jun J Yang  5 Allen E J Yeoh  62 Yinmei Zhou  9 Martin Zimmermann  63 Hiroto Inaba  21 Charles G Mullighan  1   64
Affiliations

Biologic and Clinical Analysis of Childhood Gamma Delta T-ALL Identifies LMO2/STAG2 Rearrangements as Extremely High Risk

Shunsuke Kimura et al. Cancer Discov. .

Abstract

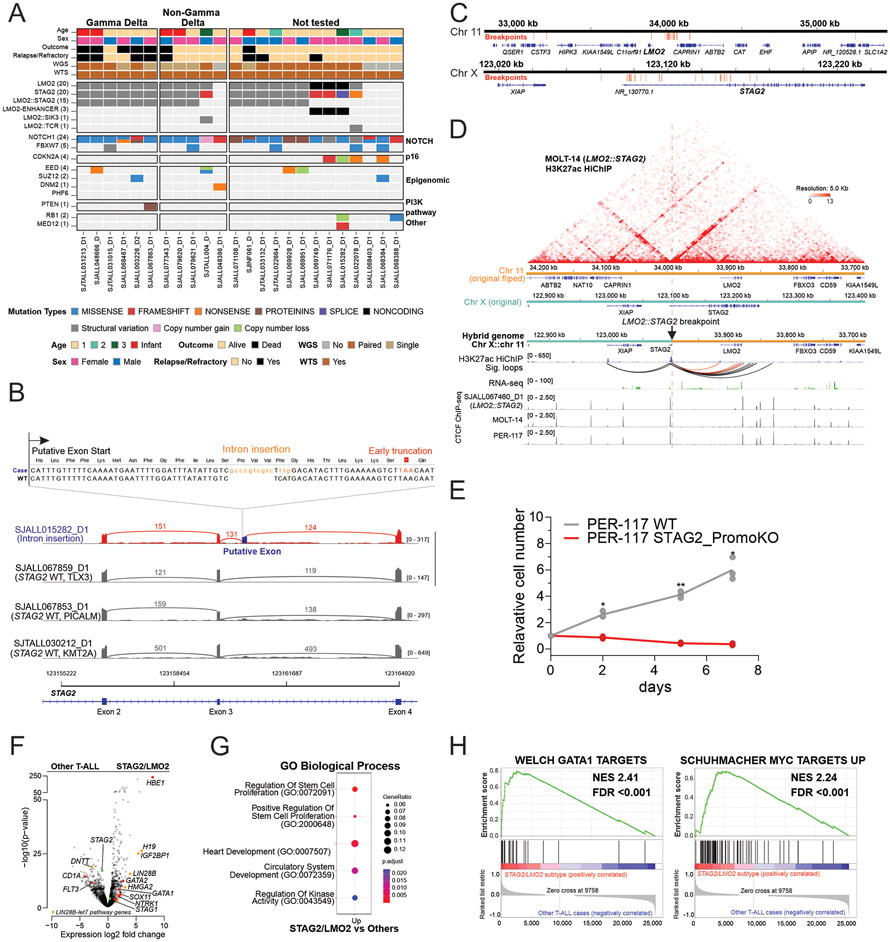
Acute lymphoblastic leukemia expressing the gamma delta T-cell receptor (γδ T-ALL) is a poorly understood disease. We studied 200 children with γδ T-ALL from 13 clinical study groups to understand the clinical and genetic features of this disease. We found age and genetic drivers were significantly associated with outcome. γδ T-ALL diagnosed in children under 3 years of age was extremely high-risk and enriched for genetic alterations that result in both LMO2 activation and STAG2 inactivation. Mechanistically, using patient samples and isogenic cell lines, we show that inactivation of STAG2 profoundly perturbs chromatin organization by altering enhancer-promoter looping, resulting in deregulation of gene expression associated with T-cell differentiation. High-throughput drug screening identified a vulnerability in DNA repair pathways arising from STAG2 inactivation, which can be targeted by poly(ADP-ribose) polymerase inhibition. These data provide a diagnostic framework for classification and risk stratification of pediatric γδ T-ALL. Significance: Patients with acute lymphoblastic leukemia expressing the gamma delta T-cell receptor under 3 years old or measurable residual disease ≥1% at end of induction showed dismal outcomes and should be classified as having high-risk disease. The STAG2/LMO2 subtype was enriched in this very young age group. STAG2 inactivation may perturb chromatin conformation and cell differentiation and confer vulnerability to poly(ADP-ribose) polymerase inhibition.


Conflict of interest statement

Conflict of interests

D.T.T. received research funding from BEAM Therapeutics, NeoImmune Tech and serves on advisory boards for BEAM Therapeutics, Janssen, Servier, Sobi, and Jazz. D.T.T. has multiple patents pending on CAR-T. I.I. reported consultation honorarium from Arima and travel expenses paid by Mission Bio. M.Kicinski received research funding from MSD, BMS, Pierre Fabre, JnJ, and Immunocore. C.G.M. received research funding from Loxo Oncology, Pfizer, AbbVie; honoraria from Amgen and Illumina, and holds stock in Amgen. There are no conflicts of interest with the work presented in this manuscript.

Figures

Figure 1
Figure 1. Study cohort and outcome of γδ and non-γδ T-ALL.
A, CONSORT diagram. B, γδ T-ALL showed significantly worse overall survival (OS) and event-free survival (EFS) compared to non-γδ T-ALL. C, Poor OS and EFS of γδ T-ALL for children under three years of age (top panels); outcomes of non-γδ T-ALL (dotted line) did not vary by age (bottom panels). D, γδ T-ALL patients with MRD≥10−2 (1%) at EOI exhibited significantly worse OS and EFS than those with MRD<10−2. E, γδ T-ALL patients with positive MRD (≥10−4) at the end of consolidation (EOC) had inferior outcomes to those with undetectable MRD. The P values were calculated using the log-rank test. MRD-positive, MRD ≥10−4 without data of specific values.
Figure 2
Figure 2. The intersection of genomics and clinical features of γδ T-ALL.
A, UMAP plot of gene expression analysis for 68 cases of γδ T-ALL (large bold circles) layered on the reference T-ALL cohort (n=1,076, small circles)(15). B, Frequency of each genomic subtype in the γδ T-ALL cohort (n=76), non-γδ T-ALL cases from Total 15/16 of St. Jude Children’s Research Hospital (n=113), and AALL0434 cohorts (no TCR data at diagnosis was available, n=1,076). C, Heatmap showing the mutational landscape, the expression level of selected subtype defining genes, and clinical parameters of the 76 cases of γδ T-ALL. Black color in expression indicates no data. D, Age distribution of each genomic subtype in γδ T-ALL cases (n = 76). E, Event-free survival (EFS) and overall survival (OS) in each genomic subtype. The P value was calculated using the log-rank test. F, Correlation of clinical features and genomic subtypes.
Figure 3
Figure 3. The genomics of STAG2/LMO2 T-ALL.
A, Heatmap showing the mutational landscape and clinical parameters of the 24 cases of STAG2/LMO2 T-ALL, including 6 cases of γδ T-ALL, 5 of non-γδ T-ALL, and 13 lacking TCR status at diagnosis (n=13). B, Example of variant alterations of STAG2 inactivation. A case (SJALL015282_D1) harbored a 13 bp indel alteration in intron 3 of STAG2, resulting in a putative exon, aberrant splicing and early STAG2 truncation. Sashimi plots shows the splicing between STAG2 exon 2 and exon 4. Intron indel alterations (orange) deregulate splicing of this region, generating a putative exon between exon 3 and 4 with early truncation. C, Breakpoints of LMO2::STAG2 translocation are shown in red bar. D, H3K27ac HiChIP on MOLT-14 cell line with LMO2::STAG2 is shown. Data was aligned on a custom reference that mimics chromosome 11 (orange) and X (cyan) translocation in MOLT-14. The top heat map represents raw interaction, and HiChIP (H3K27ac), RNAseq, and ChIPseq (CTCF) coverage tracks are shown in the middle and the bottom, respectively. Significant H3K27ac-anchored interactions (FDR<0.01) are shown as arcs. Interactions between the STAG2 promoter and the LMO2 gene are shown in red. FDR, false discovery rate. E, Relative cell number of gene-edited PER-117 lacking CTCF binding site at STAG2 promoter (STAG2_Promo_KO) compared to isogenic wild type (WT) line. F, Differentially expressed genes in STAG2/LMO2 cases (n=24) compared with other T-ALL (n=1,120) are shown in the volcano plot. LIN28/let-7 pathway genes are colored orange. Cohesin complex genes (STAG1 and STAG2) are colored green. G, Pathway analysis (GO Biological Process) using up-regulated genes (n=78, adjusted P<0.01 and fold change >2) in STAG2/LMO2 compared to other T-ALL cases. H, Up-regulated pathways in STAG2/LMO2 subtype compared to other T-ALL cases analyzed by gene set enrichment analysis.
Figure 4
Figure 4. Effects of STAG2 inactivation in T-ALL cell line models.
A, Chromatin loop size defined by H3K27ac HiChIP for representative T-ALL subtypes (blue and orange) and normal thymocytes (in grey). STAG2/LMO2 cell lines are colored red. B, The schema of gene-edited cell line models. Created with BioRender.com. C, Starburst plot comparing MOLT14-EV with MOLT14-STAG2 for peaks of H3K27ac and their corresponding gene expression. Each circle indicates detected H3K27ac peaks by MACS2 and the circle size represents the p-value of each peak. The bottom-left section includes higher peaks with higher expression in MOLT14-EV. D, H3K27ac (orange), STAG1 (green), and STAG2 (red) binding and RNAseq (blue) coverage at the CD34 locus in MOLT14-EV and MOLT14-STAG2 cells in duplicates. The black squares indicate regained STAG2 binding in MOLT14-STAG2. E, Differentially expressed genes in PF382-STAG2KO (n = 3) compared with PF382-EV (n = 2) in the volcano plot. F, Pathway analysis using up- or down-regulated genes (adjusted P <0.01 and fold change >2 or <−2) in PF382-STAG2KO compared to PF382-WT. G, Up- and down-regulated genes in PF382-STAG2 KO model (green) and primary STAG2/LMO2 subtype T-ALL cases (red) are shown. H, Average ChIP-seq coverage of STAG1 in PF382-WT and PF382-STAG2 KO lines around common STAG1/STAG2, STAG1, and STAG2 binding regions detected from PF382-WT. I, Starburst plot comparing PF382-STAG2 KO with PF382-WT for peaks of H3K27ac and their corresponding gene expression. The top-right section indicates higher peaks with higher expression in PF382-STAG2 KO.
Figure 5
Figure 5. Drug screening in STAG2/LMO2 T-ALL showed talazoparib, HDAC, and CDK inhibitors as potential target therapy.
A, The result of the dose-response analysis for 138 compounds. Each circle indicates a tested compound and the circle size represents the average area under the curve (AUC). EC50 was calculated after 72 hours of treatment. EC50 <1 μM in both cell lines (bottom left section) were considered “effective”. B, The schema showing the effect of STAG2 inactivation in DNA replication and PARP inhibitor in DNA damage repair (DDR) system. STAG2 inactivation induces stalled replication forks, leading to their collapse and double-strand DNA break (DDB). PARP inhibitor blocks DDR of single-strand DNA break and causes DDB. DDR for DDB is also hindered by PARP inhibitors due to PARP1-DNA trapping. HR, homologous recombination; NHEJ, non-homologous end joining. Created with BioRender.com. C, The dose-response curves of STAG2/LMO2 T-ALL lines (MOLT-14 and PER-117) and STAG2 wild-type T-ALL lines (PEER and LOUCY) treated with PARP inhibitor, talazoparib in triplicate. EC50 was calculated after 48 hours of treatment. D, Immunoblotting showing γH2AX level with or without talazoparib (Tal) treatment. E, The synergistic effect of low-dose HDAC inhibitor, vorinostat (0.1 μM and 0.2 μM), with talazoparib was shown in the dose-response curves and in the highest single agent (HSA) synergy score in PER-117 (n=3).
Figure 6
Figure 6. Validation of drug screening results in STAG2/LMO2 T-ALL by using PDX cells in vitro and in vivo study.
A, LC50 value of patient-derived xenografts (PDX) cells from SJALL068384_D1 (γδ TCR positive STAG2/LMO2 T-ALL) and additional 11 PDX cells with other T-ALL subtype tested by a panel of 26 drugs in duplicate. LC50 values for each tested drug in reference T-ALL cell lines were shown in black lines. LC50 was calculated after 96 hours of treatment. B, The dose-response curves of PDX cells treated by olaparib, nelarabine, and prednisone for 96 hours in duplicate. C, The schema of the in vivo preclinical study. BLI, bioluminescence imaging; Tal, talazoparib; Vor, vorinostat. Created with BioRender.com. D, The rate of hCD45+CD7+ T-ALL PDX cells in peripheral blood, bone marrow (BM), and spleen at the end of the study (week 9). Veh, vehicle; Combo, combination of talazoparib and vorinostat. E, The bioluminescence total flux during the treatment. F, The image of bioluminescence during treatment.

References

    1. Winter SS, Dunsmore KP, Devidas M, Wood BL, Esiashvili N, Chen Z, et al. Improved Survival for Children and Young Adults With T-Lineage Acute Lymphoblastic Leukemia: Results From the Children's Oncology Group AALL0434 Methotrexate Randomization. J Clin Oncol 2018;36(29):2926–34 doi 10.1200/JCO.2018.77.7250. - DOI - PMC - PubMed
    1. Dunsmore KP, Winter SS, Devidas M, Wood BL, Esiashvili N, Chen Z, et al. Children's Oncology Group AALL0434: A Phase III Randomized Clinical Trial Testing Nelarabine in Newly Diagnosed T-Cell Acute Lymphoblastic Leukemia. J Clin Oncol 2020;38(28):3282–93 doi 10.1200/JCO.20.00256. - DOI - PMC - PubMed
    1. Sato A, Hatta Y, Imai C, Oshima K, Okamoto Y, Deguchi T, et al. Nelarabine, intensive L-asparaginase, and protracted intrathecal therapy for newly diagnosed T-cell acute lymphoblastic leukaemia in children and young adults (ALL-T11): a nationwide, multicenter, phase 2 trial including randomisation in the very high-risk group. Lancet Haematol 2023;10(6):e419–e32 doi 10.1016/S2352-3026(23)00072-8. - DOI - PubMed
    1. Schrappe M, Valsecchi MG, Bartram CR, Schrauder A, Panzer-Grumayer R, Moricke A, et al. Late MRD response determines relapse risk overall and in subsets of childhood T-cell ALL: results of the AIEOP-BFM-ALL 2000 study. Blood 2011;118(8):2077–84 doi 10.1182/blood-2011-03-338707. - DOI - PubMed
    1. Pui CH, Pei D, Cheng C, Tomchuck SL, Evans SN, Inaba H, et al. Treatment response and outcome of children with T-cell acute lymphoblastic leukemia expressing the gamma-delta T-cell receptor. Oncoimmunology 2019;8(8):1599637 doi 10.1080/2162402X.2019.1599637. - DOI - PMC - PubMed

MeSH terms