. 2024 Jun 25:13:RP93971.
doi: 10.7554/eLife.93971.

Fitness landscape of substrate-adaptive mutations in evolved amino acid-polyamine-organocation transporters

Affiliations

Fitness landscape of substrate-adaptive mutations in evolved amino acid-polyamine-organocation transporters

Foteini Karapanagioti et al. Elife. .

Abstract

The emergence of new protein functions is crucial for the evolution of organisms. This process has been extensively researched for soluble enzymes, but it is largely unexplored for membrane transporters, even though the ability to acquire new nutrients from a changing environment requires evolvability of transport functions. Here, we demonstrate the importance of environmental pressure in obtaining a new activity or altering a promiscuous activity in members of the amino acid-polyamine-organocation (APC)-type yeast amino acid transporters family. We identify APC members that have broader substrate spectra than previously described. Using in vivo experimental evolution, we evolve two of these transporter genes, AGP1 and PUT4, toward new substrate specificities. Single mutations on these transporters are found to be sufficient for expanding the substrate range of the proteins, while retaining the capacity to transport all original substrates. Nonetheless, each adaptive mutation comes with a distinct effect on the fitness for each of the original substrates, illustrating a trade-off between the ancestral and evolved functions. Collectively, our findings reveal how substrate-adaptive mutations in membrane transporters contribute to fitness and provide insights into how organisms can use transporter evolution to explore new ecological niches.

Keywords: S. cerevisiae; adaptive mutations; amino acid transport; amino acid-polyamine-organocation transport family; biochemistry; chemical biology; evolutionary biology; experimental evolution; yeast.


Conflict of interest statement

FK, ÚA, DS, BP, SO No competing interests declared

Figures

Figure 1.
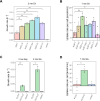
Figure 1.. Yeast amino acid transporters (YAT) support growth on a range of amino acids.
Growth rates of Δ10AA expressing one of seven different wild-type YAT genes (AGP1, BAP2, CAN1, HIP1, LYP1, MMP1, PUT4) from pADHXC3GH and the empty vector control on 2 mM of each amino acid. Error bars represent the SEM (n≥3). For the respective growth curves, see Figure 1—figure supplement 1. For the respective growth rates, see Figure 1—source data 1. To give an indication of the relatedness of YAT proteins from S. cerevisiae, a pairwise identity matrix based on Clustal Omega (Madeira et al., 2022) alignment of Uniprot (UniProt Consortium, 2023) sequences is presented in Figure 1—figure supplement 2.
Figure 1—figure supplement 1.
Figure 1—figure supplement 1.. Yeast amino acid transporters (YAT) support growth on a range of amino acids.
Growth curves of Δ10AA expressing either one of the seven different wild-type YAT genes (AGP1, BAP2, CAN1, HIP1, LYP1, MMP1, PUT4) from pADHXC3GH and the empty vector control on 2 mM of each amino acid. Black lines represent mean values of all measured curves (n≥3). Colored areas represent the SD range.
Figure 1—figure supplement 2.
Figure 1—figure supplement 2.. Pairwise identities of yeast amino acid transporter (YAT) protein sequences from S. cerevisiae.
The multiple sequence alignment was performed using Clustal Omega, with standard UniProt protein sequences as input (AGP1: P25376, AGP2: P38090, AGP3: P43548, ALP1: P38971, BAP2: P38084, BAP3: P41815, CAN1: P04817, DIP5: P53388, GAP1: P19145, GNP1: P48813, HIP1: P06775, LYP1: P32487, MMP1: Q12372, PUT4: P15380, SAM3: Q08986, TAT1: P38085, TAT2: P38967). The sequence identity is shown in percentage, from no identity (0) to identical match (100), represented in blue and red respectively.
Figure 2.
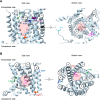
Figure 2.. Positions of the substituted amino acids investigated in this study.
Side and top views of the AlphaFold models of AGP1 (AF-P25376) (A) and PUT4 (AF-P15380) (B) visualized in ChimeraX (1.3.0) (Pettersen et al., 2021). The amino acids of interest are highlighted in different colors. The respective TMs are presented in circles. The predicted substrate binding site is represented as dashed circle.
Figure 2—figure supplement 1.
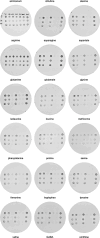
Figure 2—figure supplement 1.. In vivo evolution of AGP1.
Growth assays of Δ10AA pADHXC3GH-AGP1 variants isolated from Cit evolution, spotted on minimal agar with 1 mM of the respective amino acid as the sole nitrogen source. Dishes were imaged after 6 days of incubation at 30°C. Order of AGP1 variants in each dish from left to right: AGP1 wild-type, AGP1-Cit1, AGP1-Cit2, AGP1-Cit3, AGP1-Cit9, AGP1-Cit10, AGP1-Cit11. Spotted are 5 µL of OD600 of 1, 0.1, and 0.01.
Figure 2—figure supplement 2.
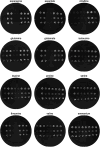
Figure 2—figure supplement 2.. In vivo evolution of PUT4.
Growth assays of Δ10AA pADHXC3GH-PUT4 variants isolated from Asp and Glu evolution, spotted on minimal agar with 1 mM of the respective amino acid as the sole nitrogen source. Dishes were imaged after 15 days of incubation at 30°C. Order of PUT4 variants in each dish from left to right: negative control (AGP1-Cit9), PUT4-Glu2, PUT4-Glu1, PUT4-wild-type, PUT4-wild-type, PUT4-Asp3, PUT4-Asp2, PUT4-Asp1. Spotted are 5 µL of OD600 of 0.1, 0.01, and 0.001.
Figure 2—figure supplement 3.
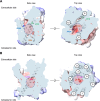
Figure 2—figure supplement 3.. Positions of the substituted amino acids found in the evolved mutants.
Side and bottom views of the AlphaFold models of AGP1 (AF-P25376) (A) and PUT4 (AF-P15380) (B) visualized in ChimeraX (1.3.0). The reported amino acids that were substituted in the evolved mutants are highlighted in different colors. The respective TMs are presented in circles. The predicted substrate binding site is represented as dashed circle.
Figure 2—figure supplement 4.
Figure 2—figure supplement 4.. Position of the L207S on the transporter’s binding site.
Overlay of AdiC crystal structure (PDB: 3OB6; gray) and PUT4 AlphaFold model (AF-P15380; beige). The original substrate of AdiC is present in the middle of the images (‘Arg’; gray). The amino acids contributing to the substrate binding site are shown in sticks. The L207 of PUT4 is shown in magenta, positioned in the binding site area. According to VAST Search (NCBI), the two structures share a 16.5% sequence identity in the superimposed protein parts, a structural similarity score of 22.15 and RMSD of 3.51 Å.
Figure 3.
Figure 3.. The evolved variants support growth and uptake of the respective amino acids.
(A) Growth rate of the AGP1 variants and the vector control on 2 mM L-citrulline (Cit). Error bars represent the SEM (n≥3). (B) Uptake rate of 1 mM 14C-Cit by whole cells expressing different AGP1 variants or none (vector control). Error bars represent the SEM (n≥3). Asterisks in (A) and (B) indicate the degree of significant difference (one-way ANOVA with a Dunett’s test; **p<0.01, *p<0.05) between the AGP1 variants and wild-type. In case of no significant difference (p>0.05) no asterisks are shown. (C) Growth rate of the PUT4 variants and the vector on 2 mM Asp and Glu. Error bars represent the SEM (n≥3). (D) Uptake rate of 1 mM 14C-Glu by whole cells expressing different PUT4 variants or none (vector control). Error bars represent the SEM (n≥3). Asterisks in (C) and (D) indicate the degree of significant difference in pairwise comparisons between the transporter-expressing variants (Student’s t-test; **p<0.01, *p<0.05).
Figure 3—figure supplement 1.
Figure 3—figure supplement 1.. Effects of evolved AGP1 mutations on the surface expression and growth on non-amino acid nitrogen source.
(A) Localization of the AGP1-G variant in whole cells by fluorescence microscopy. The same cells are presented under the bright-field (left) and confocal fluorescence (middle) channels. The manual selection of the periphery of the cells (right) was performed in Fiji with 1 pixel width. (B) Surface expression of the AGP1 variants. Error bars represent the SEM (n=40–50). (C) Growth rate of the AGP1 variants and the vector on 2 mM NH4+. Error bars represent the SEM (n≥3). One-way ANOVA with a Dunett’s test showed no significant difference between the AGP1 variants and wild-type for both (B) and (C).
Figure 3—figure supplement 2.
Figure 3—figure supplement 2.. Effects of evolved PUT4-S mutation on the surface expression and growth on non-amino acid nitrogen source.
(A) Localization of the PUT4-S variant in whole cells by fluorescence microscopy. The same cell is presented under the bright-field (left) and confocal fluorescence (middle) channels. The manual selection of the periphery of the cell (right) was performed in Fiji with 1 pixel width. (B) Surface expression of the PUT4 variants. Error bars represent the SEM (n=30). Asterisks indicate the degree of significant difference in pairwise comparison between the transporter-expressing variants (Student’s t-test; **p<0.01, *p<0.05). (C) Growth rate of the PUT4 variants and the vector on 2 mM NH4+. Error bars represent the SEM (n≥3). Pairwise comparison (Student’s t-test) showed no significant difference between the transporter-expressing variants.
Figure 3—figure supplement 3.
Figure 3—figure supplement 3.. The evolved variants support uptake of the respective amino acids.
(A) Uptake of 1 mM 14C-Cit by whole cells expressing different AGP1 variants or none (vector). Error bars represent the SD (n=3). Each graph represents an independent experiment. (B) Uptake of 1 mM 14C-Glu by whole cells expressing different PUT4 variants or none (vector). Error bars represent the SD (n=3).
Figure 4.
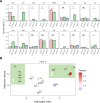
Figure 4.. Relative fitness of evolved AGP1 variants.
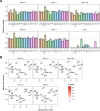
(A) Relative fitness of AGP1 variants and the control strain for the growth on each of 17 amino acids as the sole nitrogen source. The relative fitness was calculated separately for each amino acid by dividing the growth rate of the mutant by the mean growth rate of the wild-type AGP1. Error bars represent the SEM (n≥3). For the respective growth curves, see Figure 4—figure supplement 1. (B) Mean relative fitness of AGP1 variants per substrate as a function of the amino acid hydropathy index (x axis) and molecular volume (y axis). Color corresponds to relative fitness. The plot is based on the growth rate measurements of panel (A).
Figure 4—figure supplement 1.
Figure 4—figure supplement 1.. The evolved variants affect the strain’s growth on different amino acids.
Growth curves of Δ10AA expressing either one of the AGP1 and PUT4 variants from pADHXC3GH and the empty vector control on 2 mM of each amino acid. Black lines represent mean values of all measured curves (n≥3). Colored areas represent the SD range.
Figure 4—figure supplement 2.
Figure 4—figure supplement 2.. Effects of evolved AGP1 mutations on the growth rate on original substrates.
Repetition of the growth rate (μ) measurements of Δ10AA expressing either one of the AGP1 variants from pADHXC3GH on selected substrates. Each point reflects the growth rate of one replicate culture. Note the slow growth of wild-type AGP1 on Cit.
Figure 5.
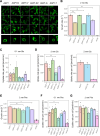
Figure 5.. Effects of evolved AGP1 mutations on the growth and uptake of original substrates.
(A) Localization of the AGP1 variants in whole cells, based on replicate samples (different colonies) and analyzed by fluorescence microscopy, including a zoom-in of a representative cell. (B) Growth rate of the AGP1 variants and the vector on 2 mM Glu. Error bars represent the SEM (n≥3). (C–D) Uptake rate of 0.1 (C) and 2 mM (D) 14C-Glu in whole cells expressing different AGP1 variants or none (vector control). In the case of AGP1-G, the assay was performed with 2 mM 3H-Glu and is presented as independent experiment. Error bars represent the SEM (n≥3). (E) Growth rate of the AGP1 variants and the vector control on 2 mM Phe. Error bars represent the SEM (n≥3). (F–G) Uptake rate of 0.1 (F) and 2 mM (G) 14C-Phe in whole cells expressing different AGP1 variants or none (vector control). Error bars represent the SEM (n≥3). Asterisks in (B–G) indicate the degree of significant difference (one-way ANOVA with a Dunett’s test; **p<0.01, *p<0.05) between the AGP1 variants and wild-type. In case of no significant difference (p>0.05), no asterisks are shown. For the respective uptake curves, see Figure 5—figure supplement 1.
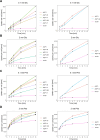
Figure 5—figure supplement 1.
Figure 5—figure supplement 1.. The evolved AGP1 variants support uptake of original substrates.
Uptake of 0.1 mM 14C-Glu (A), 2 mM 14C-Glu (B; left), or 3H-Glu (B; right), 0.1 mM 14C-Phe (C), 2 mM 14C-Phe (D) by whole cells expressing different AGP1 variants or none (vector). Error bars represent the SD (n=3). Each graph represents an independent experiment from the uptakes described in Figure 5.
Figure 5—figure supplement 2.
Figure 5—figure supplement 2.. Correlation between the fitness and uptake of original substrates for the evolved AGP1 variants.
The uptake rate and growth rate on 2 mM Phe (A) or Glu (B) for the evolved AGP1 variants is presented relative to that of cells expressing the wild-type protein. Error bars represent the SD (n≥3). The correlation is described by the linear regression trendline and the equation is shown in the graph.
Figure 6.
Figure 6.. Effects of evolved PUT4-S mutation on the growth and uptake of original substrates.
(A) Localization of the PUT4 variants in whole cells, based on replicate samples (different colonies) and analyzed by fluorescence microscopy, including a zoom-in of a representative cell. (B) Relative fitness of PUT4-S and the vector for the growth on six amino acids as the sole nitrogen source. The relative fitness was calculated separately for each amino acid by dividing the growth rate of the mutant by the mean growth rate of the wild-type PUT4. Error bars represent the SEM (n≥3). For the respective growth curves, see Figure 4—figure supplement 1. (C–E) Uptake rate of 10 μM 14C-Ala (C), γ-amino butyric acid (GABA) (D), or Gly (E) in whole cells expressing PUT4 variants or none (vector). Error bars represent the SEM (n≥3). Asterisks in (C–E) indicate the degree of significant difference in pairwise comparisons between the transporter-expressing variants (Student’s t-test; **p<0.01, *p<0.05). For the respective uptake curves, see Figure 6—figure supplement 1.
Figure 6—figure supplement 1.
Figure 6—figure supplement 1.. The evolved PUT4 variant supports uptake of original substrates.
Uptake of 10 μM 14C-Ala (A), γ-amino butyric acid (GABA) (B), or Gly (C) by whole cells expressing different PUT4 variants or none (vector). Error bars represent the SD (n=3). Each graph represents an independent experiment from the uptakes described in Figure 6.
Figure 7.
Figure 7.. The evolved PUT4-S mutation broadens the substrate range of the transporter.
(A) Growth rate measurements of PUT4 variants and the vector control on 2 mM of 18 different amino acids as the sole nitrogen source. Error bars represent the SEM (n≥3). Asterisks indicate the degree of significant difference in pairwise comparisons (Student’s t-test; **p<0.01, *p<0.05). For the respective growth curves, see Figure 4—figure supplement 1. (B) Mean relative fitness of PUT4-S per substrate as a function of the amino acid hydropathy index (x axis) and molecular volume (y axis). Diamond shapes indicate novel substrates not found in the wild-type PUT4. Color corresponds to relative fitness. The plot is based on the same growth rate measurements as (A).

Update of

  • doi: 10.1101/2023.10.12.562049
  • doi: 10.7554/eLife.93971.1
  • doi: 10.7554/eLife.93971.2

Similar articles

Cited by

References

    1. Adler J, Bibi E. Promiscuity in the geometry of electrostatic interactions between the Escherichia coli multidrug resistance transporter MdfA and cationic substrates. The Journal of Biological Chemistry. 2005;280:2721–2729. doi: 10.1074/jbc.M412332200. - DOI - PubMed
    1. Aharoni A, Gaidukov L, Khersonsky O, McQ Gould S, Roodveldt C, Tawfik DS. The “evolvability” of promiscuous protein functions. Nature Genetics. 2005;37:73–76. doi: 10.1038/ng1482. - DOI - PubMed
    1. Andorfer MC, Grob JE, Hajdin CE, Chael JR, Siuti P, Lilly J, Tan KL, Lewis JC. Understanding flavin-dependent halogenase reactivity via substrate activity profiling. ACS Catalysis. 2017;7:1897–1904. doi: 10.1021/acscatal.6b02707. - DOI - PMC - PubMed
    1. Bali AP, Genee HJ, Sommer MOA. Directed evolution of membrane transport using synthetic selections. ACS Synthetic Biology. 2018;7:789–793. doi: 10.1021/acssynbio.7b00407. - DOI - PubMed
    1. Baranyi J, Roberts TA. Mathematics of predictive food microbiology. International Journal of Food Microbiology. 1995;26:199–218. doi: 10.1016/0168-1605(94)00121-l. - DOI - PubMed

MeSH terms