. 2024 Apr 23;16(2):1199-1215.
doi: 10.14336/AD.2024.0053.

Nogo-A Drives Alzheimer's Disease Progression by Inducing Tauopathy Vulnerability

Affiliations

Nogo-A Drives Alzheimer's Disease Progression by Inducing Tauopathy Vulnerability

Zijian Wang et al. Aging Dis. .

Abstract

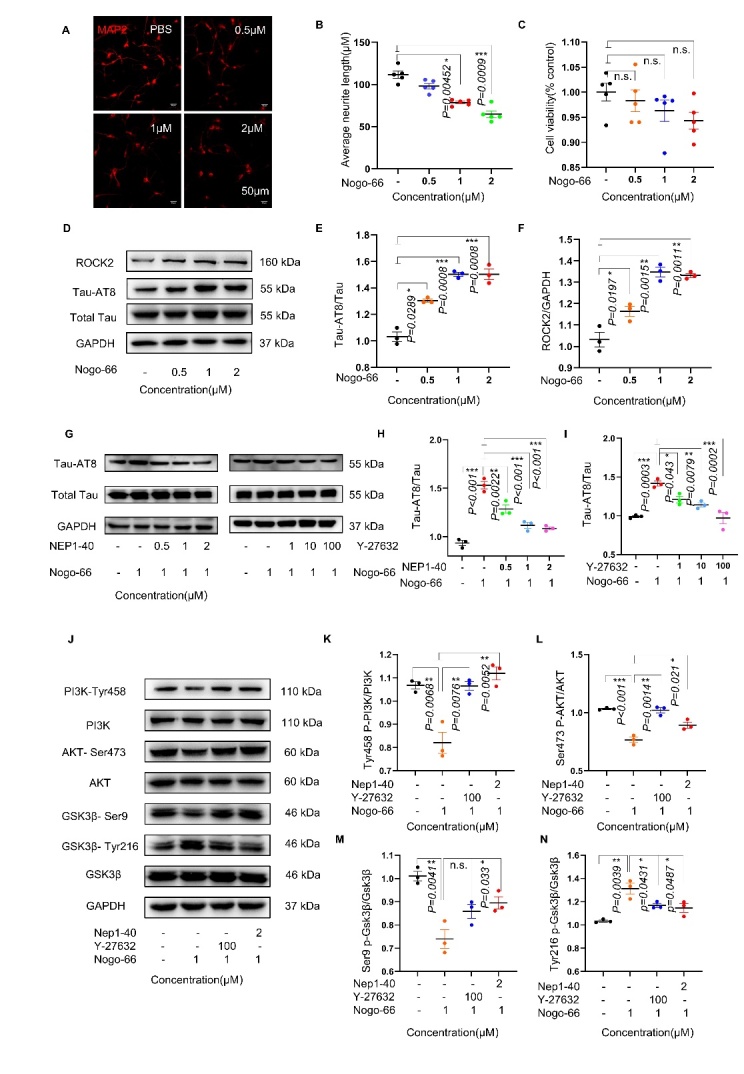
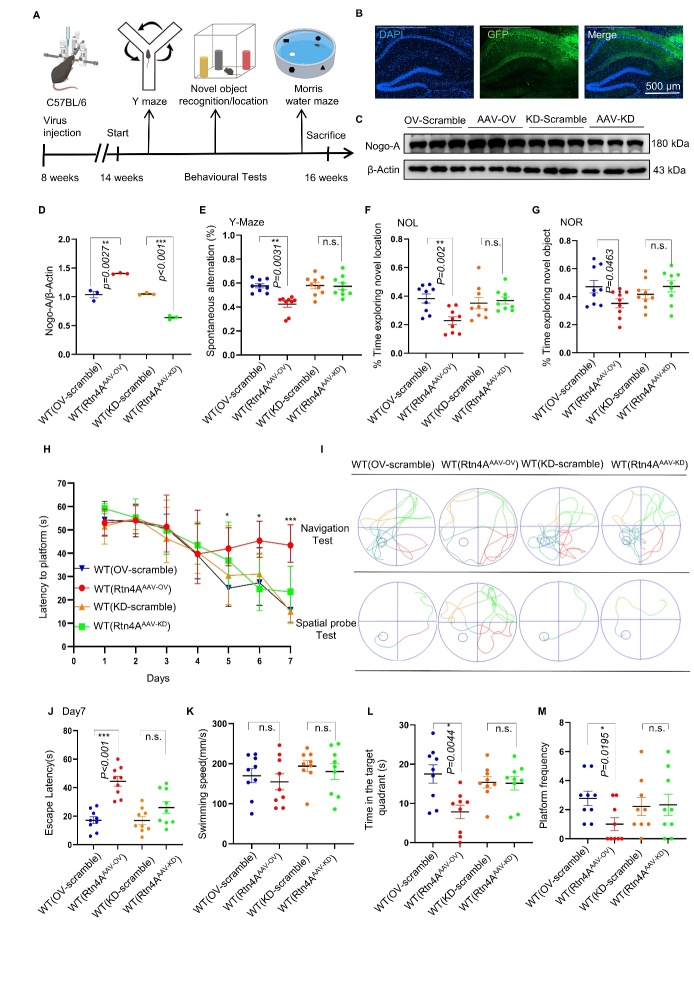
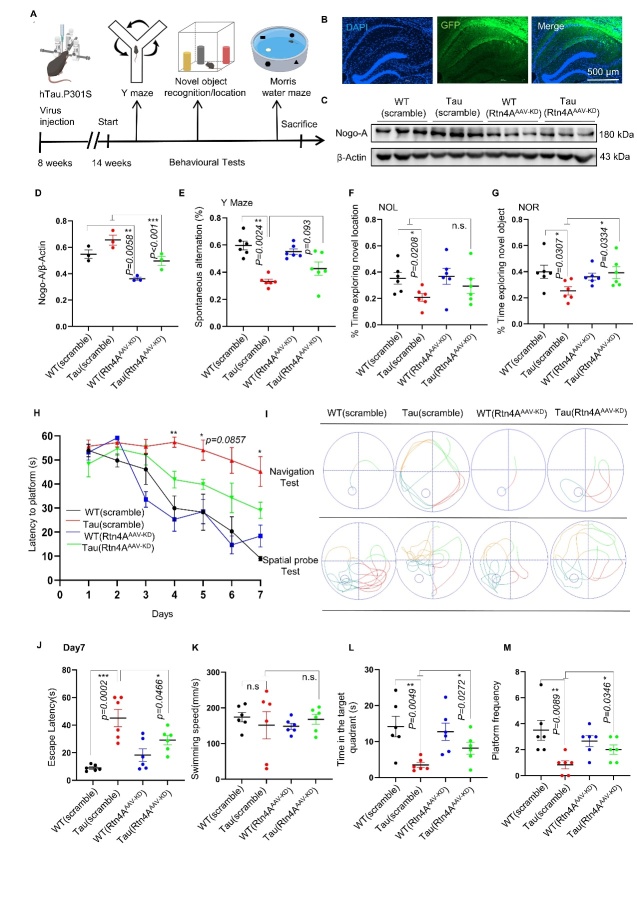
Tauopathies, a group of neurodegenerative disorders, are characterized by disrupted homeostasis of the microtubule binding protein tau. Nogo-A mainly hinders axonal growth and development in neurons, but the underlying mechanism of tau vulnerability has not been determined. Here, to gain more comprehensive insights into the impact of Nogo-A on tau protein expression, we showed that Nogo-A induces tau hyperphosphorylation, synapse loss and cognitive dysfunction. Consistent with the biological function of tau hyperphosphorylation, Nogo-A-induced tau hyperphosphorylation altered microtubule stability, which causes synaptic dysfunction. Mechanistically, Nogo-A-induced tau hyperphosphorylation was abolished by the Nogo-A antagonist NEP1-40 in primary neurons. Surprisingly, downregulation of Nogo-A in the hippocampus of AD mice (hTau. P301S) inhibited tau hyperphosphorylation at the AT8, Thr181, The231 and Ser404 sites and rescued synaptic loss and cognitive impairment in AD mice. Our findings exhibit a strong degree of consistency with Nogo-A-induced tauopathy vulnerability, reinforcing the coherence and reliability of our research. Furthermore, in mice, Nogo-A increases tauopathy vulnerability to exacerbate AD progression via ROCK/AKT/GSK3β signaling. Together, our findings provide new insight into the function of Nogo-A in regulating tau hyperphosphorylation and reveal an effective treatment strategy for tauopathies.


Conflict of interest statement

The authors have no conflicts of interest to declare.

Figures

Figure 1.
Figure 1.
Nogo-66 induced tau phosphorylation via the ROCK/AKT/GSK3β signaling pathway in cortical neurons of SD rats. (A, B) Representative immunofluorescence image showing the effect of Nogo-66-mediated inhibition of neurite outgrowth in cortical neurons. n=5 in each group. (C) Cell viability of Nogo-66-treated neurons, as determined by CCK-8 assay; n=5 in each group. (D, E) Western blot analysis of tau phosphorylation at AT8 sites after treatment with different concentrations of Nogo-66; n=3 in each group. (F) ROCK2 protein expression levels were examined by Western blotting and quantified with ImageJ software (n= 3 in each group). (G-I) Western blotting was used to detect the effect of the Nogo-66 receptor antagonist NEP1-40 and the ROCK inhibitor Y-27632 on tau phosphorylation at the AT8 site; n=3 in each group. (J) Western blots showing the levels of different proteins in the PI3K/AKT/GSK3β signaling pathway in primary cultured cortical cells. (K-N) The data are presented as the average ± S.E.M. (n=3 in each group). Each point represents an independent experiment. Significance was conducted Kruskal-Wallis test, followed by Dunn’s multiple comparisons with a significant difference set at 0.05. n.s.=not significant, * p < 0.05, ** p < 0.01, *** p < 0.001.
Figure 2.
Figure 2.
Overexpression of Nogo-A aggravated cognitive deficits in C57BL/6 N mice. (A) Schematic illustration of the workflow and data analysis. (B) Confocal image of an AAV-injected hippocampus labeled with GFP (green) (40x). (C, D) Representative western blots showing the levels of Nogo-A proteins in the hippocampus of WT (scramble), WT (Rtn4A-AAV-OV), and WT (Rtn4A-AAV-KD) mice; n=3 for each group. (E) Number of spontaneous alternations in the Y-maze test; n=9 for each group. (F, G) Recognition indices of the NOL (F) and NOR (G) tests; n=9 for each group. (H) Latency to escape to a hidden platform in the MWM test during a 7-d training period; Day5: WT (scramble) versus WT(Rtn4A-AAV-OV), P=0.0123. Day6: WT (scramble) versus WT(Rtn4A-AAV-OV), P=0.0275. Day7: WT (scramble) versus WT(Rtn4A-AAV-OV), P< 0.001; (n = 9 mice in each group; *P< 0.05, **P< 0.01, ***P< 0.001; two-way ANOVA followed by Tukey’s multiple-comparisons test). (I) Swimming trajectories in the navigation test and spatial probe test. (J) The escape latency of each group was statistically analyzed on day 7; n=9 for each group. (K) The average speed of the mice in the spatial probe test. (L) Time spent in the target quadrant in the probe trial; n=9 for each group. (M) The number of times the mice passed through the platform location in the probe trial, n=9 for each group. Each point represents an individual animal. Data sets were tested for normal Gaussian distribution via Shapiro-Wilk test. Significance was determined by ANOVA, Tukey's multiple comparisons or Kruskal-Wallis test, followed by Dunn’s multiple comparisons with a significant difference set at 0.05. n.s.=not significant, * p < 0.05, ** p < 0.01, *** p < 0.001.
Figure 3.
Figure 3.
Overexpression of Nogo-A increased tau phosphorylation at the AT8 site, decreased dendrite density and aggravated synaptic loss in C57BL/6 N mice. (A) Representative western blots showing the levels of Nogo-A and tau phosphorylation at AT8. (B, C) Statistical analysis of Nogo-A and tau phosphorylation at AT8 sites; n=3 for each group. (D, E) Representative images and quantification of dendritic spine density. Scale bars = 10 μm, n= 3 mice per group. (F) Representative western blots showing the levels of synaptophysin and PSD95 in the hippocampus. (G) The expression levels of synaptophysin in the hippocampus were examined by Western blotting and quantified with ImageJ software (n= 3 mice per group). Each point represents an individual animal. Normality was tested for using Shapiro-Wilk test, and significance was tested using Kruskal- Wallis test, followed by Dunn’s multiple comparisons as these data set were not gaussian. The data are presented as the means ± S.E.Ms. n.s.=not significant, * p < 0.05, ** p < 0.01, *** p < 0.001.
Figure 4.
Figure 4.
Knockdown of Nogo-A ameliorated the cognitive decline induced by hTau. P301S mice. (A) Schematic diagram of the experimental process. (B) Confocal image of an AAV-injected hippocampus labeled with GFP (green) (40x). (C, D) Representative western blots showing the levels of Nogo-A proteins in the hippocampus of WT (scramble), Tau (scramble), WT (Rtn4A-AAV-KD), and Tau (Rtn4A-AAV-KD) mice; n=3 for each group. (E) The spontaneous alternation of each group was statistically analyzed. n=6 for each group. (F) Discrimination ratio of mice in the novel location recognition (NOL) test; n=6 for each group. (G) Discrimination ratio of mice in the NOR test; n=6 for each group. (H) Latency to escape to a hidden platform in the MWM test during a 7-d training period; Day4: Tau(scramble) versus Tau (Rtn4A-AAV-KD), P=0.0033; Day5: Tau(scramble) versus Tau (Rtn4A-AAV-KD), P=0.0129; Day6: Tau(scramble) versus Tau (Rtn4A-AAV-KD), P=0.0857. Day7: Tau(scramble) versus Tau (Rtn4A-AAV-KD), P=0.0466; (n=6 mice in each group; *P< 0.05, **P< 0.01, ***P< 0.001; two-way ANOVA followed by Tukey’s multiple-comparisons test). (I) Representative swimming trajectories in the navigation test and spatial probe test. (J) The escape latency of each group was statistically analyzed on day 7; n=6 for each group. (K) The average speed of the mice in the spatial probe test. n=6 for each group. (L) Percentage of time spent in the target quadrant. n=6 for each group. (M) The number of times the mice crossed the location of the removed platform. n=6 for each group). Each point represents an individual animal. Data sets were tested for normal Gaussian distribution via Shapiro-Wilk test. Significance was determined by ANOVA, Tukey's multiple comparisons or Kruskal-Wallis test, followed by Dunn’s multiple comparisons with a significant difference set at 0.05. n.s.=not significant, * p < 0.05, ** p < 0.01, *** p < 0.001.
Figure 5.
Figure 5.
Knockdown of Nogo-A reduced tau phosphorylation at AT8, tau pathology, dendrite density and synaptic loss in hTau. P301S mice. (A-C) Representative western blots showing Nogo-A and tau phosphorylation at AT8. n=3 for each group. (D-E) Representative immunofluorescence staining of AT8-positive cells in the hippocampus (100x); n=3 for each group. (F, G) Representative images and quantification of dendritic spine density. Scale bars=10 μm, n=3 mice per group. (H-J) Western blots showing the levels of synaptophysin and PSD95 in hippocampal tissue; n=3 for each group. Western blots were quantified by ImageJ software (n=3 mice per group). Each point represents an individual animal. Data sets were tested for normal Gaussian distribution via Shapiro-Wilk test. Significance was determined by Kruskal-Wallis test, followed by Dunn’s multiple comparisons with a significant difference set at 0.05. n.s.=not significant, * p < 0.05, ** p < 0.01, *** p < 0.001.
Figure 6.
Figure 6.
Nogo-A promoted tauopathy vulnerability via the ROCK/AKT/GSK3β pathway in vivo. (A) Western blots showing the levels of different proteins in the PI3K/AKT/GSK3β signaling pathway in C57BL/6 N mice. (B-F) The Data sets were tested for normal Gaussian distribution via Shapiro-Wilk test. Significance was determined by Kruskal-Wallis test, followed by Dunn’s multiple comparisons with a significant difference set at 0.05. n.s.=not significant, * p < 0.05, ** p < 0.01, *** p < 0.001. (G) Western blots showing the levels of different proteins in the PI3K/AKT/GSK3β signaling pathway in hTau. P301S mice. (H-L) Data sets were tested for normal Gaussian distribution via Shapiro-Wilk test. Significance was determined by Kruskal-Wallis test, followed by Dunn’s multiple comparisons with a significant difference set at 0.05. n.s.=not significant, * p < 0.05, ** p < 0.01, *** p < 0.001. n=3 for each group. Each point represents an individual animal.

References

    1. Alzheimer A, Stelzmann RA, Schnitzlein HN, Murtagh FR (1995). An English translation of Alzheimer's 1907 paper, "Uber eine eigenartige Erkankung der Hirnrinde". Clin Anat, 8:429-431. - PubMed
    1. Grundke-Iqbal I, Iqbal K, Quinlan M, Tung YC, Zaidi MS, Wisniewski HM (1986). Microtubule-associated protein tau. A component of Alzheimer paired helical filaments. J Biol Chem, 261:6084-6089. - PubMed
    1. Goedert M, Wischik CM, Crowther RA, Walker JE, Klug A (1988). Cloning and sequencing of the cDNA encoding a core protein of the paired helical filament of Alzheimer disease: identification as the microtubule-associated protein tau. Proc Natl Acad Sci U S A, 85:4051-4055. - PMC - PubMed
    1. Brady ST, Sperry AO (1995). Biochemical and functional diversity of microtubule motors in the nervous system. Curr Opin Neurobiol, 5:551-558. - PubMed
    1. Lippincott-Schwartz J, Cole NB, Marotta A, Conrad PA, Bloom GS (1995). Kinesin is the motor for microtubule-mediated Golgi-to-ER membrane traffic. J Cell Biol, 128:293-306. - PMC - PubMed

MeSH terms

LinkOut - more resources