. 2024 Jun 25;9(15):e180582.
doi: 10.1172/jci.insight.180582.

Targeting DRP1 with Mdivi-1 to correct mitochondrial abnormalities in ADOA+ syndrome

Affiliations

Targeting DRP1 with Mdivi-1 to correct mitochondrial abnormalities in ADOA+ syndrome

Yan Lin et al. JCI Insight. .

Abstract

Autosomal dominant optic atrophy plus (ADOA+) is characterized by primary optic nerve atrophy accompanied by a spectrum of degenerative neurological symptoms. Despite ongoing research, no effective treatments are currently available for this condition. Our study provided evidence for the pathogenicity of an unreported c.1780T>C variant in the OPA1 gene through patient-derived skin fibroblasts and an engineered HEK293T cell line with OPA1 downregulation. We demonstrate that OPA1 insufficiency promoted mitochondrial fragmentation and increased DRP1 expression, disrupting mitochondrial dynamics. Consequently, this disruption enhanced mitophagy and caused mitochondrial dysfunction, contributing to the ADOA+ phenotype. Notably, the Drp1 inhibitor, mitochondrial division inhibitor-1 (Mdivi-1), effectively mitigated the adverse effects of OPA1 impairment. These effects included reduced Drp1 phosphorylation, decreased mitochondrial fragmentation, and balanced mitophagy. Thus, we propose that intervening in DRP1 with Mdivi-1 could correct mitochondrial abnormalities, offering a promising therapeutic approach for managing ADOA+.

Keywords: Autophagy; Drug therapy; Mitochondria; Neuroscience; Ophthalmology.


Figures

Figure 1
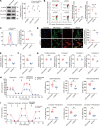
Figure 1. Identification of an unreported p.F594L OPA1 gene variant exhibiting haploinsufficiency.
(A) The pedigree structure and segregation analysis of variants in families. The arrow indicates the proband. (B) DNA sequencing chromatograms comparing the control (upper) and mutant sequences (lower) with the c.1780T>C transition. The variant site is marked with a red box. (C) Conservation analysis reveals a high degree of conservation at position Phe594 (boxed in red) in the OPA1 gene across various eukaryotic species. (D) Western blot analysis of muscle samples showed markedly lower levels of OPA1 protein in the patient (P) compared with controls (C1, C2), along with an elevated ratio of L-OPA1/S-OPA1 isoforms. Data quantification is shown in the accompanying bar graph. The results are derived from the same samples run on different but concurrent blots. (E) IHC analysis showed reduced OPA1 staining in the patient’s muscle samples. Scale bar: 20 μm. (F) qPCR analysis revealed downregulation of OPA1 mRNA levels in the patient’s muscle tissue. (G) Western blot assays of mitochondrial translation products (ATP5A, UQCRC2, SDHB, NDUFB8, and CO2) in muscle samples. Data quantification indicates mitochondrial complex dysregulation in patient samples. The results are derived from the same samples run on different but concurrent blots. (H) The mtDNA copy number analysis of muscle tissues shows a reduction in the patient compared with controls. (I) Transmission electron microscopy (TEM) reveals altered mitochondrial morphology with increased subsarcolemmal mitochondrial accumulation in the patient’s muscle tissue compared with controls. Scale bar: 2 μm. (J) Flow cytometry analysis using DCFDA indicates elevated ROS levels in patient-derived skin fibroblasts compared with those from controls. (K) Mitochondrial membrane potential assessed by JC-1 dye and flow cytometry in control and patient fibroblasts, before and after FCCP treatments. Quantitative analysis indicates reduced membrane potential in the F594L mutant fibroblasts. Statistical analysis was by unpaired, 2-tailed t test. *P < 0.05; **P < 0.01; ***P < 0.001 (D, F, G, H, J and K).
Figure 2
Figure 2. Effect of OPA1 knockdown on mitochondrial proteins, ROS production, and respiratory function.
(A) Western blot analysis of mitochondrial respiratory complex subunits (ND2, CYB, CO4) in siRNA-mediated OPA1 knockdown (siOPA1) cells compared with scramble siRNA (siScramble) treated cells; decreased protein levels were noted after OPA1 silencing. The results are derived from the same samples run on different but concurrent blots. (B) Mitochondrial membrane potential assessed by JC-1 dye in siOPA1 and siScramble cells. Analysis of pre- and post-FCCP treatments demonstrates significantly reduced membrane potential in siOPA1 cells, as indicated by a corresponding decrease in red/green fluorescence ratio. (C) Flow cytometric analysis, using DCFDA in siOPA1 and siScramble cells, revealed increased ROS levels in OPA1-deficient cells. (D) Fluorescence microscopy images showing mitochondrial network (MitoTracker), mitochondrial ROS production (MitoSOX), and nuclear staining (Hoechst) in siOPA1 and siScramble cells; merged images indicate colocalization. Data quantification in the right panel shows increased MitoSOX intensity in siOPA1 cells. Scale bar: 50 µm. (E) ATP assays indicated a significant reduction in ATP levels in siOPA1 cells compared with siScramble cells. (F) Cell viability assays indicated decreased viability in siOPA1 cells relative to siScramble cells. (G) Quantitative analysis of mitochondrial respiratory complex enzymes (citrate Synthase, complex I, complex II, complex IV) showed decreased Complex I and IV levels in siOPA1 cells. (H) Seahorse analysis of oxygen consumption rate (OCR) in siOPA1 and siScramble cells under various metabolic states induced by oligomycin, FCCP, and antimycin A. siOPA1 cells showed reduced basal, ATP-linked, and maximal respiration rates. (I) Seahorse OCR measurements following treatment with specific respiratory complex inhibitors (rotenone, antimycin A, and ascorbate, and TMPD) showed reduced OCR, particularly in Complex I–, II–, and IV–driven respiration in siOPA1 cells. Statistical analysis was by unpaired, 2-tailed t test. *P < 0.05; **P < 0.01; ***P < 0.001 (AI).
Figure 3
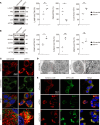
Figure 3. OPA1 knockdown enhanced DRP1 expression and disrupted mitochondrial morphology.
(A) Confocal microscopy images of mitochondria in MitoTracker stained siScramble and siOPA1 cells. Mitochondrial morphology was filamentous, intermediate, or fragmented mitochondria. Scale bars: 20 μm (inset, 4 μm; A) (B) Western blot analysis of mitochondrial dynamics proteins OPA1, MFN1, DRP1, and phosphorylated DRP1 (p-DRP1) in siScramble and siOPA1 cells. Data quantification shows a significant decrease in OPA1 and MFN1 levels, with an increase in p-DRP1 levels in siOPA1-treated cells. DRP1 and p-DRP1 results are derived from the same samples run on different but concurrent blots. (C) Subcellular fractionation followed by Western blot analysis for DRP1 and p-DRP1, comparing total (T), mitochondrial (M), and cytosolic (C) fractions in siScramble and siOPA1 cells. Results indicate elevated levels of DRP1 and p-DRP1 in the mitochondrial fraction of siOPA1 cells. DRP1 and p-DRP1 run on a separate occasion. (D) Confocal microscopy images of siScramble and siOPA1 cells stained for mitochondria and DRP1 show altered DRP1 localization in siOPA1 cells. Scale bar: 20 μm. Statistical analysis was by unpaired, 2-tailed t test. *P < 0.05; ***P < 0.001 (B).
Figure 4
Figure 4. OPA1 participates in molecular interplay with DRP1, and Mdivi-1 mitigates OPA1 deficiency–induced mitophagy dysregulation.
(A) Western blotting indicates the upregulation of LAMP1 and LC3II and the downregulation of P62 in siOPA1 cells. All genes come from the same samples run on different, but concurrent, blots, except for LC3, which was run on a separate occasion. (B) Western blot analysis of mitophagy proteins shows an increase in PINK and FUNDC1 levels in siOPA1 cells compared with siScramble cells. All genes come from the same samples run on different, but concurrent, blots, except for FUNDC1, which was run on a separate occasion. (C) MitoTracker and LysoTracker colocalization confocal imaging shows increased mitophagy in siOPA1 cells, indicated by the increased mitochondrial-lysosomal association in magnified panels. (D) TEM images of siScramble and siOPA1 cells; the left panels show overall cell morphology, and the right panels provide a magnified view of the mitochondria within the red dashed box. siOPA1-treated cells display disrupted mitochondrial architecture showing increased circular and swollen mitochondria, a hallmark of mitochondrial stress and potential mitophagy. (E) Autophagic flux was evaluated using the pCMV-mCherry-GFP-LC3B plasmid, indicating that autophagy is excessively activated by siOPA1 and autophagosome-lysosome fusion is inhibited following treatment with CQ. Statistical analysis was by unpaired, 2-tailed t test. *P < 0.05; **P < 0.01; ***P < 0.001 (A and B). Scale bars: 20 μm (C), 5 μm (inset, 1 μm; D), 50 μm (E).
Figure 5
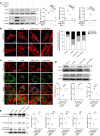
Figure 5. Mdivi-1 ameliorates mitochondrial morphology and autophagy dysregulation and also restores respiratory chain complex protein expression in F594L mutant cells.
(A) Western blot analysis for OPA1, DRP1, and p-DRP1 levels following treatment with MYLS22, GSK3-IN-3, and Mdivi-1 examining the modulation of these proteins under different pharmacological conditions. Data quantification below the blots shows the relative protein levels normalized to ACTIN. All genes come from the same samples run on different, but concurrent, blots, except for OPA1, which was run on a separate occasion. (B) Confocal microscopy illustrated mitochondrial morphology across various conditions: control cells, F594L mutants, F594L mutants with OPA1 lentiviral transduction, and F594L mutants treated with Mdivi-1; all were stained with MitoTracker. The accompanying quantification bar graph shows the proportion of cells exhibiting filamentous, intermediate, or fragmented mitochondria. (C) Detailed confocal images showing mitochondrial (red) and lysosomal (green) colocalization. They depict the levels of mitophagy, and zoomed-in views are also provided. (D) Western blot analysis was used to quantify the levels of OPA1 and LC3 as well as to assess an increased ratio of L-OPA1/S-OPA1 isoforms, across different treatment groups. The results are derived from the same samples run on different but concurrent blots. (E) Western blot analysis of mitochondrial respiratory chain complexes, including CV-ATP5A, CIII-UQCRC2, CII-SDHB, CIV-CO2, and CI-NDUFB8. Data quantification indicated the effects of OPA1 overexpression and Mdivi-1 treatment on the levels of complex expression. The results are derived from the same samples run on different but concurrent blots. Statistical analysis was by 1-way ANOVA and Tukey’s post hoc test. *P < 0.05; **P < 0.01; ***P < 0.001 (A, D, and E). Scale bars: 20 μm (B), 20 μm (inset, 4 μm; C).
Figure 6
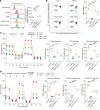
Figure 6. Mdivi-1 attenuates dysfunctions in MMP, ROS accumulation, and OCR in F594L mutant cells.
(A) Flow cytometry using DCFDA was used to assess the levels of ROS in control, F594L mutant, F594L + OPA1–treated, and F594L + Mdivi-1–treated fibroblasts. The histogram and bar graph demonstrate the relative fluorescence intensity. (B) Assessment of MMP using the JC-1 dye across the treatment groups, with flow cytometry plots displaying the proportion of cells with high (aggregates) and low (monomers) MMP. The data quantification bar graph shows the relative intensity of red/green fluorescence. (C) Seahorse analysis of OCR in the different treatment groups under basal conditions and in response to oligomycin, FCCP, and antimycin with rotenone. The line graph and accompanying bar graphs detail the OCR during basal respiration, ATP-linked respiration, and maximal respiration. (D) Seahorse OCR measurements following treatment with metabolic inhibitors rotenone, succinate, antimycin, ascorbate, and TMPD examined the OCR contributions to individual mitochondrial complexes. Statistical analysis was by 1-way ANOVA and Tukey’s post hoc test. *P < 0.05; **P < 0.01; ***P < 0.001.

References

    1. Yu-Wai-Man P, Chinnery PF. Dominant optic atrophy: novel OPA1 mutations and revised prevalence estimates. Ophthalmology. 2013;120(8):1712–1712. doi: 10.1016/j.ophtha.2013.04.022. - DOI - PMC - PubMed
    1. Lenaers G, et al. Dominant optic atrophy: Culprit mitochondria in the optic nerve. Prog Retin Eye Res. 2021;83:100935. doi: 10.1016/j.preteyeres.2020.100935. - DOI - PubMed
    1. Baker MR, et al. Subclinical multisystem neurologic disease in “pure” OPA1 autosomal dominant optic atrophy. Neurology. 2011;77(13):1309–1312. doi: 10.1212/WNL.0b013e318230a15a. - DOI - PMC - PubMed
    1. Carelli V, et al. Syndromic parkinsonism and dementia associated with OPA1 missense mutations. Ann Neurol. 2015;78(1):21–38. doi: 10.1002/ana.24410. - DOI - PMC - PubMed
    1. Archer SL. Mitochondrial dynamics--mitochondrial fission and fusion in human diseases. N Engl J Med. 2013;369(23):2236–2251. doi: 10.1056/NEJMra1215233. - DOI - PubMed

MeSH terms