. 2024 Jun 25;9(15):e177898.
doi: 10.1172/jci.insight.177898.

HPV8-induced STAT3 activation led keratinocyte stem cell expansion in human actinic keratoses

Affiliations

HPV8-induced STAT3 activation led keratinocyte stem cell expansion in human actinic keratoses

Huw J Morgan et al. JCI Insight. .

Abstract

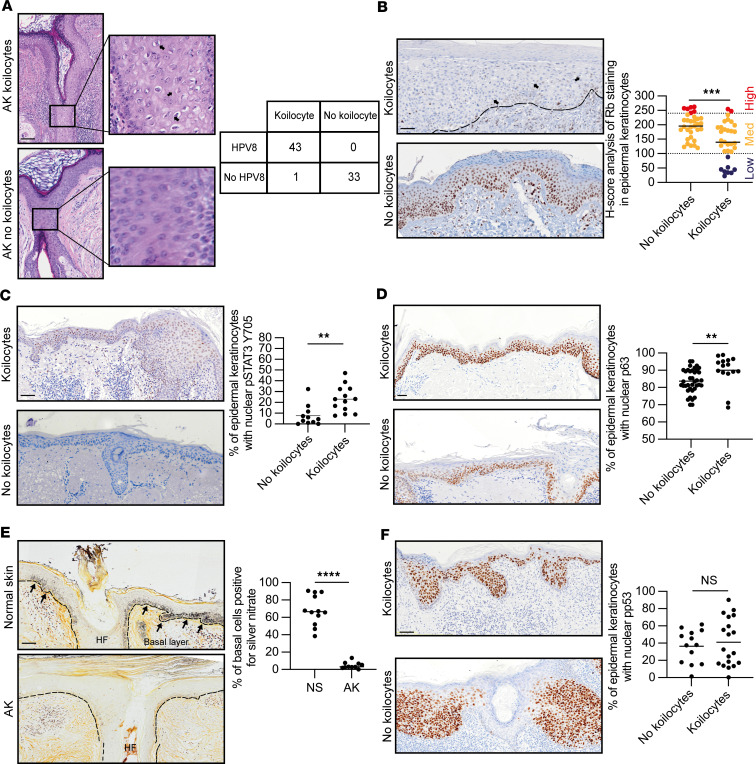
Despite epidermal turnover, the skin is host to a complex array of microbes, including viruses, such as HPV, which must infect and manipulate skin keratinocyte stem cells (KSCs) to survive. This crosstalk between the virome and KSC populations remains largely unknown. Here, we investigated the effect of HPV8 on KSCs using various mouse models. We observed that the HPV8 early region gene E6 specifically caused Lrig1+ hair follicle junctional zone KSC proliferation and expansion, which would facilitate viral transmission. Within Lrig1+ KSCs specifically, HPV8 E6 bound intracellular p300 to phosphorylate the STAT3 transcriptional regulatory node. This induced ΔNp63 expression, resulting in KSC expansion into the overlying epidermis. HPV8 was associated with 70% of human actinic keratoses. Together, these results define the "hit-and-run" mechanism for HPV8 in human actinic keratosis as an expansion of KSCs, which lack melanosome protection and are thus susceptible to sun light-induced malignant transformation.

Keywords: Adult stem cells; Cell biology; Mouse models; Skin cancer; Stem cells.


Figures

Figure 1
Figure 1. HPV8 induced Lrig1+ hair follicle junctional zone KSC proliferation and expansion.
(A) Schematic of hair follicle KSC populations. (B) Immunofluorescence labeling of WT (left) and HPV8-CERtg (right) adult back skin for involucrin (green) and keratin 14 (red). n = 11 mice (average of 10 hair follicles/mouse). Scale bar: 40 μm. (C) Schematic summary of 4 mouse lines that were crossed for lineage tracing. (D) CLSM was used to visualize Lrig1 (left) and Keratin 15 (right) promoter-driven Confetti reporter expression in progeny of WT (left) and HPV8-CERtg (right) adult mice. Scale bar: 40 μm. (E) Experimental strategy for flow-sorting Lrig1+ and CD34+ populations for within-mouse comparisons. See also Supplemental Figure 1. (F) PCA of RNA-Seq transcriptome analysis of skin KSC populations. (G) Venn diagram showing shared DEGs from Lrig1 versus CD34 comparisons from WT and HPV8 mice (see Supplemental Table 1). (H) GSEA for c-Myc–regulated genes in DEGs from transcriptomic analysis. (I) GSEA for c-Myc–regulated genes was undertaken on DEGs from Lrig1 flow-sorted HPV8-CERtg versus WT transcriptomic analysis. (J) qPCR of RNA from flow-sorted cells isolated as in E. See also Supplemental Figure 1. Statistical tests included (B) 2-tailed Student’s t test and (J) 1-way ANOVA. **P < 0.01.
Figure 2
Figure 2. Activated STAT3 regulatory node in HPV8 in Lrig1+ hair follicle junctional zone KSC.
(A) Venn diagram showing shared DEGs from HPV8-CERtg versus WT KSC comparisons. (B) GSEA of STAT3-regulated genes in DEGs from transcriptomic analysis. See also Supplemental Figure 2. (C) IHC for pSTAT3 on adult back skin from WT and HPV8-CERtg mice. Scale bar: 40 μm. (D) Immunoblot of total STAT3 (α and β isoforms) in WT and HPV8-CERtg adult back skin epidermal sheet extracts (n = 3). Dotted line is the comparator. (E) Immunoblot of pSTAT3 Y705 and S727 in WT and HPV8-CERtg adult back skin epidermal sheet nuclear extracts (n = 4). Dotted line is the comparator. (F) qPCR of RNA from flow-sorted cell isolates, as in Figure 1E, for STAT3 downstream target genes (n ≥ 3). (G) CLSM of whole-mount tail skins from WT, HPV8-CERtg, STAT3+/–, and STAT3+/– HPV8-CERtg mice for Lrig1 (green) with DAPI (blue). Scale bar: 40 μm. (H) qPCR of RNA from STAT3+/– and STAT3+/– HPV8-CERtg adult back skin epidermal sheets for ΔNp63 (n = 3). (I) qPCR of RNA from WT, STAT3+/–, and STAT3+/– HPV8-CERtg flow-sorted Lrig1+ KSCs for ΔNp63 (n = 3). Statistical tests included (DF and H) 2-tailed Student’s t test and (I) 1-way ANOVA. *P < 0.05; **P < 0.01; ***P < 0.001.
Figure 3
Figure 3. HPV8 E6 drives Lrig1+ hair follicle junctional zone KSC proliferation and expansion.
(A) H&E-stained sections from WT, HPV8-CERtg, HPV8-E2tg, HPV8-E6tg, and HPV8-E7tg adult back skin, with quantification of hair follicle length and number of cell layers in the infundibulum (n = 3 mice/genotype, average of 20–50 hair follicles/mouse). Scale bar: 40 μm. (B) CLSM of whole-mount tail skins as in A labeled for Lrig1, with quantification of Lrig1-labeled volume and the number of colabeled Ki67+ cells (average of 10 hair follicles/mouse). Scale bar: 40 μm. (C) FACS for Lrig1+ and CD34+ populations from back skin cell isolates as in A (n = 39 total). (D) qPCR of RNA from Lrig1+ flow-sorted cell isolates as in A for KSC markers (n = 3). (E) qPCR of RNA from Lrig1+ flow-sorted cell isolates as in A for ΔNp63 (n = 20 total). (F) qPCR of RNA from Lrig1+ flow-sorted cell isolates as in A for keratin 10 (n = 3). (G) CFE of 2,500 flow-sorted Lrig1+ keratinocytes from WT and HPV8-E6tg adult back skin epidermal sheets (n = 11 total). (H) qPCR of RNA from Lrig1+ and CD34+ flow-sorted cell isolates from HPV8-E6tg adult back skin epidermal sheets (n = 3). (I) IHC for Lrig1 together with YAP (left) and p63 (right) on WT and HPV8-E6tg adult back skin. Scale bar: 40 μm. See also Supplemental Figure 2. Statistical tests included (AF) 1-way ANOVA and (G and H) 2-tailed Student’s t test. *P < 0.05; **P < 0.01; ***P < 0.001.
Figure 4
Figure 4. Lrig1+ hair follicle junctional zone KSC progeny retain KSCs.
(A) Immunoblot of pSTAT3 Y705 and S727, with TATA-Box binding protein (TBP) control (n = 3). (B) CLSM of dorsal back skin for lineage tracing of Lrig1CreERT2:R26RConfetti:WT and Lrig1CreERT2:R26RConfetti:HPV8-E6tg progeny, 4 weeks after Cre activation. Scale bar: 40 μm. (C) Enumerated Lrig1+Confetti+ cells and their progeny Lrig1Confetti+ flow-sorted cell populations from Lrig1CreERT2:R26RConfetti:HPV8-E6tg and Lrig1CreERT2:R26RConfetti:WT mice (n = 25 total). (D) Immunoblot of Lrig1+Confetti+ cells and their progeny Lrig1Confetti+ flow-sorted cell populations (n = 3). (E) Venn diagram showing shared DEGs from Confetti HPV8 E6 versus Confetti WT comparisons for Lrig1+Confetti+ and Lrig1 Confetti+ populations (see Supplemental Table 2). (F) GSEA for STAT3- and EMT-associated gene signatures in DEGs from Lrig1+Confetti+ transcriptomic comparison of Confetti HPV8 E6 versus Confetti WT analysis. (G) GSEA for STAT3-, EMT- and differentiation-associated gene signatures in DEGs from Lrig1Confetti+ transcriptomic comparison of Confetti HPV8 E6 versus Confetti WT analysis. (H) GSEA for STAT3- and EMT-associated gene signatures in DEGs from Confetti HPV8 E6 transcriptomic comparison of Lrig1+Confetti+ and Lrig1Confetti+ population analysis. See also Supplemental Figure 3. (I) qPCR of RNA from flow-sorted cell isolates as in C for STAT3-regulated genes (n = 3). (J) CFE of 2,500 flow-sorted Lrig1+Confetti+ and Lrig1Confetti+ flow-sorted cell populations from Lrig1CreERT2:R26RConfetti:HPV8-E6tg (n = 4). See also Supplemental Figure 3. Statistical tests included (A, D, and I) 1-way ANOVA and (C and J) 2-tailed Student’s t test. *P < 0.05; **P < 0.01; ***P < 0.001; ****P < 0.0001.
Figure 5
Figure 5. HPV8 E6 p300 interaction activates STAT3.
(A) pSTAT3 Y705 immunoblot, with laminin A/C control, of nuclear extracts from transduced HaCaT keratinocytes (n = 3). (B) qPCR of RNA from transduced HaCaT keratinocytes for STAT3-regulated genes, with β-actin as control (n = 3). (C) Immunoblot of ΔNp63 and involucrin, with GAPDH as control, of transduced HaCaT keratinocytes cultured in high-calcium (60 μm) media for 3 and 5 days (n = 3). (DF) Proliferation (n = 3) (D), CFE assay (n = 7) (E), and migration (n = 3) (F) of transduced HaCaT keratinocytes. (G) String analysis demonstrating the interaction of known HPV8 E6 protein binding partners and STAT3. Line colors define interactions as experimentally determined (pink) or from curated database (blue). (H) p300 with GAPDH control immunoblot of WT and HPV8-E2tg, -E6tg and -E7tg mouse keratinocytes (n = 3/genotype). (I) p300, α-tubulin, and DAPI immunofluorescence labeling of transduced HaCaT keratinocytes (n = 3). Scale bar: 40mm. (J) p300, pSTAT3 Y705, and ΔNp63 immunoblot, with GAPDH endogenous control, of HPV8 E6–transduced HaCaT keratinocytes treated with scrambled control and p300 targeting siRNA (n = 3). (K) STAT3 and ΔNp63 immunoblot, with GAPDH control, of HPV8 E6–transduced HaCaT keratinocytes treated with scrambled control and STAT3 targeting siRNA (n = 3). (L) Immunoblot of STAT3 immunoprecipitated nuclear protein from vector and HPV8 E6–transduced HaCaT keratinocytes probed for acetylated STAT3 and total STAT3 (n = 3). (M) qPCR analysis of ΔNp63 primers on STAT3 chromatin immunoprecipitants in HPV8 E6–transduced HaCaT keratinocytes relative to vector (n = 3). Schematic of the 5′-flanking region indicating primers sequences relative to STAT3-RE and ΔNp63 TSS. See also Supplemental Figure 4. Statistical tests included (A, CF, H, and I) 1-way ANOVA and (B and JM) 2-tailed Student’s t test. *P < 0.05; **P < 0.01; ***P < 0.001; ****P < 0.0001.
Figure 6
Figure 6. YAP a cotranscription factor for STAT3 and
ΔNp63. (A and B) pSTAT3 Y705, ΔNp63, and YAP immunoblot, with TATA-box binding protein endogenous control, of nuclear extracts from Lrig1+ flow-sorted WT and HPV8-E6tg mouse keratinocytes (A) and HPV8 E6– and vector control–transduced HaCaT keratinocytes (B) (n = 3 per genotype/cell line). (C) pSTAT3 Y705, total STAT3 and YAP immunoblot, with GAPDH endogenous loading control, of HPV8 E6–transduced HaCaT keratinocytes treated with scrambled control and YAP targeting siRNA (n = 3). (D) Immunofluorescence labeling of HPV8 E6– and vector control–transduced HaCaT keratinocytes cultured at low (~50%) and high (~90%) confluency for YAP (green), pSTAT3 Y705 (red), and ΔNp63 (yellow), with quantification of nuclear mean fluorescent intensity (n = 82 cells total quantified over 3 independent experiments). Scale bar: 40 μm. (E) Immunoblot of YAP immunoprecipitated nuclear protein from vector control– and HPV8 E6–transduced HaCaT cells probed for STAT3 and ΔNp63 (n = 3). (F) Proliferation of HPV8 E6– and vector control–transduced HaCaT keratinocytes assessed by 24 hours of BrdU incorporation following treatment with YAP targeting siRNA (n = 3). See also Supplemental Figure 5. Statistical tests included (AE) 2-tailed Student’s t test and (F) 1-way ANOVA. *P < 0.05; **P < 0.01; ***P < 0.001.
Figure 7
Figure 7. HPV8 reactivation in actinic keratosis with koilocytes.
(A) (Left) H&E-stained human AK sections with and without koilocytes. (Right) Presence of koilocytes by HPV8 detection using β-HPV L1 open reading frame PCR-reverse hybridization assay. See also Supplemental Figure 6A. Arrows indicate the presence of koilocytes. Scale bar: 50 μm. Original magnification, ×40 (high-magnification images). (BD) IHC of human AK tissue for Rb (n = 64), pSTAT3 Y705 (n = 24) and p63 (n = 53). Arrows indicate the presence of koilocytes. Scale bar: 50 μm. (E) Warthin-Starry stain of human AK tissue (n = 24). Arrows indicate the presence of koilocytes. Scale bar: 50 μm. (F) IHC of human AK tissue for p53 (n = 32). Scale bar: 50 μm. See also Supplemental Figure 6. Statistical tests included (BF). 2-tailed Student’s t test. **P < 0.01; ***P < 0.001; ****P < 0.0001.

Similar articles

Cited by

References

    1. Hannigan GD, et al. The human skin double-stranded DNA virome: Topographical and temporal diversity, genetic enrichment, and dynamic associations with the host microbiome. mBio. 2015;6(5):e01578–15. doi: 10.1128/mBio.01578-15. - DOI - PMC - PubMed
    1. Saheb Kashaf S, et al. Integrating cultivation and metagenomics for a multi-kingdom view of skin microbiome diversity and functions. Nat Microbiol. 2022;7(1):169–179. doi: 10.1038/s41564-021-01011-w. - DOI - PMC - PubMed
    1. Kumata R, et al. A tissue level atlas of the healthy human virome. BMC Biol. 2020;18(1):55. doi: 10.1186/s12915-020-00785-5. - DOI - PMC - PubMed
    1. Doorbar J. The papillomavirus life cycle. J Clin Virol. 2005;32 Suppl 1:S7–S15. - PubMed
    1. Potočnik M, et al. Beta-papillomaviruses in anogenital hairs plucked from healthy individuals. J Med Virol. 2006;78(12):1673–1678. doi: 10.1002/jmv.20753. - DOI - PubMed

MeSH terms

Substances