. 2024 Jul 11;67(13):10567-10588.
doi: 10.1021/acs.jmedchem.3c02164. Epub 2024 Jun 25.

Development of a Potent and Selective G2A (GPR132) Agonist

Affiliations

Development of a Potent and Selective G2A (GPR132) Agonist

Victor Hernandez-Olmos et al. J Med Chem. .

Abstract

G protein-coupled receptor G2A was postulated to be a promising target for the development of new therapeutics in neuropathic pain, acute myeloid leukemia, and inflammation. However, there is still a lack of potent, selective, and drug-like G2A agonists to be used as a chemical tool or as the starting matter for the development of drugs. In this work, we present the discovery and structure-activity relationship elucidation of a new potent and selective G2A agonist scaffold. Systematic optimization resulted in (3-(pyridin-3-ylmethoxy)benzoyl)-d-phenylalanine (T-10418) exhibiting higher potency than the reference and natural ligand 9-HODE and high selectivity among G protein-coupled receptors. With its favorable activity, a clean selectivity profile, excellent solubility, and high metabolic stability, T-10418 qualifies as a pharmacological tool to investigate the effects of G2A activation.


Conflict of interest statement

The authors declare the following competing financial interest(s): Y.S.M. is a CEO at Chemspace LLC and a scientific advisor at Enamine Ltd. V.V.I. is a Chief Sales Officer at Enamine Ltd.

Figures

Figure 1
Figure 1
Structures of 9(S)-HODE (A), SB-583831 (B), SKF-95667 (C), SB-583355 (D), GSK1820795A (E), ONC201 (F), and ONC212 (G).
Figure 2
Figure 2
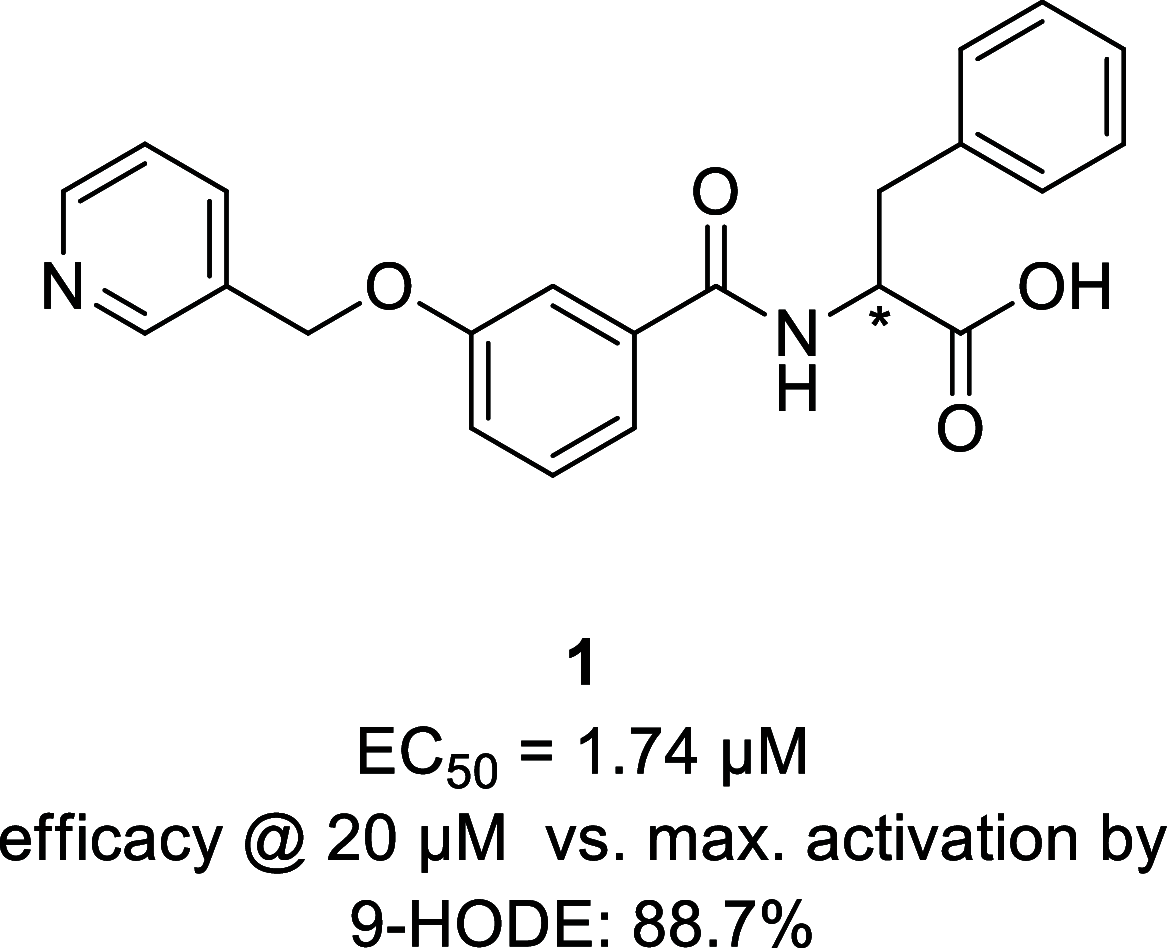
Compound 1, the most promising candidate from the HTS campaign.
Figure 3
Figure 3
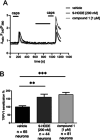
Compound 1 potently sensitized capsaicin-induced TRPV1 responses in mouse primary sensory neurons. (A) Representative traces of capsaicin-induced calcium responses in mouse sensory neurons. Neurons were incubated with vehicle [DMSO, 0.013% (v/v) black], (±)9-HODE (200 nM, 2 min, gray), or compound 1 (1 μM, 2 min, light gray) 2 min prior to the second capsaicin stimulus. Stimulations with capsaicin (100 nM) took place for 30 s as indicated. (B) Statistical analysis of the amplitudes of the second capsaicin responses with the respective conditions. Data are shown as mean ± SEM from n = 44 to 81 neurons, **p < 0.01, ***p < 0.001, one-way ANOVA with Tukeýs post hoc test.
Scheme 1
Scheme 1. Synthetic Procedure Used for the Synthesis of Compounds 233
Conditions. (a) HOBt, TEA, DMF. (b) KOH/H2O, DMSO.
Scheme 2
Scheme 2. Conditions: (a) Cs2CO3, DMF, 85% for 34, 56–70% for 4547. (b) LiOH/H2O, THF, MeOH, 71% for 35, 30–63% for, 4043 and 4850. (c) HBTU, EDCl, 4-Methylmorpholine, 52%-Quant
For 3639, 79% for 44.
Scheme 3
Scheme 3. Conditions: (a) Cs2CO3, DMF, 81%. (b) LiOH/H2O, THF, MeOH, 70% for 51, 61% for 54. (c) HBTU, EDCl, 4-Methylmorpholine, 62%
Figure 4
Figure 4
SAR summary.
Scheme 4
Scheme 4. Conditions: (a) Pd(OAc)2, Cs2CO3, DMF, H2O, 45 °C 83%. (b) HBTU, EDCl, 4-Methylmorpholine, DMF 20%
Figure 5
Figure 5
Target engagement in human G2A expressing CHO-K1 cells by second messenger and β-arrestin recruitment. (A) Antagonist 56 (SB-583355) blocked activation of G2A mediated either by 9-HODE or T-10418. Activity was determined in a cell-based functional assay with detection of accumulation of IP-1 (IP-One assay). CHO-K1 cells stably expressing human G2A in combination with human GNA 11 were stimulated with the indicated concentrations of compounds. Data represent mean ± SD (3 technical replicates, N = 3). Even when T-10418 and (±)9-HODE were applied at circa EC80., which corresponds to 3 and 12.5 μM, respectively, 56 completely suppressed activation of G2A. (B) NanoLuc βarr2 recruitment assay. CHO-K1 expressing human G2A-SmBit and LgBit-βarr2 were treated with T-10418 (red), which resulted in a dose-dependent complementation of NanoLuc only in cells expressing G2A-SmBit; EC50 = 7.7 μM. Treatment with 9(S)-HODE resulted in a comparably strong response. Racemic 9-HODE was unable to stimulate the same degree of β-arrestin recruitment, which can be explained by the observation that 9(R)-HODE did not result in any observable NanoLuc complementation. As an additional control, cells expressing LgBit-βarr2 alone did not show any response when stimulated with T-10418 (gray; no G2A). Presented data were recorded 15 min after addition of compound. Data are fold RLU (relative light units) as mean ± SD; N = 3.
Figure 6
Figure 6
Compound T-10418 potently sensitized capsaicin-induced TRPV1 responses in primary mouse sensory neurons. (A) Representative traces of capsaicin-induced calcium responses in mouse sensory neurons for T-10418. Neurons were incubated for 4 min with vehicle (DMSO, 0.01% (v/v) black), T-10418 (100 nM, gray), or a combination of 100 nM T-10418 and 10 μM 56 (light gray) 4 min prior to the second capsaicin stimulus. Stimulations with capsaicin (50 nM) took place for 20 s as indicated. (B) Statistical analysis of the amplitudes of the second capsaicin responses with the respective conditions; (±)9-HODE (400 nM), T-10418 (100 nM), 56 (10 μM), a combination, or DMSO (0.01%) alone as vehicle control. Data are shown as mean ± SEM from n = 32 to 72 neurons. Stimulation with agonists vs vehicle: ##p < 0.01, ####p < 0.0001; reduction observed with antagonist: ****p < 0.0001, Kruskal–Wallis with Dunn’s post hoc test.
Figure 7
Figure 7
PRESTO-Tango GPCR selectivity screen conducted with 10 μM compound T-10418.
Figure 8
Figure 8
Influence of T-10418 on receptor internalization at CMKLR1 and GPR1. HEK293 cells stably express CMKLR1-eYFP (A) or GPR1-eYFP (B). They were treated with 30 μM of T-10418 (green) or 0.3% DMSO (black, control) and a serial dilution of TAMRA-labeled chemerin-9 [TAMRA-(EG)4-C9]. The uptake of TAMRA-(EG)4-C9 was detected as an increase in FI. Presence of 30 μM T-10418 resulted in a shift in TAMRA-(EG)4-C9 concentration dependent uptake (B) whereas no change was observed at CMKLR1 (A) compared to control. The calculated values of this experiment are summarized in table (C). All data points represent mean ± SEM from at least three independent experiments performed in duplicate. The results were analyzed using GraphPad prism and nonlinear fit of log(agonist) vs response (three parameter). Internalization of GPR1-eYFP (green fluorescence) stimulated by 1 μM of TAMRA-(EG)4-C9 (red fluorescence) is illustrated in (D). TAMRA-(EG)4-C9 colocalized with GPR1-eYFP. An experiment involving a negative control peptide named TAMRA-(EG)4-scr2C9 (red fluorescence; scrambled C9 sequence) showed that the control peptide was removed in the wash step and that it did not stimulate internalization of GPR1 (D, upper panel). Data about the TAMRA-(EG)4-scr2C9 have been published previously. Hoechst33324 was used to stain the nuclei. Scale bar = 50 μm.
Figure 9
Figure 9
Influence of T-10418 on βarr2 recruitment BRET at CMKLR1 and GPR1. HEK293 cells expressing either GPR1-eYFP or CMKLR1-eYFP and βarr2-Nluc. Stimulation was performed with 60 μM of T-10418 (green) or 0.6% DMSO (black, control) and a serial dilution of chemerin-9 (C9). No influence of T-10418 at CMKLR1 (A) was observed but for GPR1, a lag in full βarr2 recruitment was determined (B). With a submaximal concentration of C9 (EC80), a reduction of βarr2 recruitment to only 50% was observed after adding the highest concentrations of T-10418, and consequently on C9-EC50 stimulated cells, βarr2 recruitment was not affected by T-10418. Remarkably, T-10418 showed partial agonism when GPR1-containing cells are costimulated with EC20 of C9 (C). Table (D) summarizes the calculated values of the βarr2 recruitment experiments shown in (A,B). All data points represent mean ± SEM from at least two independent experiments performed in triplicate. The results were analyzed by using GraphPad prism for nonlinear fit of log(agonist) vs response (three parameter). (E) demonstrates the partial agonism of T-10418 saturated at high concentrations compared to much lower concentration (1 μM) for C9 stimulation of GPR1 in the βarr2 recruitment BRET. As a control, only buffer and DMSO were added instead of peptide C9 or compound T-10418. ANOVA with the posthoc Dunnett’s multiple comparison test was used for significance evaluation to define the variance compared to control. *p < 0.05, ***p < 0.001.
Figure 10
Figure 10
Displacement of bound TAMRA-labeled C9 in orthosteric binding pocket at Nluc-GPR1. HEK293 cells containing Nluc-GPR1-eYFP were stimulated with a constant concentration of 10 nM TAMRA-labeled chemerin-9 (TAMRA-C9). Different concentrations of T-10418 (green) or chemerin-9 (C9, black, control) were used to displace TAMRA-C9. Data represent mean ± SEM from three independent experiments performed in triplicate. The results were analyzed by using GraphPad prism and nonlinear fit of log(inhibitor) vs response (three parameter).
Figure 11
Figure 11
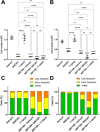
No antileukemic effect induced by T-10418. (A,B) Cell numbers of the AML cell lines Molm-13 (A) and ML2 (B) after 72 h of treatment in vitro. Single compounds or combinations were used as indicated with the following concentrations: ONC201, 30 μM; T-10418, 30 μM; ABT199, 200 nM. (C,D) AnnexinV/7-AAD staining for early (AnnexinV+/7-AAD-) and late apoptotic cells (AnnexinV+/7-AAD+) in Molm-13 (C) and ML2 (D) after 24 h of treatment in vitro. Single compounds or combinations were used as indicated at following concentrations: ONC201, 30 μM; T-10418, 30 μM; ABT199, 100 nM, one-way ANOVA with Tukey multiple comparisons test, ns, not significant; **P < 0.01; ***P < 0.001; ****P < 0.0001.

References

    1. Weng Z.; Fluckiger A.-C.; Nisitani S.; Wahl M. I.; Le L. Q.; Hunter C. A.; Fernal A. A.; Le Beau M. M.; Witte O. N. A DNA Damage and Stress Inducible G Protein-Coupled Receptor Blocks Cells in G 2/M. Proc. Natl. Acad. Sci. U.S.A. 1998, 95 (21), 12334–12339. 10.1073/pnas.95.21.12334. - DOI - PMC - PubMed
    1. Foord S. M.; Bonner T. I.; Neubig R. R.; Rosser E. M.; Pin J.-P.; Davenport A. P.; Spedding M.; Harmar A. J. International Union of Pharmacology. XLVI. G Protein-Coupled Receptor List. Pharmacol. Rev. 2005, 57 (2), 279–288. 10.1124/pr.57.2.5. - DOI - PubMed
    1. Justus C. R.; Dong L.; Yang L. V. Acidic Tumor Microenvironment and pH-Sensing G Protein-Coupled Receptors. Front. Physiol. 2013, 4, 70722. 10.3389/fphys.2013.00354. - DOI - PMC - PubMed
    1. Ludwig M.-G.; Vanek M.; Guerini D.; Gasser J. A.; Jones C. E.; Junker U.; Hofstetter H.; Wolf R. M.; Seuwen K. Proton-Sensing G-Protein-Coupled Receptors. Nature 2003, 425 (6953), 93–98. 10.1038/nature01905. - DOI - PubMed
    1. Sisignano M.; Fischer M. J. M.; Geisslinger G. Proton-Sensing GPCRs in Health and Disease. Cells 2021, 10 (8), 2050. 10.3390/cells10082050. - DOI - PMC - PubMed

Publication types

MeSH terms

LinkOut - more resources