. 2024 Aug 12;52(14):8286-8302.
doi: 10.1093/nar/gkae526.

SUMO protease and proteasome recruitment at the nuclear periphery differently affect replication dynamics at arrested forks

Affiliations

SUMO protease and proteasome recruitment at the nuclear periphery differently affect replication dynamics at arrested forks

Kamila Schirmeisen et al. Nucleic Acids Res. .

Abstract

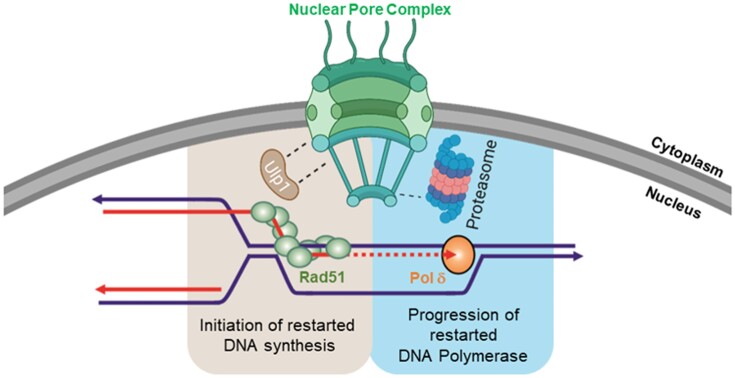
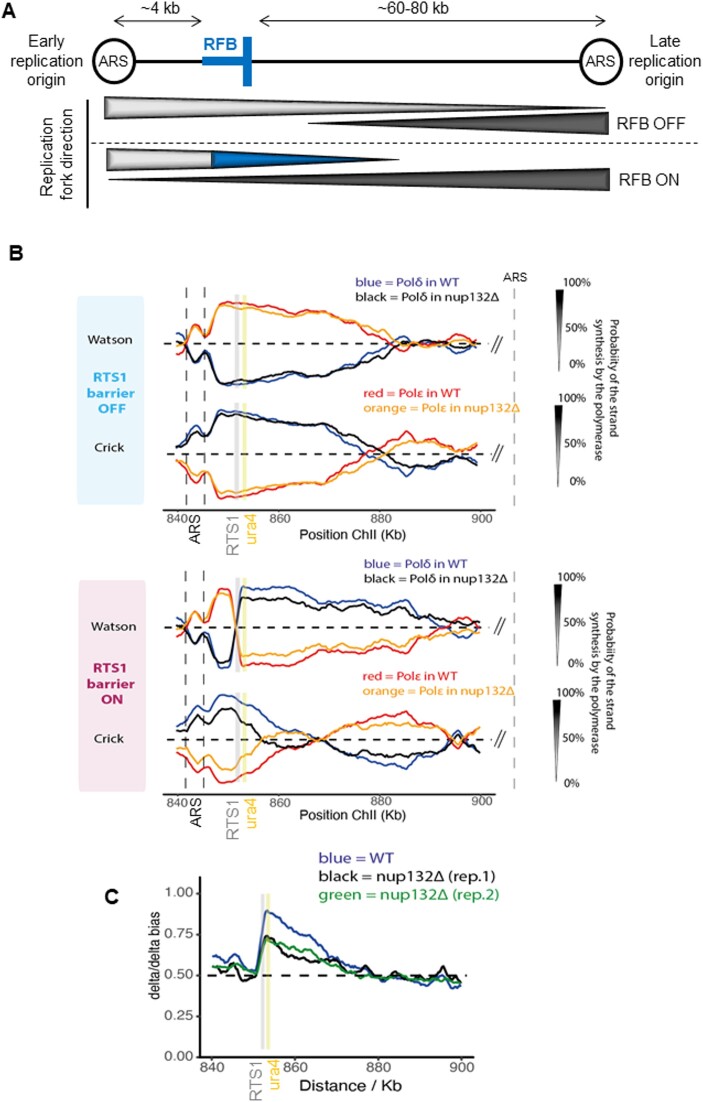
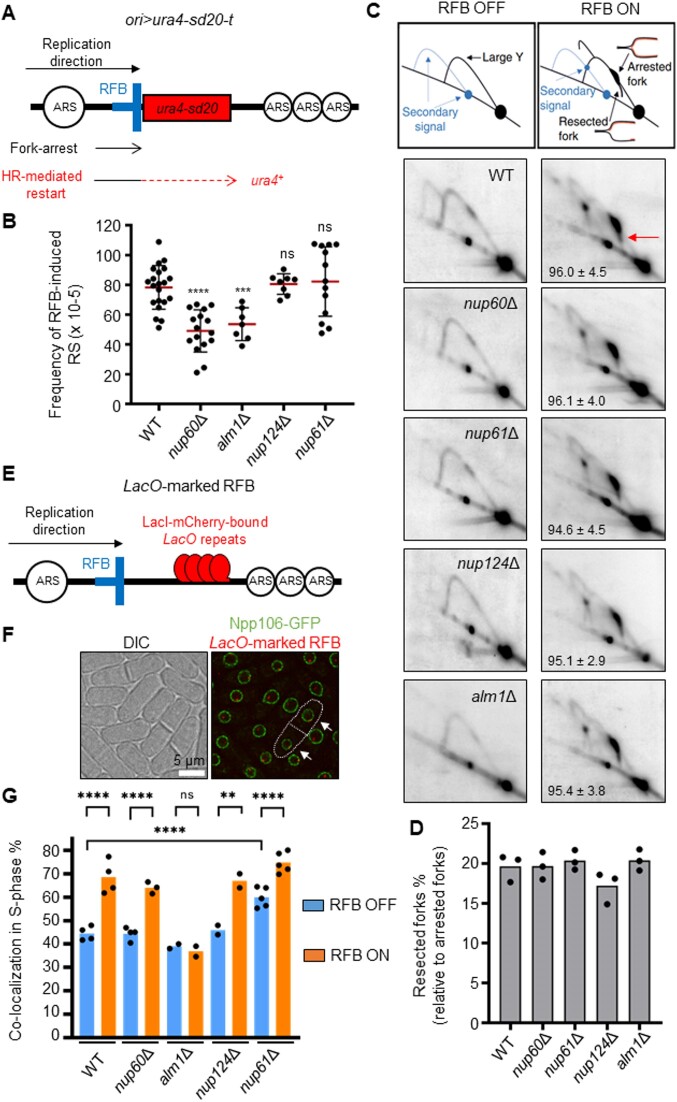
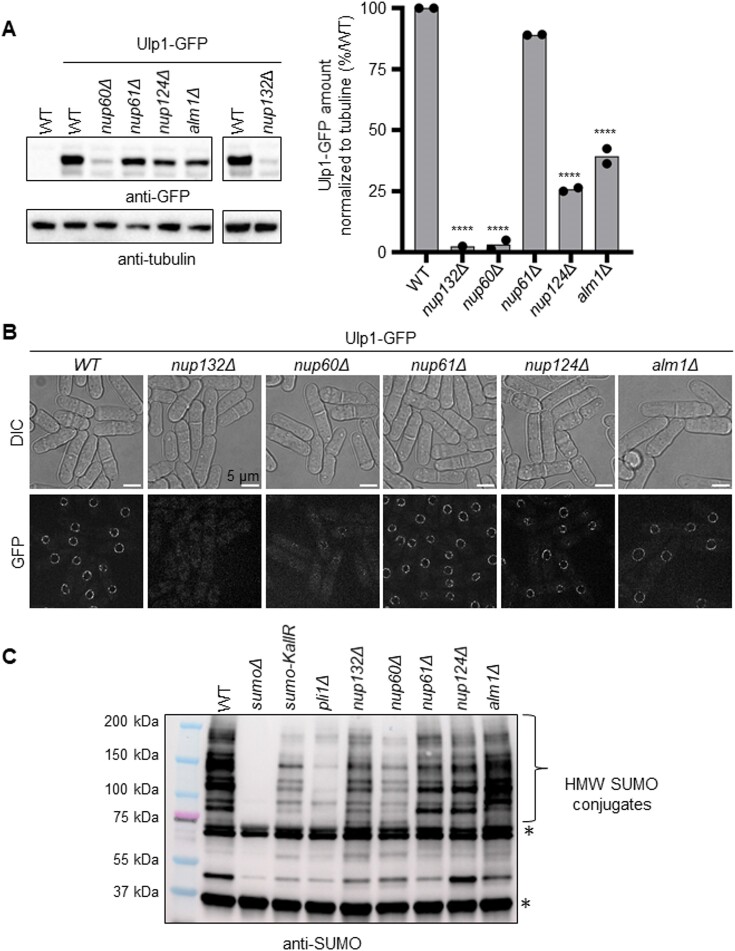
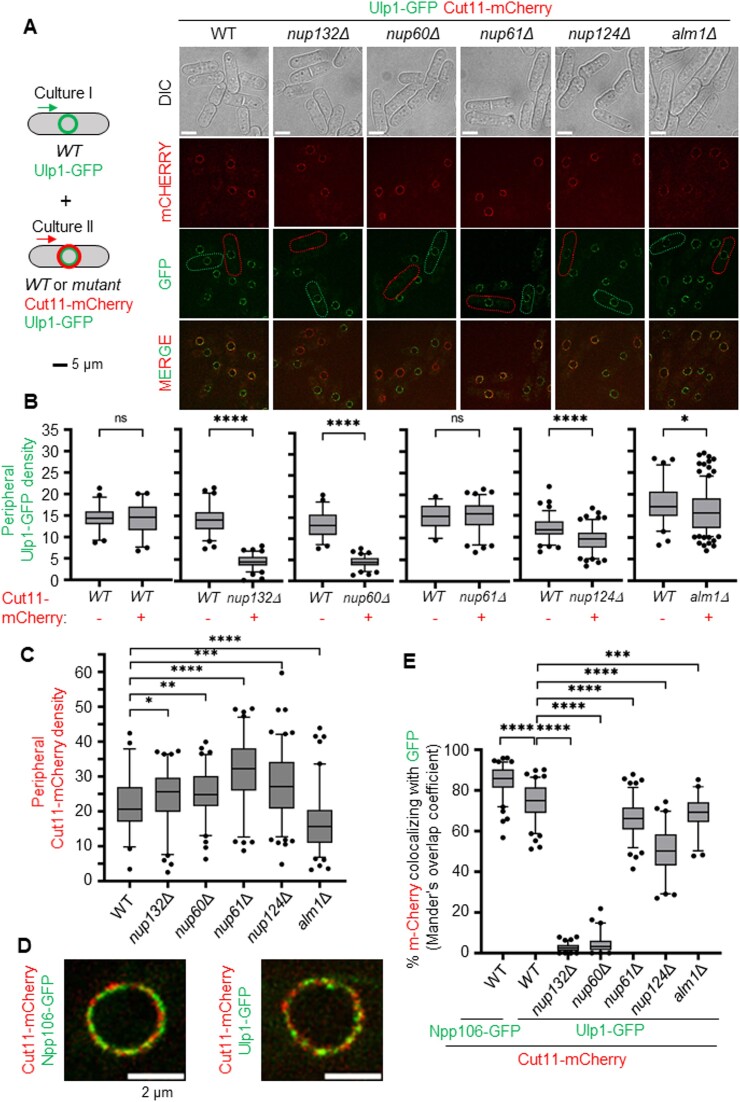
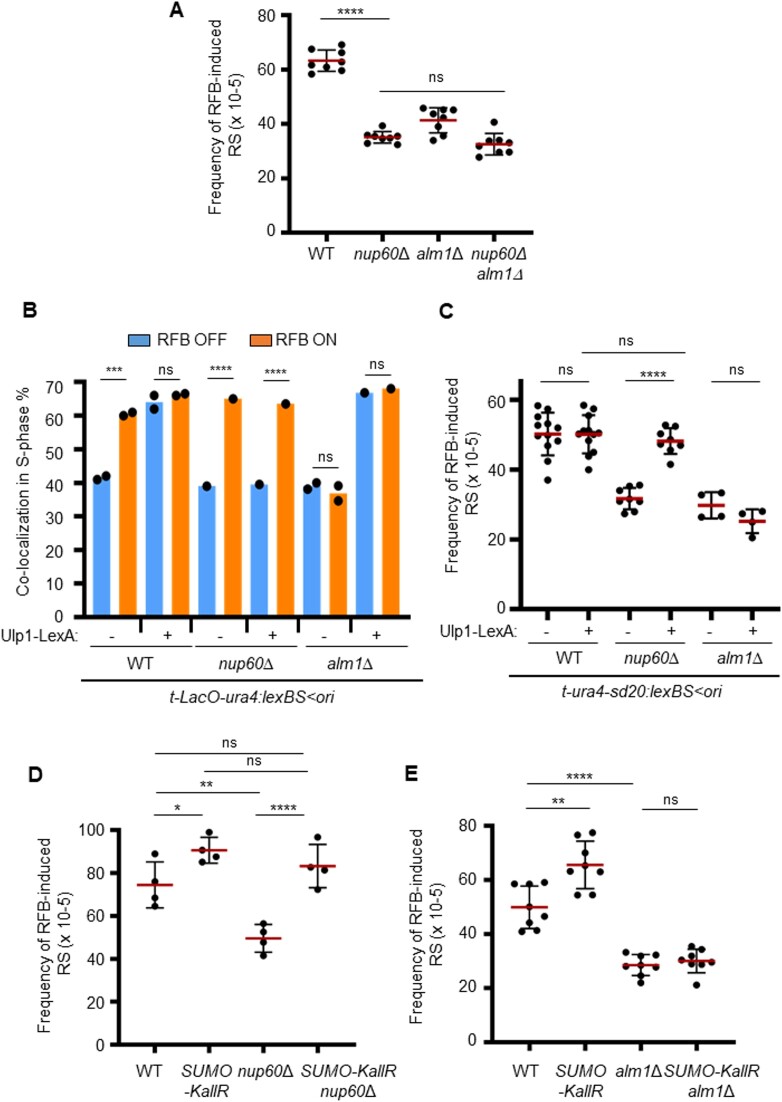
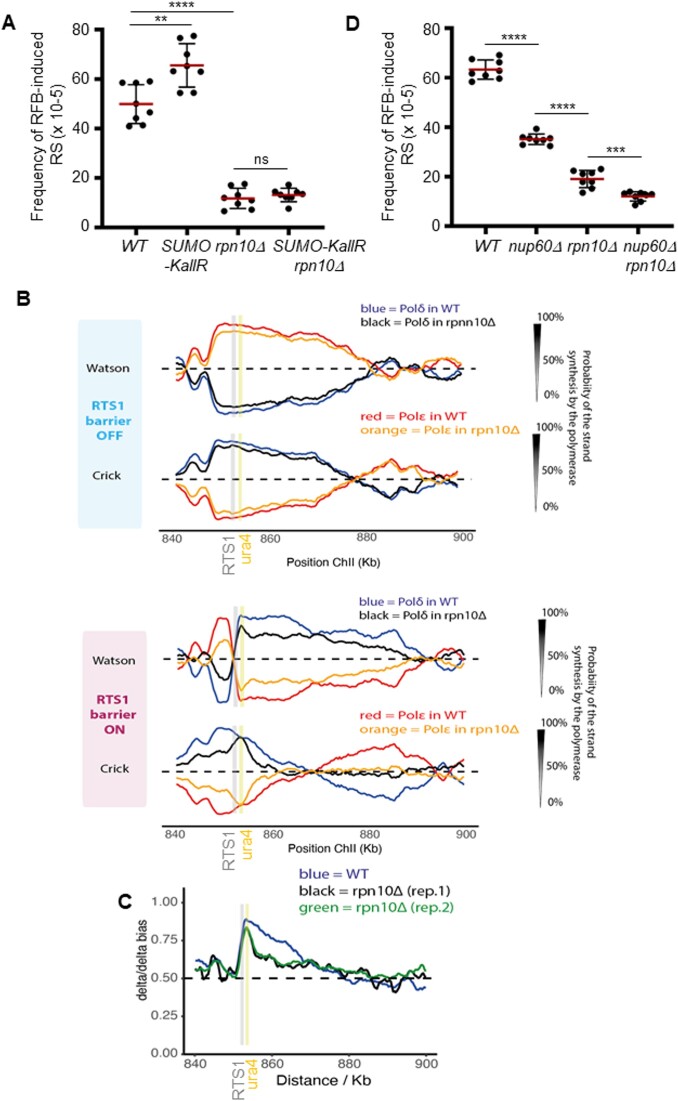
Nuclear pore complexes (NPCs) have emerged as genome organizers, defining a particular nuclear compartment enriched for SUMO protease and proteasome activities, and act as docking sites for the repair of DNA damage. In fission yeast, the anchorage of perturbed replication forks to NPCs is an integral part of the recombination-dependent replication restart mechanism (RDR) that resumes DNA synthesis at terminally dysfunctional forks. By mapping DNA polymerase usage, we report that SUMO protease Ulp1-associated NPCs ensure efficient initiation of restarted DNA synthesis, whereas proteasome-associated NPCs sustain the progression of restarted DNA polymerase. In contrast to Ulp1-dependent events, this last function is not alleviated by preventing SUMO chain formation. By analyzing the role of the nuclear basket, the nucleoplasmic extension of the NPC, we reveal that the activities of Ulp1 and the proteasome cannot compensate for each other and affect the dynamics of RDR in distinct ways. Our work probes two distinct mechanisms by which the NPC environment ensures optimal RDR, both controlled by different NPC components.


Figures

Graphical Abstract
Graphical Abstract
Figure 1.
Figure 1.
Ulp1-associated NPC promotes the dynamics of recombination-mediated fork restart. (A) Schematic of the RTS1-RFB locus on chromosome II. The position of the RTS1-RFB is indicated as thick blue bars. The directional RFB blocks the progression of right-moving forks that initiate from the left autonomously replicating sequence (ARS). The direction of unperturbed (RFB OFF) and perturbed replication (RFB ON) forks is indicated by the thickness of the arrows underneath. Light and dark gray bars indicate the progression of canonical rightward and leftward-moving forks, respectively. The blue bar indicates the progression of restarted replication forks mediated by homologous recombination. (B) Pu-Seq traces of the ChrII locus in RTS1-RFB OFF (top panel) and ON (bottom panel) conditions in WT and nup132Δ strains. The usage of Pol delta (in blue and black for WT and nup132Δ cells, respectively) are shown on the Watson and Crick strands. The usage of Pol epsilon (in red and orange for WT and nup132Δ cells, respectively) are shown on the Watson and Crick strands. Note the switch from Pol epsilon to Pol delta on the Watson strand at the RFB site (gray bar), which is indicative of a change in polymerase usage on the leading strand in RFB ON condition. The genomic location of the ARS, the RTS1-RFB and the ura4 marker are indicated by dashed lines, a gray line and a yellow line, respectively. (C) Graph of Pol delta/delta bias over both strands (Watson and Crick) around the RFB site in WT and two independent replicates of nup132Δ strains. The gray and yellow bars indicate the position of the RTS1-RFB and of the ura4 marker, respectively.
Figure 2.
Figure 2.
The nuclear basket promotes recombination-dependent replication in a pre- and post-anchoring manner. (A) Diagram of the ori > ura4-sd20-t construct on chromosome III (ori: replication origin, >: RTS1-RFB orientation that block right-moving forks, t: telomere). The non-functional ura4-sd20 allele (red box), containing a 20 nt duplication flanked by micro-homology, is located downstream of the RFB (blue bar). During HR-mediated fork restart, the ura4-sd20 allele is replicated by an HR-associated DNA synthesis that is liable to replication slippage (RS) resulting in the deletion of the duplication and the restoration of a functional ura4+ gene (34). ARS: autonomously replicating sequence. (B) Frequency of RFB-induced RS in indicated strains. Each dot represents one sample from independent biological replicate. Red bars indicate mean values ± standard deviation (SD). P value was calculated by two-sided t-test (**** P ≤ 0.0001; *** P ≤ 0.001; ns: non-significant). (C) Top panel: scheme of replication intermediates (RI) analyzed by neutral-neutral 2DGE of the AseI restriction fragment in RFB OFF and ON conditions. Partial restriction digestion caused by psoralen-crosslinks results in a secondary arc indicated on scheme by blue dashed lines. Bottom panels: representative RI analysis in indicated strains and conditions. The ura4 gene was used as a probe. Numbers indicate the % of forks blocked by the RFB ± SD. The red arrow indicates the tail signal resulting from resected forks. (D) Quantification of resected forks in indicated strains. Dots represent values obtained from independent biological experiments. No statistical difference was detected between the samples using the two-sided t-test. (E) Diagram of the LacO-marked RFB. LacO arrays bound by mCherry-LacI (red ellipses) are integrated ∼7 kb away from the RTS1-RFB (blue bar). (F) Example of fluorescence (right panel) and bright-field images (left panel, DIC) cells expressing the endogenous Npp106-GFP fusion protein and harboring the LacO-marked RFB. Mono-nucleated cells and septated bi-nucleated cells correspond to G2 and S-phase cells, respectively. White arrows indicate co-localization events in S-phase cells. Scale bar: 5 μm. (G) Quantification of co-localization events, shown in f, in S-phase cells in indicated conditions and strains. Dots represent values obtained from independent biological experiments. At least 100 nuclei were analyzed for each strain and condition. Fisher's exact test was used for group comparison to determine the P value (****P ≤ 0.0001; ** P ≤ 0.01; ns: non-significant).
Figure 3.
Figure 3.
The nuclear basket regulates the expression of the SUMO SENP protease Ulp1. (A) Left panel: expression of Ulp1-GFP in indicated strains. An untagged WT strain was included as control for antibody specificity. Tubulin was used as a loading control. Right panel: quantification. The normalized amount of Ulp1 was calculated by dividing the GFP signal by tubulin signal. The normalized amount of Ulp1-GFP in the mutants is indicated as a percentage of the WT. Dots represent values obtained from independent biological experiments. P value was calculated by two-sided t-test (**** P ≤ 0.0001). (B) Example of fluorescence (bottom panel) and bright-field images (top panel, DIC) of cells expressing the endogenous Ulp1-GFP fusion protein in indicated strains. Scale bar 5 μm. (C) Expression of SUMO conjugates in indicated strains. A strain deleted for pmt3 gene that encodes the SUMO particle (sumoΔ) was added as control for antibody specificity. * indicates unspecific signal.
Figure 4.
Figure 4.
The nuclear basket contributes to sequester the SUMO SENP protease Ulp1 at the nuclear periphery. (A) Left panel: scheme of the strategy employed by equally mixing two genetically distinct cell cultures. Right panel: representative cell images of Cut11-mCherry and Ulp1-GFP in indicated strains. Green and red cell borders indicate cells from culture I (expressing Ulp1-GFP) and culture II (expressing Ulp1-GFP Cut11-mCherry), respectively. Scale bar 5 μm. (B) Box-and-whisker plots of Ulp1-GFP density (mean fluorescence intensity) at the nuclear periphery in indicated strains and conditions. Boxes represent the 25/75 percentile, black lines indicate the median, the whiskers indicate the 5/95 percentile and dots correspond to minimum and maximum values. P value was calculated by Mann–Whitney U test (**** P ≤ 0.0001; *** P ≤ 0.001; ** P ≤ 0.01; * P ≤ 0.05; ns: non-significant). At least 50 nuclei were analyzed for each strain. (C) Box-and-whisker plots of Cut11-mCherry density (mean fluorescence intensity) at the nuclear periphery in indicated strains. Boxes represent the 25/75 percentile, black lines indicate the median, the whiskers indicate the 5/95 percentile and dots correspond to minimum and maximum values. P value was calculated by Mann–Whitney U test (**** P ≤ 0.0001; *** P ≤ 0.001; ** P ≤ 0.01; * P ≤ 0.05; ns: non-significant). At least 50 nuclei were analyzed for each strain. (D) Example of the localization of Npp106-GFP and Cut11-mCherry (left panel) or Ulp1-GFP and Cut11-mCherry (right panel) on overlay images. Scale bar: 2 μm. (E) Box-and-whisker plots of co-localization between Cut11-mCherry and Ulp1-GFP (Mander's overlap coefficient) in indicated strains. The co-localization between the Npp106-GFP, an inner ring nucleoporin of NPC, and Cut11-mCherry, was performed as a control to show maximum correlation between intensities of those both proteins at the resolution achieved on the images. Boxes represent the 25/75 percentile, black lines indicate the median, the whiskers indicate the 5/95 percentile and dots correspond to minimum and maximum values. P value was calculated by Mann–Whitney U test (**** P ≤ 0.0001; *** P ≤ 0.001)
Figure 5.
Figure 5.
Tethering of Ulp1 to the RFB rescues RDR defect in nup60Δ but not in alm1Δ cells. (A) Frequency of RFB-induced RS in indicated strains and conditions. Dots represent values obtained from independent biological experiments. Red bars indicate mean values ± SD. P value was calculated by two-sided t-test (**** P ≤ 0.0001; ns: non-significant). (B) Quantification of co-localization events in S-phase cells in indicated conditions and strains. Dots represent values obtained from independent biological experiments. At least 100 nuclei were analyzed for each strain and condition. P value was calculated by two-sided Fisher's exact test (**** P ≤ 0.0001; *** P ≤ 0.001; ns: non-significant). (C–E) Frequency of RFB-induced RS in indicated strains and conditions. Dots represent values obtained from independent biological experiments. Red bars indicate mean values ± SD. P value was calculated by two-sided t-test (**** P ≤ 0.0001; ** P ≤ 0.01,* P ≤ 0.05 ns: non-significant).
Figure 6.
Figure 6.
Proteasome-associated NPCs promote the progression of restarted fork. (A) Frequency of RFB-induced RS in indicated strains and conditions. Dots represent values obtained from independent biological experiments. Red bars indicate mean values ± SD. P value was calculated by two-sided t-test (**** P ≤ 0.0001; *** P ≤ 0.001, ** P ≤ 0.01; ns: non-significant). (B) Pu-Seq traces of the ChrII locus in RTS1-RFB OFF (top panel) and ON (bottom panel) conditions in WT and rpn10Δ strains. The usage of Pol delta (in blue and black for WT and rpn10Δ cells, respectively) are shown on the Watson and Crick strands. The usage of Pol epsilon (in red and orange for WT and rpn10Δ cells, respectively) are shown on the Watson and Crick strands. Note that the switch from Pol epsilon to Pol delta on the Watson strand at the RFB site (gray bar) is indicative of a change in polymerase usage on the leading strand in RFB ON condition. The genomic location of the ARS, the RTS1-RFB and the ura4 marker are indicated by dashed lines, a gray line and a yellow line, respectively. (C) Graph of Pol delta/delta bias in RFB ON condition according to chromosome coordinates in WT and two independent replicates of rpn10Δ strains. The gray and yellow bars indicate the position of the RTS1-RFB and of the ura4 marker, respectively. (D) Frequency of RFB-induced RS in indicated strains and conditions. Dots represent values obtained from independent biological experiments. Red bars indicate mean values ± SD. P value was calculated by two-sided t-test (**** P ≤ 0.0001; *** P ≤ 0.001).

References

    1. Misteli T., Soutoglou E.. The emerging role of nuclear architecture in DNA repair and genome maintenance. Nat. Rev. Mol. Cell Biol. 2009; 10:243–254. - PMC - PubMed
    1. Ait Saada A., Lambert S.A.E., Carr A.M.. Preserving replication fork integrity and competence via the homologous recombination pathway. DNA Repair (Amst.). 2018; 71:135–147. - PMC - PubMed
    1. Berti M., Cortez D., Lopes M.. The plasticity of DNA replication forks in response to clinically relevant genotoxic stress. Nat. Rev. Mol. Cell Biol. 2020; 21:633–651. - PubMed
    1. Chakraborty S., Schirmeisen K., Lambert S.A.. The multifaceted functions of homologous recombination in dealing with replication-associated DNA damages. DNA Repair (Amst.). 2023; 129:103548. - PubMed
    1. Carr A., Lambert S.. Recombination-dependent replication: new perspectives from site-specific fork barriers. Curr. Opin. Genet. Dev. 2021; 71:129–135. - PubMed

MeSH terms

Substances

LinkOut - more resources