. 2024 Aug 8;187(16):4389-4407.e15.
doi: 10.1016/j.cell.2024.05.039. Epub 2024 Jun 24.

Pan-cancer proteogenomics expands the landscape of therapeutic targets

Affiliations

Pan-cancer proteogenomics expands the landscape of therapeutic targets

Sara R Savage et al. Cell. .

Abstract

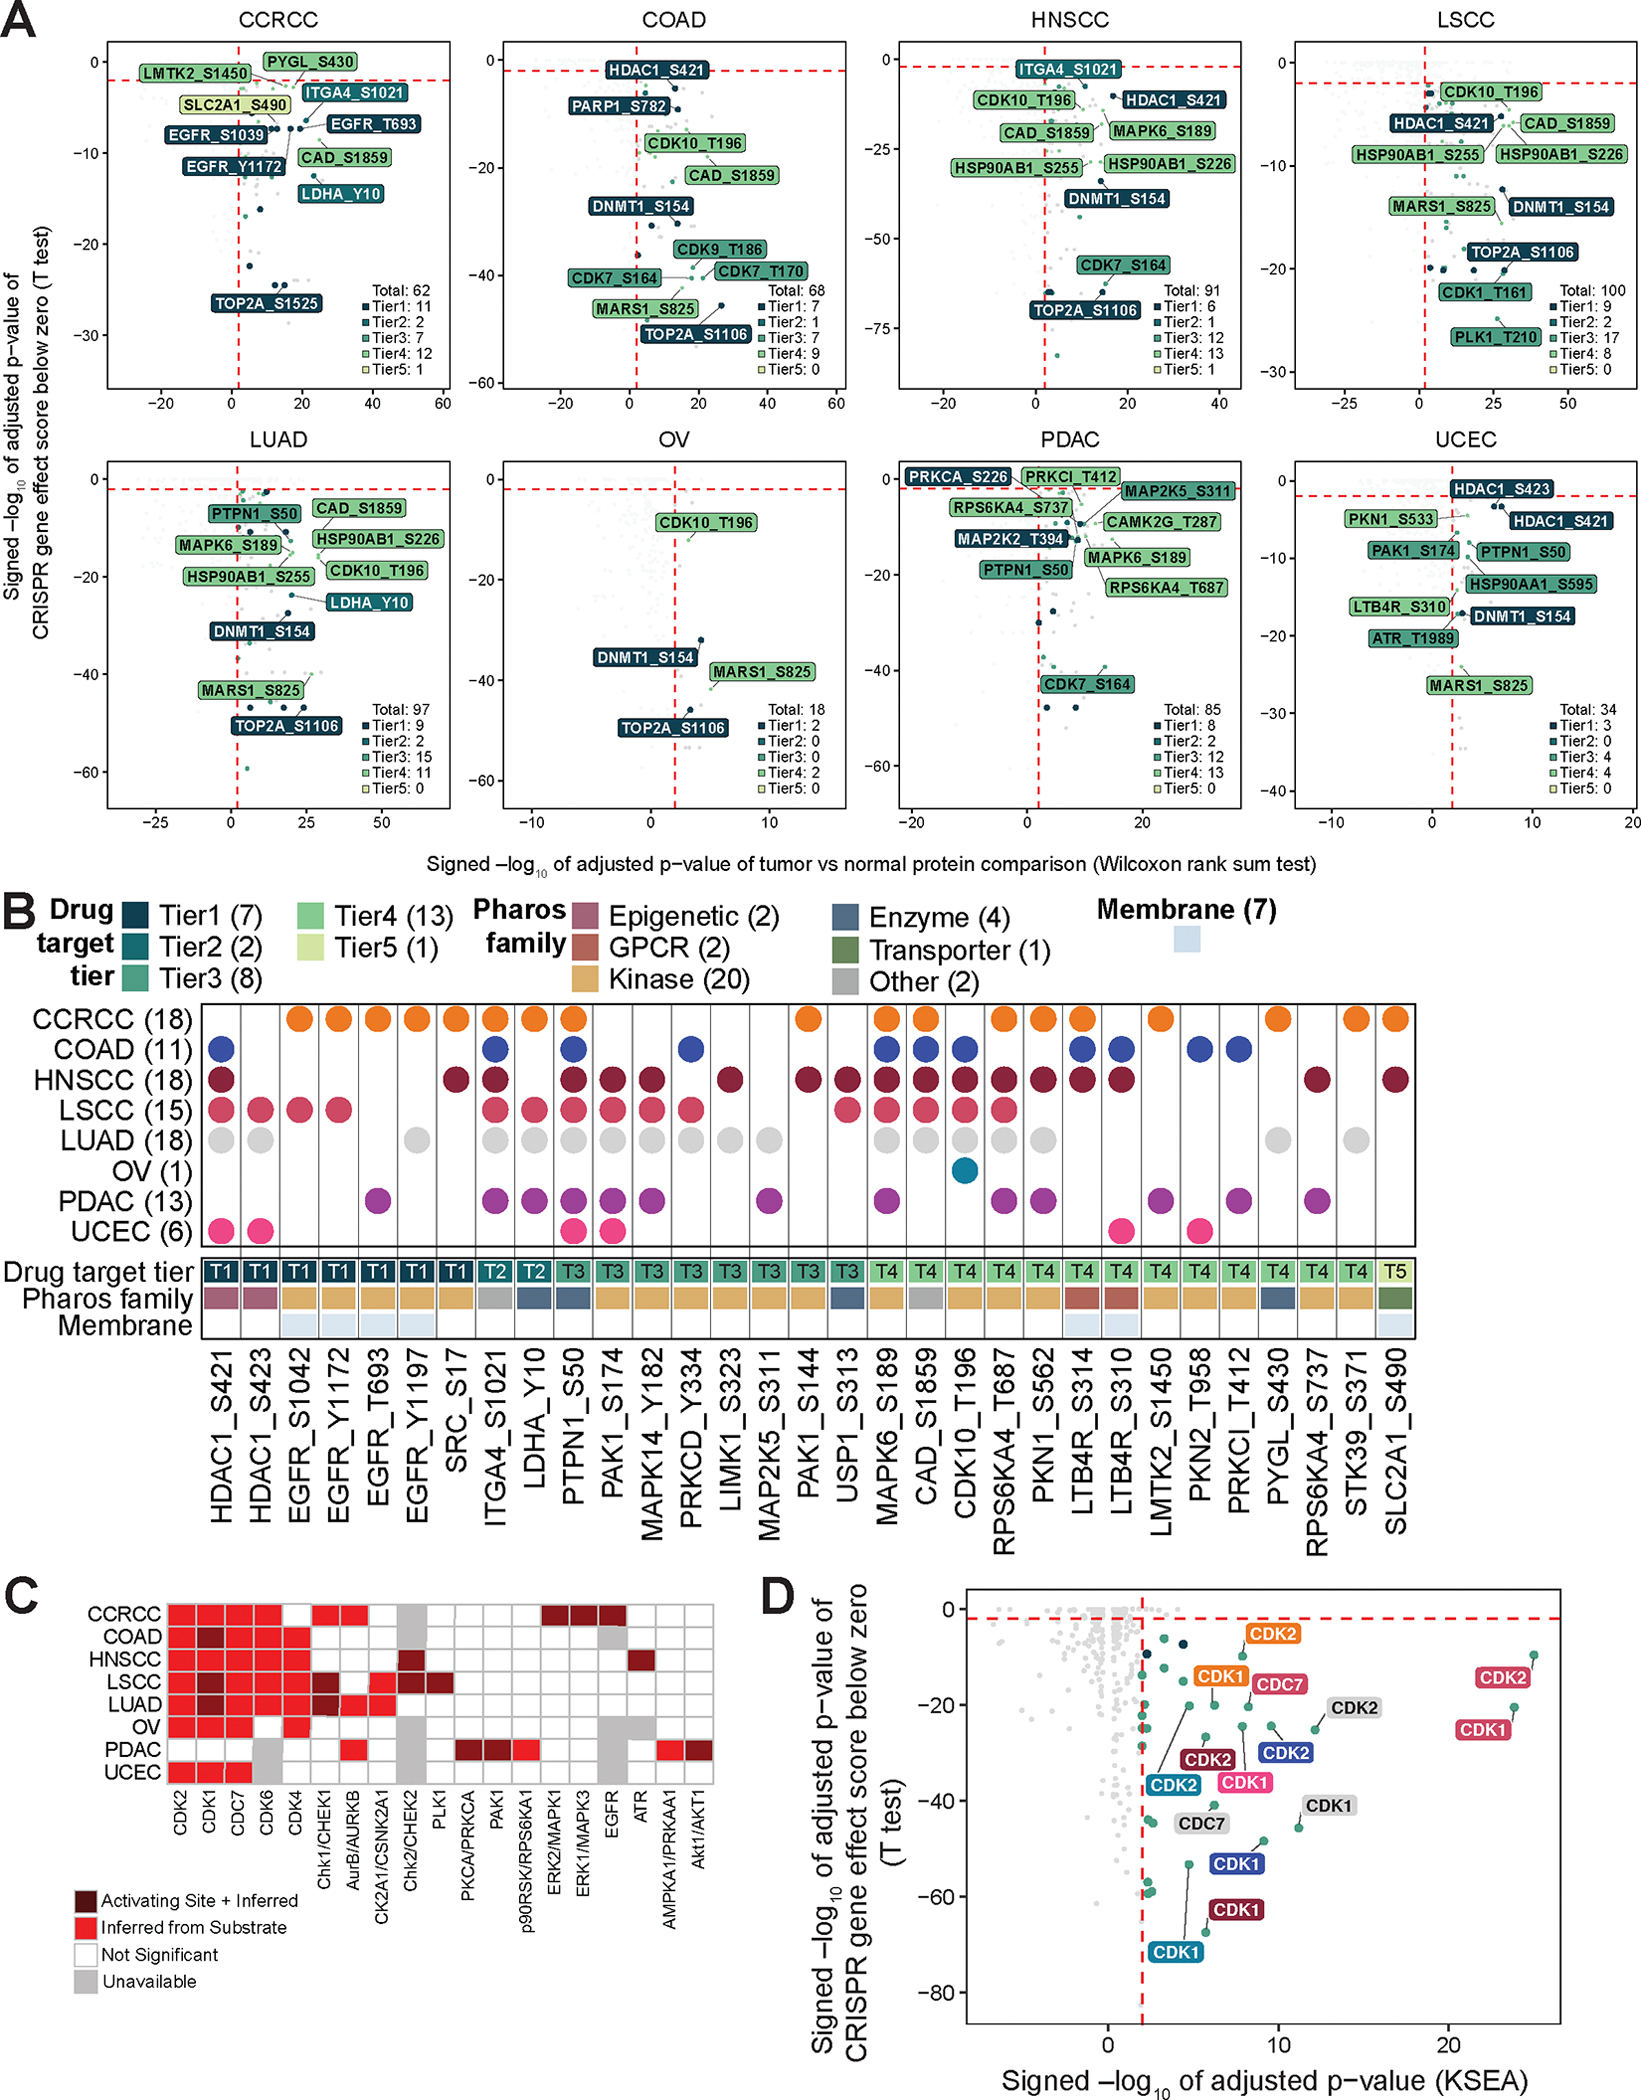
Fewer than 200 proteins are targeted by cancer drugs approved by the Food and Drug Administration (FDA). We integrate Clinical Proteomic Tumor Analysis Consortium (CPTAC) proteogenomics data from 1,043 patients across 10 cancer types with additional public datasets to identify potential therapeutic targets. Pan-cancer analysis of 2,863 druggable proteins reveals a wide abundance range and identifies biological factors that affect mRNA-protein correlation. Integration of proteomic data from tumors and genetic screen data from cell lines identifies protein overexpression- or hyperactivation-driven druggable dependencies, enabling accurate predictions of effective drug targets. Proteogenomic identification of synthetic lethality provides a strategy to target tumor suppressor gene loss. Combining proteogenomic analysis and MHC binding prediction prioritizes mutant KRAS peptides as promising public neoantigens. Computational identification of shared tumor-associated antigens followed by experimental confirmation nominates peptides as immunotherapy targets. These analyses, summarized at https://targets.linkedomics.org, form a comprehensive landscape of protein and peptide targets for companion diagnostics, drug repurposing, and therapy development.

Keywords: pan-cancer, proteogenomics, drug targets, proteomics, synthetic lethality, neoantigens, tumor antigens, data integration.


Conflict of interest statement

Declaration of interests V.H. owns stock of Marker Therapeutics and Allovir. B.Z. received a consulting fee from AstraZeneca.

Figures

Figure 1:
Figure 1:. Overview of the cohorts and proteomic landscape of therapeutic targets, see also Figure S1, Table S1, and Table S2.
A) Number of tumor and normal tissue samples for 10 cancer cohorts and number of total identified features for each omics type. B) Number of genes present in each of five target tiers. Overlapped genes were assigned to the top-most tier. C) Percentage of genes in each tier belonging to each functional family. D) Number of genes identified in each omics type in at least one cohort. E) Heatmap of median log2 MS1 intensity (protein abundance) for targets in each cohort. F) Rank of all proteins by median of the median abundance in each cohort, with the same color scale as E. The drug targets with the highest and lowest median abundances are labeled, as are the targets of the highest number of drugs approved for cancer. G) Scatter plot comparing median log2 RNA expression and median log2 protein abundance across all samples for druggable proteins quantified in at least 3 cohorts. Spearman’s correlation coefficients for all genes or those with either a median log2 RSEM above or below 6 are included. H) Heatmap of Spearman’s correlation coefficients between mRNA and protein abundance for the genes not correlated in any cohort. I) Spearman’s correlations between CDK9 protein abundance and CDK9 mRNA abundance or between CDK9 protein abundance and CCNT1 protein abundance in the LSCC cohort. J) GSEA enrichment of the mRNA processing gene set based on global protein co-expression with CDK9 protein (top) or global mRNA co-expression with CDK9 mRNA (bottom).
Figure 2:
Figure 2:. Prioritization of targetable tumor-overexpressed proteins based on genetic screen and genomic aberration, see also Figure S2 and Table S3.
A) Potentially druggable targets for each cancer type defined by protein upregulation in tumor tissue and CRISPR effect score below zero in cell lines. The top 10 druggable targets by significance in the tumor vs normal comparison were labeled. The number on the bottom right is the total number of candidates and druggable targets from each tier, respectively. B) Potentially druggable, non pan-essential, targets shared by at least five cancer types. C) Difference in cognate mRNA and protein abundance of a gene in the mutated samples vs WT samples in each cohort assessed by Student’s t-test. D) Association (Spearman’s correlation) of cognate mRNA and protein abundance with methylation level of genes hypomethylated in tumors. Triangles indicate overexpression of the protein in tumor samples compared to normal. E) Positive Spearman’s correlation between CNV, RNA, and protein abundance for genes in focal amplification regions. Triangles indicate overexpression of the protein in tumor samples compared to normal.
Figure 3:
Figure 3:. Prioritization of targetable tumor-hyperactivated proteins based on genetic screen data, see also Figure S3 and Table S4.
A) Targetable protein hyperactivation events for each cancer type defined by increased activating phosphosite abundance in tumor tissue and CRISPR gene effect score below zero of the corresponding protein. Top 10 hyperactivation events by significance in the tumor vs normal comparison were labeled. The number on the bottom right is the total number of candidates and druggable hyperactivation events from each tier, respectively. B) Targetable protein hyperactivation events on non pan-essential host targets shared by at least two cancer types. C) Kinase activity inference with annotation of increased activating site phosphorylation. D) Kinases with significantly increased inferred activity in tumors and a significant dependency score in genetic screen.
Figure 4.
Figure 4.. Evaluation and validation of prioritized drug targets, see also Figure S4 and Table S5.
A) Boxplots depicting proportions of predicted effective targets among all targetable genes by drug target tiers. P-values derived from Wilcoxon signed rank test. B) Workflow describing the systematic evaluation of prioritized targets with PRISM primary screen drug response dataset. C) Success rates for prioritizing effective drug targets by cancer type using CRISPR data alone, tumor versus normal data alone, and a combination of both approaches. P-values derived from z-test. D) Sensitivities, specificities, and accuracies for the three approaches. E-G) Violin plots comparing target protein abundance in tumor vs normal (top panels, p-values derived from Wilcoxon rank sum test), and target dependency scores in cell lines (bottom panels, p-values derived from one-sample t-test) for Tier 4 targets CAD (E), PAK2 (F), and ITGB5 (G). H-J) Plots depicting cell growth (left panels) and cell line xenograft tumor volumes (right panels, N = 4–6 mice per group) from control and Tier 4 target knockdown cell lines for shCAD (H), shPAK2 (I), and shITGB5 (J). Data are mean ± SEM. P-values derived from T test. *p<0.05, **p<0.01, ***p<0.001, ****p<0.0001.
Figure 5.
Figure 5.. Identification of synthetic lethal partners of genomically altered tumor suppressor genes as putative targets, see also Figure S5 and Table S6.
A) Heatmap showing top frequently genomically altered tumor suppressor genes in CPTAC and TCGA cohorts. B) cis impact of tumor suppressor genes from (A) on cognate mRNA and protein levels. C) For each cancer type, each point represents the significance of a protein, phosphosite, or kinase activity being up-regulated in tumors harboring loss-of-function genetic alterations vs others (x-axis, higher value indicates more significant up-regulation) and also the significance of knockout of the corresponding gene in causing proliferation loss in cell lines of matched lineages harboring tumor suppressor loss vs others (y-axis, lower value indicates more significant loss in proliferation). D) TOP2A protein was significantly higher in UCEC tumors with TP53 loss, and UCEC cell lines harboring TP53 loss had significantly higher dependency to TOP2A. E) UCEC cell lines with TP53 loss were more sensitive to topoisomerase inhibitors doxorubicin and mitoxantrone compared with lines without TP53 loss. F) Abundance of ANAPC1 p-S334 was significantly higher in OV tumors with TP53 loss, and OV cell lines harboring TP53 loss had significantly higher dependency to ANAPC1. G) Inferred CHK1 activity was significantly higher in BRCA tumors with TP53 loss, and BRCA cell lines harboring TP53 loss had significantly higher dependency to CHK1. H) Summary of TP53 loss associated dependencies in three cancer types.
Figure 6.
Figure 6.. Prediction of somatic mutation-derived neoantigens using proteogenomics data, see also Table S7.
A) Overview of the proteogenomics workflow for neoantigen prioritization. B) Numbers of somatic mutation-derived variant peptides identified for each cancer type. C) Protein abundance (log2 MS1 intensity) for genes with mutations detected vs not detected in the proteomics data. D) The percent of samples with proteomics-supported putative neoantigens. E) Mutations predicted to yield neoantigens in at least two tumors. F) KRAS mutant peptides and corresponding HLA type predicted to yield neoepitopes in patients.
Figure 7.
Figure 7.. Tumor associated antigen identification and experimental validation, see also Table S8.
A) Tumor associated antigen identification pipeline. B) MAGEA10 RNA (top) and protein (bottom) expression in two cancer cohorts. C) Number of significantly differentially expressed proteins identified by AD test and Wilcoxon rank sum test across all cohorts. D) Distribution of seven prioritized tumor associated antigens across six cancer types. Dots and boxes indicate identifications shared by both tests or unique to the AD test. E) Experimental validation for binding affinity and immunogenicity for 67 peptides with the highest binding affinities to the most common allotype HLA-A*02 for the seven prioritized proteins in (D). Bar plot depicts the exchange efficiency of HLA-A*02:01 tetramer quantified by Q1 replacement percentage (R.P.). Red line indicates 50% replacement as the threshold for identifying a peptide with strong binding affinity. Heatmap depicts spot forming units (SFUs) per 100,000 cells from ELISpot experiments. Red bold text highlights 22 peptides showing both strong exchange efficiency (> 50%) and strong immunogenicity (SFU > 150), which are promising candidates for further investigation as broadly applicable immunotherapy targets. F) Representative flow cytometry plots for binding affinity (Q1 quadrant indicates replacement percentage) and ELISpot images for four selected peptides in two individuals.

Comment in

References

    1. Hutter C, and Zenklusen JC (2018). The Cancer Genome Atlas: Creating Lasting Value beyond Its Data. Preprint, 10.1016/j.cell.2018.03.042 10.1016/j.cell.2018.03.042. - DOI - PubMed
    1. Bashraheel SS, Domling A, and Goda SK (2020). Update on targeted cancer therapies, single or in combination, and their fine tuning for precision medicine. Biomed. Pharmacother. 125, 110009. - PubMed
    1. Mani DR, Krug K, Zhang B, Satpathy S, Clauser KR, Ding L, Ellis M, Gillette MA, and Carr SA (2022). Cancer proteogenomics: current impact and future prospects. Nat. Rev. Cancer 22, 298–313. - PubMed
    1. Zhang B, Whiteaker JR, Hoofnagle AN, Baird GS, Rodland KD, and Paulovich AG (2019). Clinical potential of mass spectrometry-based proteogenomics. Nat. Rev. Clin. Oncol. 16, 256–268. - PMC - PubMed
    1. Li Y, Dou Y, Da Veiga Leprevost F, Geffen Y, Calinawan AP, Aguet F, Akiyama Y, Anand S, Birger C, Cao S, et al. (2023). Proteogenomic data and resources for pan-cancer analysis. Cancer Cell 41, 1397–1406. - PMC - PubMed