. 2024 Aug 1;31(8):1127-1144.e17.
doi: 10.1016/j.stem.2024.05.010. Epub 2024 Jun 24.

Selective advantage of mutant stem cells in human clonal hematopoiesis is associated with attenuated response to inflammation and aging

Affiliations

Selective advantage of mutant stem cells in human clonal hematopoiesis is associated with attenuated response to inflammation and aging

Niels Asger Jakobsen et al. Cell Stem Cell. .

Abstract

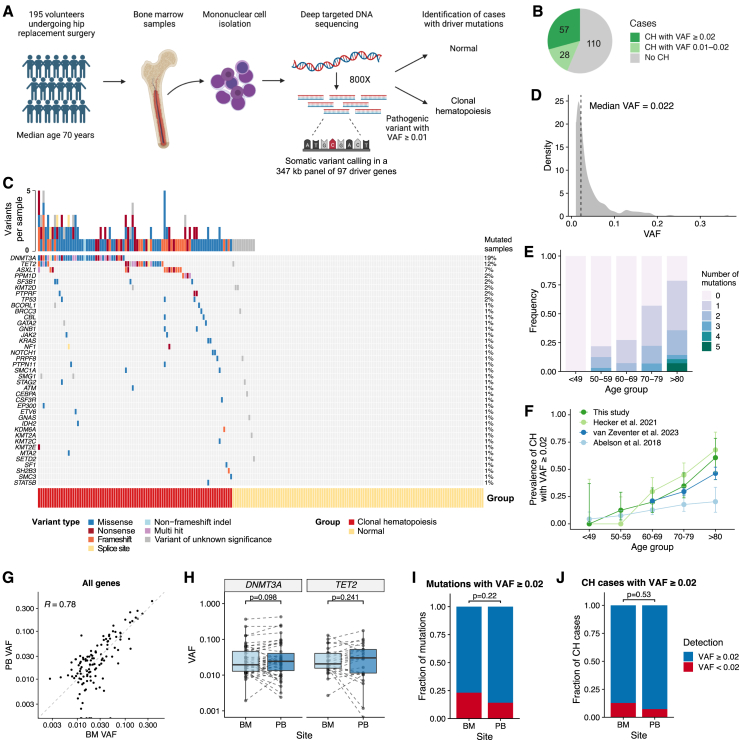
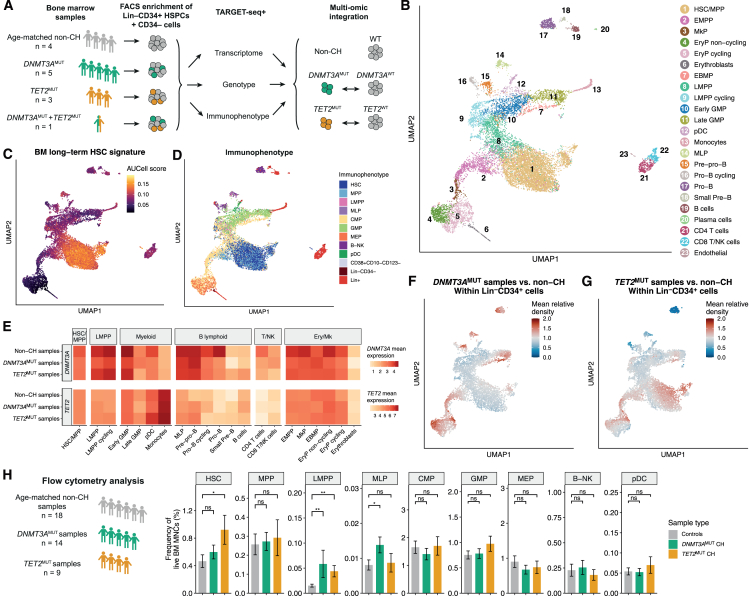
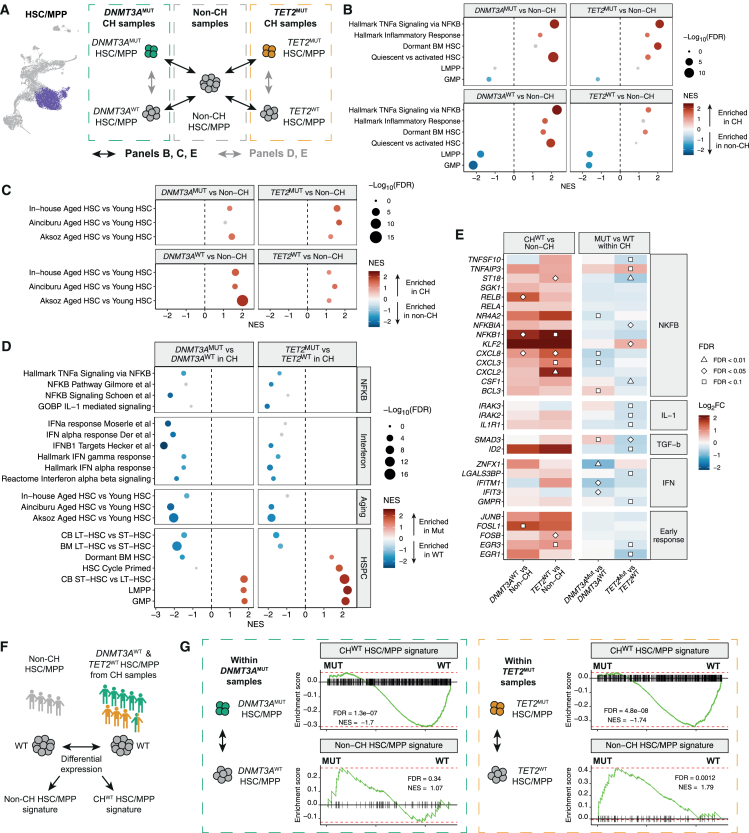
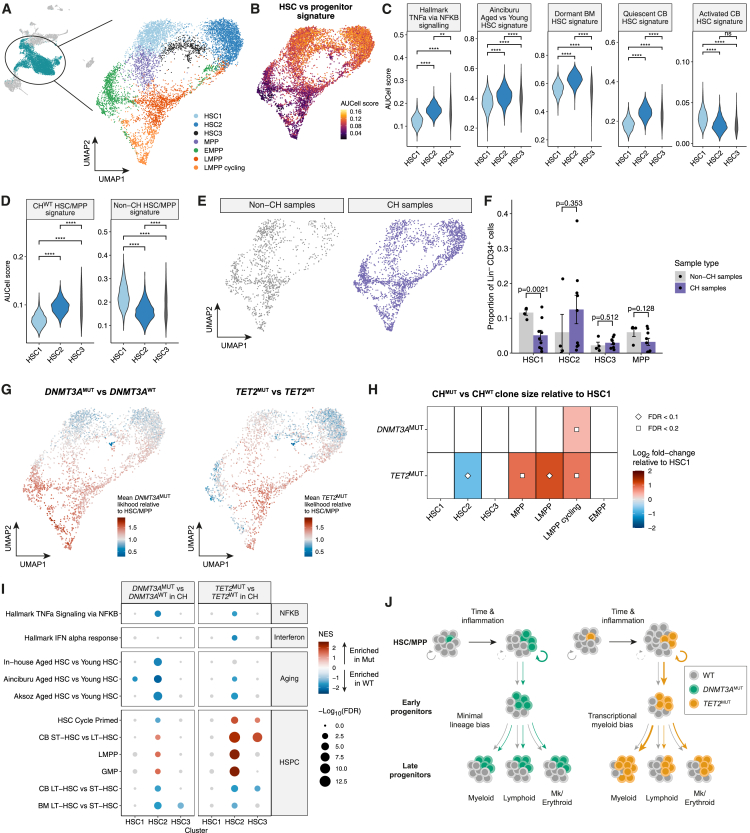
Clonal hematopoiesis (CH) arises when hematopoietic stem cells (HSCs) acquire mutations, most frequently in the DNMT3A and TET2 genes, conferring a competitive advantage through mechanisms that remain unclear. To gain insight into how CH mutations enable gradual clonal expansion, we used single-cell multi-omics with high-fidelity genotyping on human CH bone marrow (BM) samples. Most of the selective advantage of mutant cells occurs within HSCs. DNMT3A- and TET2-mutant clones expand further in early progenitors, while TET2 mutations accelerate myeloid maturation in a dose-dependent manner. Unexpectedly, both mutant and non-mutant HSCs from CH samples are enriched for inflammatory and aging transcriptomic signatures, compared with HSCs from non-CH samples, revealing a non-cell-autonomous effect. However, DNMT3A- and TET2-mutant HSCs have an attenuated inflammatory response relative to wild-type HSCs within the same sample. Our data support a model whereby CH clones are gradually selected because they are resistant to the deleterious impact of inflammation and aging.

Keywords: DNMT3A; TET2; aging; clonal competition; clonal hematopoiesis; hematopoietic stem cells; single-cell RNA-seq; single-cell genomics; somatic mosaicism.


Conflict of interest statement

Declaration of interests J.E.D. receives royalties from Trillium Therapeutics Inc./Pfizer and a commercial research grant from Celgene/BMS.

Figures

None
Graphical abstract
Figure 1
Figure 1
Identification of age-related clonal hematopoiesis in individuals undergoing hip replacement surgery (A) Experimental design for identifying individuals with clonal hematopoiesis (CH). (B) Fraction of samples in the cohort with driver mutation(s) at 0.01–0.02 or ≥0.02 VAF. (C) Landscape of somatic variants observed in the cohort. Each row represents a gene, and each column represents a study participant. Top bar plot indicates the number of mutations per sample. Variants are classified as pathogenic or variants of unknown significance (VUSs) (STAR Methods). Samples with ≥1 pathogenic driver mutation were categorized as having CH. (D) Distribution of VAFs in all mutations observed across the cohort. (E) Frequency of mutations detected per individual by age group. (F) Prevalence of CH with driver mutation(s) ≥0.02 VAF by age. BM sequencing data from this study are compared with another hip replacement cohort (Hecker et al.; n = 109 BM and n = 91 PB samples; green colors) and with two studies of the general population, (blue colors). Error bars represent 95% confidence intervals (CIs). (G) Comparison of VAFs for 128 mutations in paired BM and PB samples. Mutations detected with VAF ≥0.01 in either sample type were included. The dashed line shows the line of equality where BM VAF is equal to PB VAF. R indicates the Pearson correlation coefficient. (H) Pairwise comparison of VAFs for mutations in DNMT3A (n = 35) and TET2 (n = 19). Significance calculated by Wilcoxon signed-rank test. (I and J) Proportion of mutations (I) or CH cases (J) detected with ≥0.02 VAF in BM or PB DNA (n = 83 cases with paired BM and PB data). Significance calculated by Fisher’s test.
Figure 2
Figure 2
Hematopoietic differentiation trajectory in DNMT3A and TET2-mutant clonal hematopoiesis (A) Experimental design for TARGET-seq+ analysis of BM samples from donors with CH and age-matched samples without CH. See Figure S1. (B) Uniform manifold approximation and projection (UMAP) of integrated single-cell transcriptome data (n = 13,247 cells from 13 donors) colored by cluster annotation. See Figure S2. (C) UMAP with AUCell enrichment scores for the BM long-term HSC signature. (D) UMAP colored by cell immunophenotype determined from flow cytometry indexing. (E) Heatmap of mean log2(normalized counts) for DNMT3A and TET2 in control, DNMT3A-, and TET2-mutant samples across hematopoietic cell types. (F and G) UMAPs colored by the mean density of LinCD34+ cells in DNMT3A-mutant (F) and TET2-mutant (G) CH samples relative to non-CH samples. Relative density >1 indicates that the probability of observing a given cell is greater in CH samples than in non-CH samples. (H) Flow cytometry analysis on BM samples from non-CH samples and CH samples with either DNMT3A or TET2 mutations present in the largest clone. Data are represented as mean ± SEM. p values calculated by Wilcoxon rank-sum test with Holm-Bonferroni multiple testing correction. p < 0.05, ∗∗p < 0.01. GMP, granulocyte-monocyte progenitor; pDC, plasmacytoid dendritic cell progenitor; MkP, megakaryocytic progenitor; EryP, erythroid progenitor; EBMP, eosinophil/basophil/mast cell progenitor; MLP, multi-lymphoid progenitor; B-NK, B/NK cell progenitor.
Figure 3
Figure 3
Distinct patterns of clonal expansion of DNMT3A- and TET2-mutant clones (A) Strategy for quantifying CHMUT clonal expansion across hematopoietic differentiation. For each sample, MELD and scCODA were used to estimate the density of cells from each clone across the transcriptomic landscape (see Figures S3 and S4 and STAR Methods). A mutant relative likelihood >1 indicates that the probability of a cell being mutant is greater than in the HSC/MPP, whereas a relative likelihood <1 indicates that the probability is lower than in the HSC/MPP. (B) UMAP of cells from DNMT3AMUT CH samples (n = 5 samples) colored by genotype. (C) UMAP of cells from DNMT3AMUT CH samples colored by the mean likelihood of cells being DNMT3AMUT relative to the average within HSC/MPP. The mean value across 5 samples is shown. (D) Mean DNMT3AMUT clone likelihood in each cluster relative to the HSC/MPP, computed using MELD. Each dot represents a DNMT3AMUT CH sample. Boxplots display the median and interquartile range. Symbols above indicate whether a significant difference in clone size relative to the HSC/MPP was detected using scCODA. (E) UMAP of cells from TET2MUT CH samples (n = 3 samples) colored by genotype. (F) UMAP of cells from TET2MUT CH samples colored by the mean likelihood of cells being TET2MUT relative to the average within HSC/MPP. The mean value across 3 samples is shown. (G) Same as in (D), but for the TET2MUT clone likelihoods across TET2MUT CH samples. (H) Clonal structure for the NOC002 sample. Cell numbers in each clone are indicated. (I) Clonal composition within each cluster for sample NOC002. Each clone is colored as in (H). The number of cells analyzed in each cluster is shown above. (J) UMAP showing the likelihood of cells being in the double TET2MUT clone (TET2Q726X/R1261C) relative to the average within HSC/MPP in sample NOC002. (K) Immunophenotypic BM compartment sizes comparing sample NOC002 with the median from 18 age-matched control samples. Left-hand bars: compartments as a proportion of total BM MNCs; right-hand bars: HSPC compartments within LinCD34+ cells. (L) Clonal structure for the NOC115 sample. The DNMT3A and TET2 mutations were mutually exclusive in single-cell genotyping. Cell numbers in each clone are indicated. (M) As in (I) but for sample NOC115. Each clone is colored as in (L). (N) UMAPs showing the likelihood of cells being in the DNMT3AMUT (left) and TET2MUT (right) clones relative to the average within HSC/MPP in sample NOC115.
Figure 4
Figure 4
TET2-mutant clones lead to dysregulated myeloid differentiation (A) UMAP showing the myeloid differentiation trajectory with cells colored by pseudotime score. (B) Top: density plot showing the distribution of TET2WT and TET2MUT cells through pseudotime in the myeloid lineage. Cells sorted from the total LinCD34+ fluorescence-activated cell sorting (FACS) gate were downsampled to an equal number of cells per sample (n = 178 cells from each of the 4 samples). Bottom: density of cells in each cluster along pseudotime. (C) GSEA against hematopoietic signatures comparing TET2MUT versus TET2WT cells (n = 4 TET2MUT CH samples) within myeloid lineage clusters. Differential expression analysis was performed accounting for sample and batch effects. Signatures with FDR > 0.05 are colored gray. Positive normalized enrichment scores (NESs) indicate enrichment in mutant cells. LT-HSC, long-term HSC; ST-HSC, short-term HSC. (D) Local regression of AUCell expression scores for HSC and myeloid gene signatures along myeloid pseudotime, comparing TET2WT and TET2MUT cells. Shading indicates the 95% CI. (E) Volcano plot showing differentially expressed regulons between TET2MUT and TET2WT cells within the LMPP cycling and early GMP clusters in TET2MUT CH samples. FDR-corrected p values calculated by linear mixed model test accounting for sample effects. x axis shows the mean of the change in regulon activity (area under the receiver operator curve) calculated within each sample. (F) UMAPs showing activity of the indicated regulons across the hematopoietic landscape within non-CH samples. (G) Local regression of regulon activity through myeloid pseudotime, comparing TET2MUT and TET2WT cells. Shading indicates the 95% CI. (H) Fitted gene expression values along myeloid pseudotime for the transcription factors shown in (F) and (G) in TET2MUT and TET2WT cells. Shading indicates the 95% CI. (I) Enrichment of TF motifs within differentially methylated enhancer regions (DMRs) that are hypermethylated in monocytes from TET2-mutant CCUS patients, plotted against the mean change in regulon activity between TET2MUT and TET2WT cells within the LMPP cycling and early GMP clusters from (E). See also Figure S5.
Figure 5
Figure 5
Non-cell-autonomous activation of inflammatory transcriptional programs in clonal hematopoiesis is attenuated in mutant HSCs (A) Strategy for differential gene expression analysis between HSC/MPPs from CH samples and HSC/MPPs from age-matched non-CH samples (black arrows; B, C, and E), and between CHMUT and CHWT HSC/MPPs within CH samples (gray arrows; D and E). (B) GSEA against inflammatory and hematopoietic lineage signatures comparing CHWT or CHMUT HSC/MPPs versus non-CH HSC/MPPs. Differential expression analysis was performed accounting for sample, age, and batch effects. Left: 5 DNMT3AMUT samples (n = 1,139 DNMT3AWT cells, n = 409 DNMT3AMUT cells) versus 4 non-CH samples (n = 1,279 cells). Right: 3 TET2MUT samples (n = 1,239 TET2WT cells, n = 222 TET2MUT cells) versus 4 non-CH samples (n = 1,279 cells). The double-mutant NOC115 sample was excluded. Signatures with FDR > 0.2 are colored gray. Positive NES values indicate enrichment in CH samples. (C) As in (B) but showing GSEA against aged HSC signatures derived from the in-house dataset and from two additional studies comparing aged and young human HSCs., (D) GSEA against NF-κB, interferon, and hematopoietic signatures comparing DNMT3AMUT versus DNMT3AWT HSC/MPPs (left) and TET2MUT versus TET2WT HSC/MPPs (right) within CH samples. Signatures with FDR > 0.2 are colored gray. Positive NES values indicate enrichment in mutant cells. CB, cord blood. (E) Heatmap showing log2 fold change in expression of genes related to inflammatory pathways within HSC/MPP. Left: comparison of CHWT versus non-CH cells. Right: comparison of CHMUT versus CHWT cells within CH samples. Symbols represent FDR-corrected p values from differential expression testing. (F) Strategy for deriving CHWT and non-CH HSC/MPP signatures. Differential expression analysis was performed between HSC/MPPs from the 4 non-CH samples (n = 1,279 cells) and CHWT cells from the 9 CH samples (n = 2,622 cells), accounting for sample, age, and batch effects. (G) GSEA enrichment plots for the CHWT HSC/MPP signature (top) and non-CH HSC/MPP signature (bottom), comparing CHWT and CHMUT cells within CH samples. Positive enrichment scores indicate enrichment in mutant cells. See also Figure S6.
Figure 6
Figure 6
The effects of DNMT3A and TET2 mutations are most prominent in a transcriptionally distinct subset of HSCs (A) UMAP of 8,059 cells from the HSC/MPP, EMPP, LMPP, and LMPP cycling clusters after feature weight derivation with the SAM algorithm, colored by cluster annotation. (B) UMAP superimposed with AUCell scores for a signature of genes differentially expressed between HSCs and progenitors. (C) AUCell scores for TNF-α via NF-κB, HSC aging, dormant BM HSC, and quiescent versus activated CB HSC signatures, comparing the HSC clusters. p values calculated by unpaired t test. The area of each violin is proportional to cell number. (D) AUCell scores for the CHWT and non-CH HSC/MPP signatures, comparing the HSC clusters. p values calculated by unpaired t test. (E) UMAP embeddings showing cells from non-CH and CH samples. (F) Quantification of the size of each HSC/MPP cluster as a proportion of LinCD34+ cells, comparing CH and non-CH samples. Only cells sorted from the total LinCD34+ FACS gate were included. Data are represented as mean ± SEM. Each dot represents a sample. p values calculated by unpaired t test. (G) UMAPs of cells from DNMT3AMUT CH samples (left) and TET2MUT CH samples (right) colored by the mean likelihood of cells being in the mutant clone relative the average in the HSC/MPP. The mean relative likelihood across all samples analyzed is shown (n = 6 DNMT3AMUT samples; n = 4 TET2MUT samples). A relative likelihood ≥1 indicates that the probability of a cell being mutant is greater than the average for the HSC/MPP. (H) Heatmap of Log2FC in abundance of mutant clones relative to the HSC1 cluster (from scCODA). Only significant results at FDR < 0.2 are shown; nonsignificant differences plotted as white. (I) GSEA against NF-κB, interferon, aging, and hematopoietic signatures comparing DNMT3AMUT versus DNMT3AWT HSC/MPPs (left) and TET2MUT versus TET2WT HSC/MPPs (right) within CH samples. Signatures with FDR > 0.05 are colored gray. Positive NES values indicate enrichment in mutant cells. (J) Model of DNMT3AMUT and TET2MUT clonal expansion. Inflammation impairs the function of CHWT HSCs, but mutant HSCs are less affected, leading to clonal expansion over time (circular arrows). Downstream of the HSC, both DNMT3AMUT and TET2MUT clones expand moderately in early progenitors (linear arrows). In later differentiation, DNMT3AMUT clone size is largely maintained, but TET2MUT clones expand further and have a myeloid bias. p < 0.05, ∗∗p < 0.01, ∗∗∗p < 0.001, ∗∗∗∗p < 0.0001. See also Figure S6.

References

    1. Welch J.S., Ley T.J., Link D.C., Miller C.A., Larson D.E., Koboldt D.C., Wartman L.D., Lamprecht T.L., Liu F., Xia J., et al. The origin and evolution of mutations in acute myeloid leukemia. Cell. 2012;150:264–278. doi: 10.1016/j.cell.2012.06.023. - DOI - PMC - PubMed
    1. Weissman I.L. Stem cells are units of natural selection for tissue formation, for germline development, and in cancer development. Proc. Natl. Acad. Sci. USA. 2015;112:8922–8928. doi: 10.1073/pnas.1505464112. - DOI - PMC - PubMed
    1. Ziegler A., Jonason A.S., Leffell D.J., Simon J.A., Sharma H.W., Kimmelman J., Remington L., Jacks T., Brash D.E. Sunburn and p53 in the onset of skin cancer. Nature. 1994;372:773–776. doi: 10.1038/372773a0. - DOI - PubMed
    1. Martincorena I., Roshan A., Gerstung M., Ellis P., Van Loo P., McLaren S., Wedge D.C., Fullam A., Alexandrov L.B., Tubio J.M., et al. Tumor evolution. High burden and pervasive positive selection of somatic mutations in normal human skin. Science. 2015;348:880–886. doi: 10.1126/science.aaa6806. - DOI - PMC - PubMed
    1. Blokzijl F., de Ligt J., Jager M., Sasselli V., Roerink S., Sasaki N., Huch M., Boymans S., Kuijk E., Prins P., et al. Tissue-specific mutation accumulation in human adult stem cells during life. Nature. 2016;538:260–264. doi: 10.1038/nature19768. - DOI - PMC - PubMed

MeSH terms