Case Reports
. 2024 Jun 25;15(1):5359.
doi: 10.1038/s41467-024-49746-4.

SDS22 coordinates the assembly of holoenzymes from nascent protein phosphatase-1

Affiliations
Case Reports

SDS22 coordinates the assembly of holoenzymes from nascent protein phosphatase-1

Xinyu Cao et al. Nat Commun. .

Abstract

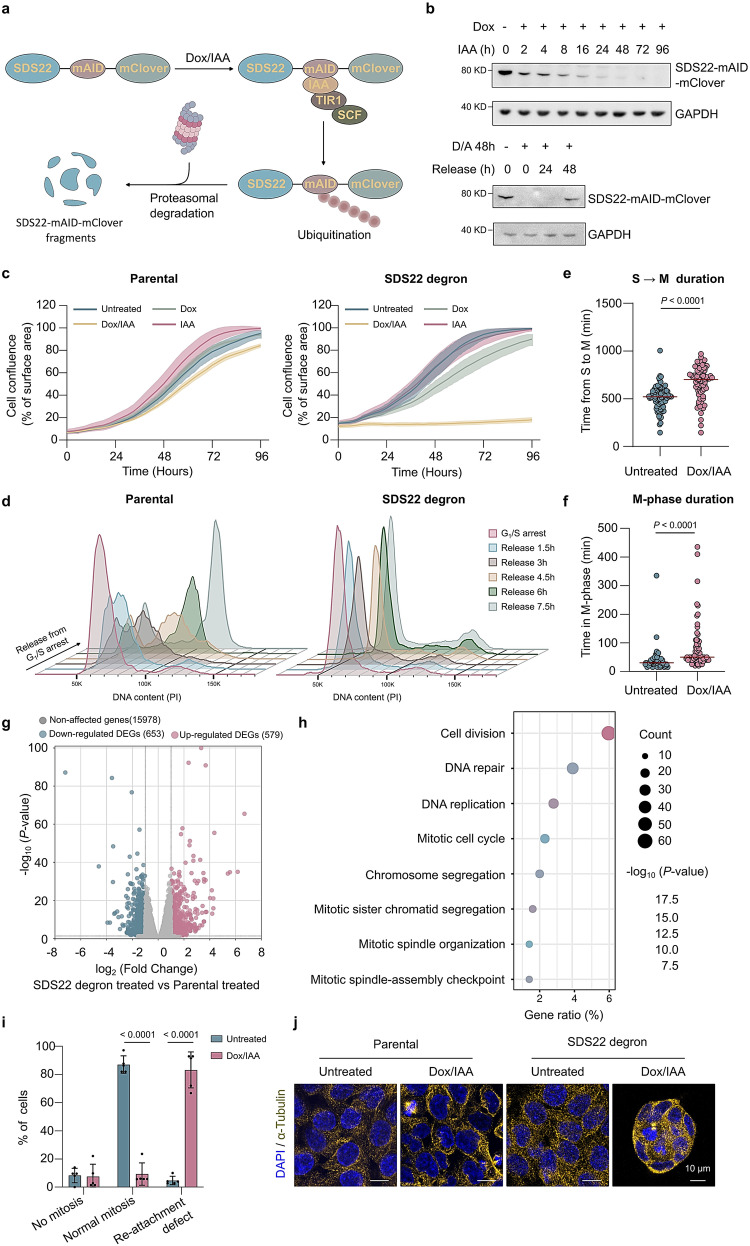
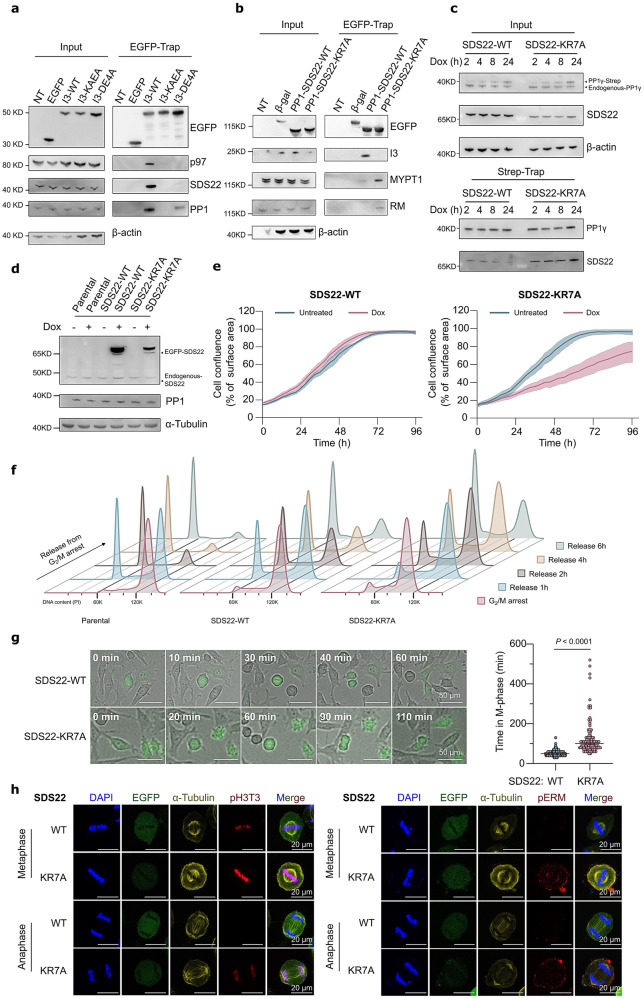
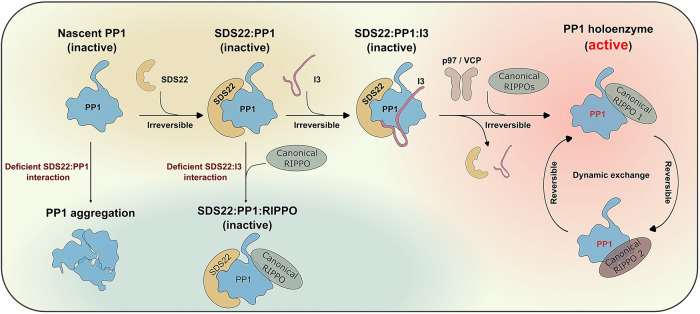
SDS22 forms an inactive complex with nascent protein phosphatase PP1 and Inhibitor-3. SDS22:PP1:Inhibitor-3 is a substrate for the ATPase p97/VCP, which liberates PP1 for binding to canonical regulatory subunits. The exact role of SDS22 in PP1-holoenzyme assembly remains elusive. Here, we show that SDS22 stabilizes nascent PP1. In the absence of SDS22, PP1 is gradually lost, resulting in substrate hyperphosphorylation and a proliferation arrest. Similarly, we identify a female individual with a severe neurodevelopmental disorder bearing an unstable SDS22 mutant, associated with decreased PP1 levels. We furthermore find that SDS22 directly binds to Inhibitor-3 and that this is essential for the stable assembly of SDS22:PP1: Inhibitor-3, the recruitment of p97/VCP, and the extraction of SDS22 during holoenzyme assembly. SDS22 with a disabled Inhibitor-3 binding site co-transfers with PP1 to canonical regulatory subunits, thereby forming non-functional holoenzymes. Our data show that SDS22, through simultaneous interaction with PP1 and Inhibitor-3, integrates the major steps of PP1 holoenzyme assembly.


Conflict of interest statement

The authors declare no competing interests

Figures

Fig. 1
Fig. 1. The degradation of SDS22 leads to a proliferation arrest.
a Scheme of Dox/IAA-induced degradation of SDS22-mAID-mClover. b Time course and reversibility of SDS22-mAID-mClover degradation. Dox was added 18 h before IAA (upper panel). SDS22-mAID-mClover re-accumulation after Dox/IAA washout (bottom panel). c The effect of SDS22 depletion on cell proliferation (IncuCyte). The cells were untreated or pretreated with Dox and/or IAA for 6 h, before the start of scanning. The solid lines are means of three technical replicates and the shaded areas show the SD range from a single data set, representative for three experiments. d The effect of SDS22 degradation on cell-cycle progression. Dox/IAA-treated cells were arrested in G1/S, released from thymidine, and analyzed by flow cytometry after propidium iodide (PI) staining. e Quantification of S → M duration in SDS22-degron cells, (non-)treated with Dox/IAA for 8 h, by time-lapse imaging of individual cells. S → M duration was defined as the time between release from a single-thymidine arrest and cell rounding. Cells were imaged at 10-min intervals. The P value is from two-sided unpaired t-test (n = 78 cells for each conditions). f Cells treated as in (e), but scored by time-lapse imaging for the duration of M-phase (time from cell rounding to either cell flattening or formation of loosely attached cell clumps). The P value is from two-sided unpaired t-test (n = 73 cells for each conditions). g Volcano plot of RNA-sequencing data (n = 3) showing differentially expressed genes (DEGs) in Dox/IAA-treated (48 h) SDS22-degron versus parental cell lines. The P values of the likelihood ratio test were calculated by edgeR. The cut-off for the DEGs was set at P value < 0.05 and logFC > 1. h Dot plot of the gene-ontology (GO) pathway enrichment analysis for the DEGs i Mitotic phenotypes in SDS22-depleted degron cells, as quantified by live time-lapse imaging. Details as in (d). The data are expressed as means ± SD (n = 5 independent experiments; >50 cells analyzed in each condition). P values were from two-sided unpaired t-test. j Morphological changes in parental and SDS22-degron cells, treated or not with Dox/IAA. Cells were fixed and stained for DAPI (blue) and α-tubulin (yellow). Scale bars, 10 μm.
Fig. 2
Fig. 2. Misregulation of PP1 in SDS22-depleted cells.
a Time-lapse imaging (10-min interval) of individual HeLa cells released from a single-thymidine arrest after treatment with siRNAs (siCTR, siMAD2 and/or siMAD2). P values are from two-sided Mann–Whitney U test (n = 15 cells for each condition). b Rescue of prolonged M-phase in SDS22-depleted HeLa cells by expression of EGFP-tagged SDS22-WT or a PP1-binding mutant of SDS22 (1M: E192A; 2M: E192A + E300A; 3M: F170A + E192A + E300A; 4M: F170A + F214A + E192A + E300A). P values are from two-sided Mann–Whitney U test (n = 25 cells/conditions). c Phosphopeptides from SAC components in SDS22-degron cells as compared to that in parental cells, treated with Dox/IAA. d Venn diagram of the affected biological processes (BP) after SDS22 degradation in the phosphoproteomics and RNA-sequencing data sets, as determined by GO-pathway analysis (left panel). The right panel shows the significance (−log10 of the P values) of the 26 overlapping pathways. e Time-dependent degradation of SDS22 and ERM phosphorylation (pERM). IAA was added for the indicated times, in the presence of Dox, to induce the degradation of SDS22 (left). Also shown is the effect of a subsequent Dox/IAA (D/I) washout for 0 → 72 h on the recovery of SDS22 protein and ERM dephosphorylation (right panel). f Immunofluorescence staining of SDS22-degron cells, either untreated or treated with Dox/IAA for 72 h. The fixed cells were stained for DNA (DAPI), phalloidin and pERM. The scale bars are 25 μm. g Cell-based assay of ERM dephosphorylation. Parental and SDS22-degron cells were incubated with Dox/IAA and thymidine. Calyculin A (25 nM, 30 min) served to maximize ERM phosphorylation. Subsequently, the cells were released in medium with 50 nM staurosporine to enable ERM dephosphorylation. h Time course of SDS22 depletion in the degron cell line and its corresponding effect on PP1 protein in cell lysates. The cell lysates were prepared from the combined attached plus floating cells. i Quantification of the data for PP1 shown in (h). The bars represent means ± SD (n = 3 independent experiments). The P value is from two-sided unpaired t-test.
Fig. 3
Fig. 3. Loss of SDS22 and PP1 in a human patient with neurodevelopmental disease.
a Domain structure of SDS22 (upper panel) and mapping of the heterozygous SDS22-W302* mutation in patient P1 (lower panel), predicted to result in the expression of an SDS22 variant that lacks LRR11, LRR12 and the C-terminal LRR-Cap (C-Cap). The blue-colored fragment is missing in SDS22-W302*. b Levels of PP1, SDS22 and α-tubulin in fibroblasts from patient P1 and four healthy controls, as detected by immunoblotting using antibodies that bind to the N-terminus of SDS22 or the C-terminus of all PP1 isoforms (left panel). The right panel shows the quantification of the immunoblotting data. The results are shown as means ± SD (n = 3 independent experiments). The control value in each experiment was the average for four controls and the values for one control were set at 100%. P values are from two-sided unpaired t-test. c Co-immunoprecipitation (EGFP-traps) of endogenous BCLAF1, PP1 and I3 with transiently expressed EGFP, EGFP-SDS22-WT (WT) or EGFP-SDS22-W302* (W302*) in HEK293T cells. d Immunofluorescence staining of HEK293T cells transiently transfected with expression vectors for EGFP-SDS22 or EGFP-SDS22-W302*. The cells were treated with or without 10 μM MG132 for 8 h before fixation. The fixed cells were stained for DNA (DAPI), EGFP and α-tubulin. The scale bars are 20 μm. e The effect of MG132 on the levels of EGFP-SDS22 and EGFP-SDS22-W302*, as measured in 1 h intervals by IncuCyte live-cell analysis for 24 h. HEK293T cells were transiently transfected with EGFP-SDS22-WT or EGFP-SDS22-W302*. 10 μM MG132 was added 1 h before the first measurement. Green fluorescence (Green Calibrated Unit, GCU) was measured to show EGFP intensity. f EGFP-SDS22-W302* accumulates in granules. Detail of cells shown in (d).
Fig. 4
Fig. 4. Mapping of an SDS22:I3 interaction interface.
a Domain structure of SDS22 and I3. Shown are the LRR and C-Cap structures of SDS22, the PP1-binding RVxF- and CCC-motifs of I3 as well as the predicted SDS22-binding region (SBR) of I3. b The rank-1 AlphaFold-Multimer model (out of 25 predicted models) of SDS22:PP1:I3, using the amber-relaxation setup option. Residues with pLDDT scores <30 are not displayed. SDS22 (Hs), blue; PP1α (Hs), gray; I3 (Hs), pink. The PP1-binding motifs of I3 are highlighted with dashed boxes and are also shown as zoom-in views. c Immunoblotting of trapped His-I3 for the presence of PP1α and SDS22. His-I3 (2 μM) or His were incubated with buffer, PP1 (0.3 μM), SDS22 (0.3 μM) or PP1 + SDS22, and trapped by Ni-NTA magnetic beads. d Co-immunoprecipitation (EGFP-traps) of endogenous PP1 and SDS22 with ectopically expressed EGFP or EGFP-I3 variants, i.e., EGFP-tagged I3-(1–126; WT), I3-(1–84), I3-(1–70) or I3-(85–126). NT no transfection. e Schematic representation of the used EGFP-I3 truncation mutants and their interaction with PP1 and SDS22, as derived from data in (d). f Electrostatic surface of the SDS22:PP1:I3 AlphaFold model. The zoom-in view shows the charged residues of SDS22 and I3 that are predicted to interact. g Sequence alignment of the interacting fragments of SDS22 and I3, with the same color code for the involved charged residues. The alignment was generated using the EMBL-EBI MAFFT tool with the following UniProt identifiers: Homo sapiens, Q15435; Drosophila melanogaster, Q9VEK8; Caenorhabditis elegans, P45969; Saccharomyces cerevisiae, P36047; Schizosaccharomyces pombe, P22194; Arabidopsis thaliana, Q84WJ9. h Association of endogenous PP1 and SDS22 with transiently expressed, EGFP-trapped EGFP-I3-WT or EGFP-I3-DE4A. i Binding of endogenous PP1 and I3 to transiently expressed, EGFP-trapped EGFP-SDS2-WT or EGFP-SDS22-KR7A. j Co-immunoprecipitation (Strep-traps) of transiently expressed variants of Strep-I3 (Strep-I3-WT; Strep-I3-DE4R) and EGFP-SDS22 (EGFP-SDS22-WT; EGFP-SDS22-KR7E). The lower part of the EGFP blot (middle panel) was used for Strep-I3 detection (upper panel). k Isothermal titration calorimetry (ITC) experiments of purified SDS22-WT or SDS22-KR7A and His-I3. 5 μM SDS22-WT or SDS22-KR7A was titrated with 50 μM His-I3. The inset shows average Kd values ± SEM (n = 3).
Fig. 5
Fig. 5. The recruitment of I3 to nascent PP1 depends on SDS22.
a Association of mClover-trapped mClover, mClover-PP1-WT or mClover-PP1-2KA with endogenous SDS22 and I3. The expression of mClover-PP1 fusions in HeLa FlpIn T-REx cell lines was induced for 24 h with Dox. b Reduced recruitment of I3 to nascent Strep-PP1 (Strep-trapping) following the knockdown of SDS22. Strep-PP1γ expression in a HeLa FlpIn T-REx cell line was induced for 1 h with Dox. c The recruitment of SDS22 to nascent Strep-PP1 (Strep-trapping) was not affected by the knockdown of I3. The cells were treated as detailed for (b). d Overview of the lysated-based split-luciferase protocol. The interacting proteins (a and b) are shown in blue and the fused luciferase fragments are shown in pink. e Scheme of the used fusions with LgBiT or SmBiT. f Transient expression of SmBiT/LgBiT fusions in HEK293T cells. g Luciferase complementation following mixing of HEK293T lysates containing LgBiT-PP1 and a SmBiT-tagged RIPPO (WT or RATA mutant). The signals were normalized for the same expression level. The results were plotted as a percentage of the signal with LgBiT-PP1α + SmBIT-RIPPOWT (means ± SD; n = 3 independent experiments). P values were from two-sided unpaired t-test. h Comparison of luciferase complementation with the indicated SmBiT-RIPPOs (WT) and either LgBiT-PP1 or LgBiT-PP1–SDS22. The results were plotted as a percentage of the signal with LgBiT-PP1 + SmBIT-RIPPO. i Kinetic-trace experiments showing the time-dependent association of LgBiT-PP1 with I3-SmBiT or RM-SmBiT after addition of the RIPPO-SmBiT fusions (SmBiT). Also shown is the competitive disruption of the assembled complexes with 5 µM NIPP1-(143–224). The data are plotted as a percentage of the signal just before addition of competitor at 12 min. j Same experiment as in (i) but with LgBiT-PP1-SDS22. k Same experiment as in (j) but with I3-DE4A-SmBiT. l Kinetic-trace experiment showing the time-dependent association of LgBiT-PP1α and SDS22-SmBiT. Purified SDS22-WT and SDS22-E192A (10 μM) were added as competitors. The data are plotted as a percentage of the signal just before addition of competitor (t = 22 min). The experiments shown in (il) are representative for three independent experiments.
Fig. 6
Fig. 6. The SDS22:I3 interaction is essential for the assembly of functional PP1 holoenzymes.
a Association of endogenous p97/VCP, SDS22 and PP1 with transiently expressed and trapped EGFP or EGFP-trapped I3 variants from HEK293T cell lysates. NT non-transfected. b Co-immunoprecipitation of endogenous I3, MYPT1 and RepoMan (RM) with transiently expressed and trapped EGFP-tagged PP1-SDS22-WT/KR7A or EGFP-β-galactosidase (negative control) from HEK293T cell lysates. c Co-immunoprecipitation of transiently expressed EGFP-tagged SDS22-WT or SDS22-KR7A with Strep-PP1γ, induced in HeLa FlpIn T-REx cells with Dox for 0→24 h. d Expression of EGFP-tagged SDS22-WT and SDS22-KR7A in HeLa FlpIn T-Rex cell lines after Dox addition for 48 h. Also shown is endogenous SDS22 and PP1. e Cell proliferation of HeLa FlpIn T-Rex cells, treated or not with Dox to induce the expression of EGFP-tagged SDS22-WT or SDS22-KR7A. Cell proliferation was measured in 3 h intervals using IncuCyte. Cell confluency is shown as a percentage of the surface. The solid line represents the means of three technical replicates and the shaded area represents the SD range from a single data set, which is representative for three independent experiments. f The effect of EGFP-tagged SDS22-WT or SDS22-KR7A expression (induction for 48 h) on cell-cycle progression. The cells were first arrested at the G1/S transition. After thymidine release, the cells were blocked at the G2/M transition with RO3306. After RO3306 washout for the indicated times, the cells were fixed, stained with propidium iodide and analyzed by flow cytometry. g Images (left panel) and quantification (right panel) of M-phase duration, as derived from live-cell imaging of cells induced (48 h) to express EGFP-tagged SDS22-WT or SDS22-KR7A. The cells were analyzed after a double-thymidine arrest and a release for 6 h. P value is from two-sided unpaired t-test (n = 100 cells). The scale bars are 50 μm. h Confocal images of cells induced to express EGFP-tagged SDS22-WT or SDS22-KR7A for 48 h. Cells were treated with SDS22 siRNA. The cells were fixed following a release (60 min) from an RO3306 block. Cells in metaphase and anaphase were stained for DAPI, EGFP, α-tubulin, histone H3 phosphorylated at Thr3 (pH3T3) and pERM. Scale bars, 20 μm.
Fig. 7
Fig. 7. Model of the stepwise biogenesis of PP1 holoenzymes.
SDS22 binds irreversibly to newly translated PP1 to prevent its aggregation. SDS22:PP1 recruits I3 in an irreversible manner, due to the simultaneous interaction of I3 with PP1 and SDS22. Subsequently, SDS22 and I3 are co-extracted from the ternary SDS22:PP1:I3 complex by p97/VCP, enabling the association of released PP1 with canonical RIPPOs to form functional holoenzymes. In the absence of I3 or after mutation of the SDS22:I3 interaction site, SDS22 and associated PP1 are co-transferred to canonical RIPPOs, resulting in the assembly of inactive SDS:PP1:RIPPO complexes.

References

    1. Brautigan DL, Shenolikar S. Protein serine/threonine phosphatases: keys to unlocking regulators and substrates. Annu. Rev. Biochem. 2018;87:921–964. doi: 10.1146/annurev-biochem-062917-012332. - DOI - PubMed
    1. Heroes E, et al. The PP1 binding code: a molecular-lego strategy that governs specificity. FEBS J. 2013;280:584–595. doi: 10.1111/j.1742-4658.2012.08547.x. - DOI - PubMed
    1. Wu D, et al. A substrate-trapping strategy for protein phosphatase PP1 holoenzymes using hypoactive subunit fusions. J. Biol. Chem. 2018;293:15152–15162. doi: 10.1074/jbc.RA118.004132. - DOI - PMC - PubMed
    1. Ceulemans H, Stalmans W, Bollen M. Regulator-driven functional diversification of protein phosphatase-1 in eukaryotic evolution. BioEssays. 2002;24:371–381. doi: 10.1002/bies.10069. - DOI - PubMed
    1. Cao X, Lemaire S, Bollen M. Protein phosphatase 1: life-course regulation by SDS22 and Inhibitor-3. FEBS J. 2022;289:3072–3085. doi: 10.1111/febs.16029. - DOI - PubMed

Publication types