. 2024 Jun 25;15(1):5353.
doi: 10.1038/s41467-024-49712-0.

Development of a genetically encoded sensor for probing endogenous nociceptin opioid peptide release

Affiliations

Development of a genetically encoded sensor for probing endogenous nociceptin opioid peptide release

Xuehan Zhou et al. Nat Commun. .

Abstract

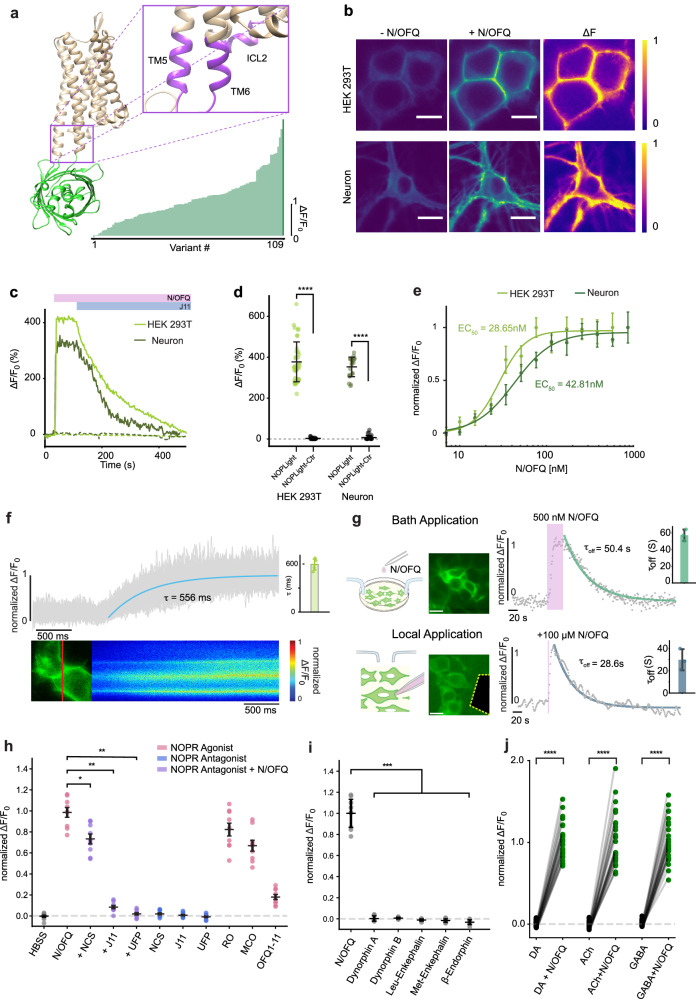
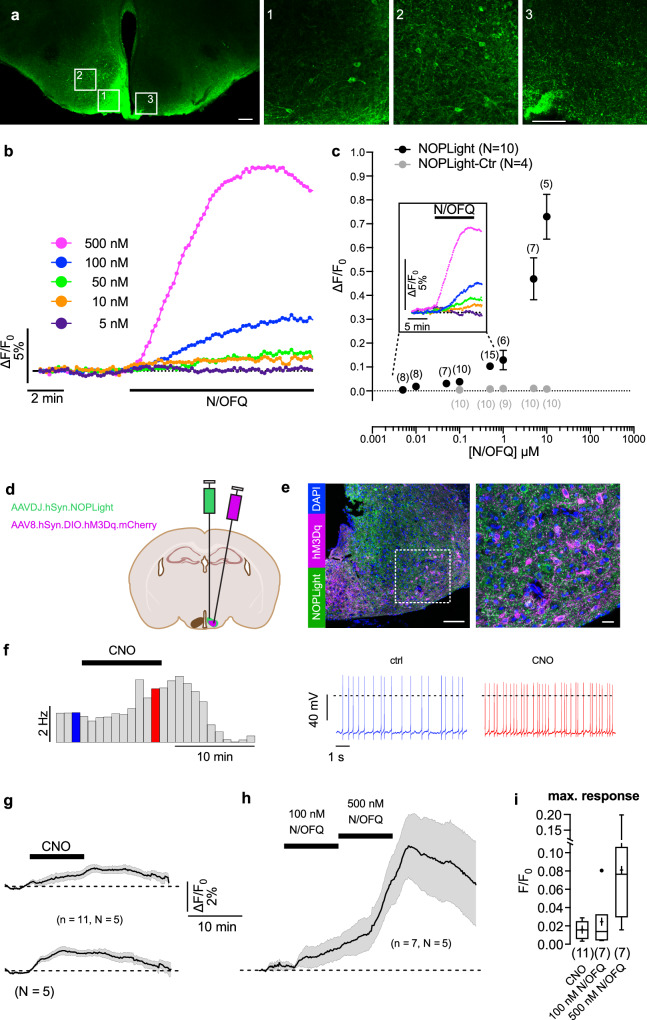
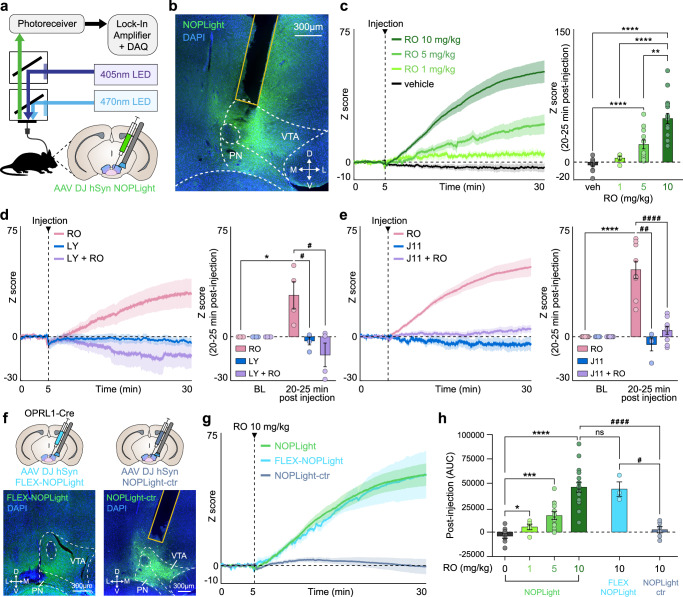
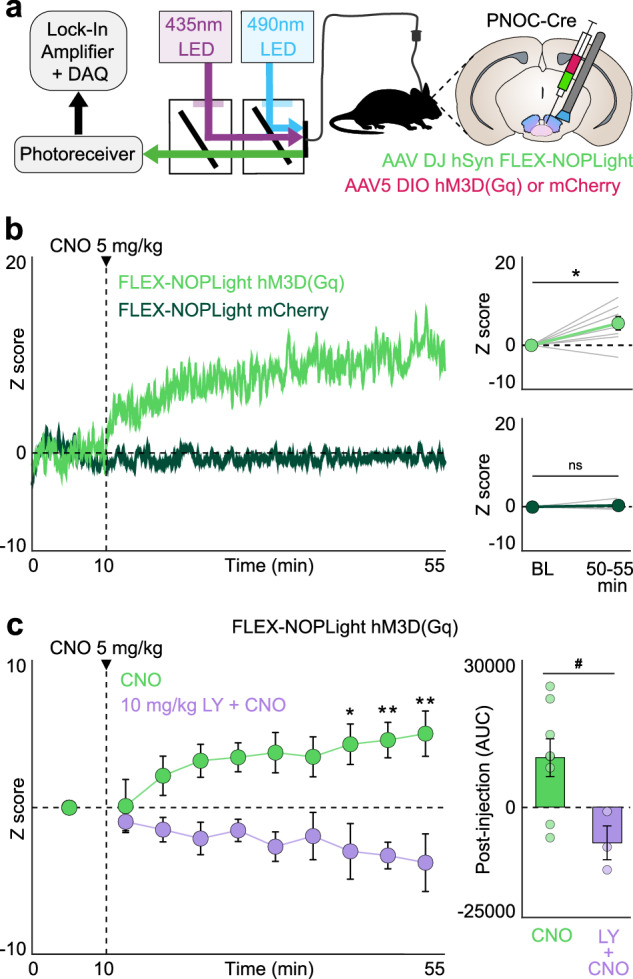
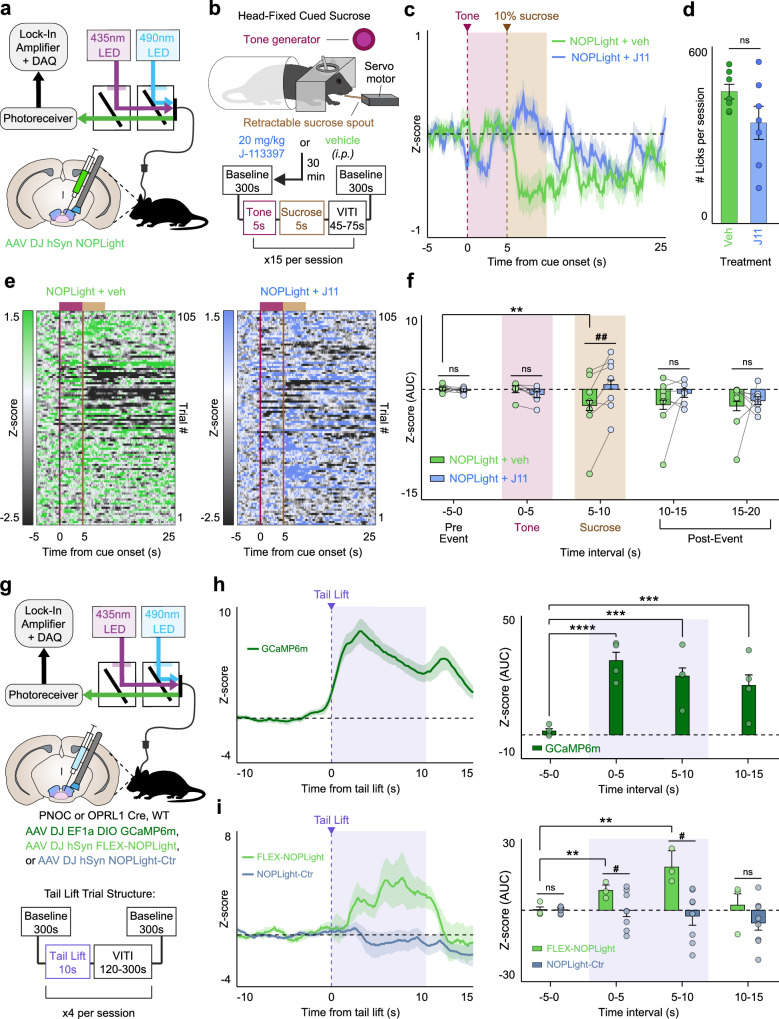
Nociceptin/orphanin-FQ (N/OFQ) is a recently appreciated critical opioid peptide with key regulatory functions in several central behavioral processes including motivation, stress, feeding, and sleep. The functional relevance of N/OFQ action in the mammalian brain remains unclear due to a lack of high-resolution approaches to detect this neuropeptide with appropriate spatial and temporal resolution. Here we develop and characterize NOPLight, a genetically encoded sensor that sensitively reports changes in endogenous N/OFQ release. We characterized the affinity, pharmacological profile, spectral properties, kinetics, ligand selectivity, and potential interaction with intracellular signal transducers of NOPLight in vitro. Its functionality was established in acute brain slices by exogeneous N/OFQ application and chemogenetic induction of endogenous N/OFQ release from PNOC neurons. In vivo studies with fibre photometry enabled direct recording of NOPLight binding to exogenous N/OFQ receptor ligands, as well as detection of endogenous N/OFQ release within the paranigral ventral tegmental area (pnVTA) during natural behaviors and chemogenetic activation of PNOC neurons. In summary, we show here that NOPLight can be used to detect N/OFQ opioid peptide signal dynamics in tissue and freely behaving animals.


Conflict of interest statement

T.P. is a co-inventor on a patent application (PCT/US17/62993) related to the genetically encoded sensor technology described in this article. The remaining authors declare no competing interests.

Figures

Fig. 1
Fig. 1. Development and in vitro characterization of NOPLight.
a Structural model of NOPLight and screening summary. n ≥ 3 cells for each variant. b Representative images of HEK293T cells (top; scale bars, 10 µm) and neurons (bottom; scale bars, 20 µm) expressing NOPLight before and after application of 1 µM N/OFQ and ΔF heat map. c Responses of NOPLight or NOPLight-ctr in HEK293T cell and neurons to 1 µM N/OFQ, followed by competition with 10 µM J-113397. d Quantification of maximal responses from (c), n = 38, 30, 22, 27 cells from three independent experiments, respectively. Data shown as mean ± SD. (One-sided Mann–Whitney U-test, ****P < 0.0001, P = 1.003 × 10−12, and 1.262 × 10−9 for NOPLight versus NOPLight-ctr in HEK293T and neurons). e Normalized response of HEK293T cells and neurons expressing NOPLight to N/OFQ titrations (mean ± SD) fitted with three-parameter Hill equation. n = 3 independent experiments per concentration. f Line-scan time plot of NOPLight ΔF/F0 (gray) from membrane-pixels shown in bottom. Right, quantification of time constant (τ) from four independent experiments. Data represented as mean ± SD. g Left: experimental schematics and images (scale bars, 20 µm), right: time plot of normalized ΔF/F0 from a representative experiment (gray) with quantified time constant (τoff). Data represented as mean ± SD. h Maximal NOPLight response to: NCS, Nocistatin; J11, J-113397; UFP, UFP-101; RO, Ro 64-6198; MCO, MCOPPB; OFQ1-11, Orphanin-FQ (1–11)). *P < 0.05, **P < 0.01, P = 0.024, Nocistatin; 0.0012, J-113397; 0.0012, UFP-101. n = 9 cells except MCO (n = 8) from three independent experiments. i Maximal NOPLight response to endogenous opioid ligands (1 µM). **P < 0.01, P = 0.003, Dynorphin A; P = 0.003, Dynorphin-B; P = 0.003, Leu-Enkephalin; P = 0.003, Met-Enkephalin; P = 0.003, β-endorphin. n = 9 from three independent experiments. Statistical comparisons in (h, i) by one-sided pairwise Mann–Whitney rank test with post hoc Bonferroni correction, data represented as mean ± SEM. j NOPLight response to neurotransmitters (DA dopamine, ACh acetylcholine, GABA gamma-Aminobutyric, all 1 mM). n = 29 (DA) or 30 (ACh, GABA) cells from three independent experiments (two-sided paired t-test, ****P < 0.0001, P = 2.45 × 10−22, 7.46 × 10−19, and 7.82 × 10−21, respectively).
Fig. 2
Fig. 2. Ex vivo characterization of NOPLight.
a Expression of NOPLight in the ARC. Scale bar, 200 µm. Insets, scale bars, 50 µm. bf Change in NOPLight fluorescence measured in ARC neurons in response to bath-applied N/OFQ or release of chemogenetically-activated PNOC neurons. Fluorescence was detected from 0.15–0.2 mm2 ROIs. Each experiment was performed in a different brain slice. b NOPLight responses of a single ROI to increasing N/OFQ concentrations. c Concentration-response relation showing N/OFQ effect on the fluorescence of NOPLight (black) and NOPLight-Ctr (gray) -expressing cells in the ARC. Data represented as mean ± SEM. Inset, mean fluorescence increases in response to different concentrations of N/OFQ. Color-code as in (b). d Experimental schematic for chemogenetic experiments in brain slices. e Representative immunohistochemical image showing DREADD (hM3Dq) expression in PNOC neurons of the ARC as well as pan-neuronal expression of NOPLight. Scale bar, 100 µm. Magnification is shown on the right. Scale bar, 20 µm. f Perforated patch-clamp recordings from a hM3Dq-expressing PNOC neuron showing the effect of 10 min CNO application (3 µM) on action potential frequency. Left, rate histogram (bin width 60 s). Right, representative sections of the original recording correspond to the times indicated by the blue and red color codes. gi Changes (mean ± SEM) in NOPLight fluorescence measured in the ARC in response to activation of hM3Dq-expressing PNOC neurons by 10 min bath application of 3 µM clozapine-N-oxide (CNO) (g) and 100 nM and 500 nM N/OFQ (h). g Upper and lower are the same data: traces in the upper panel are aligned to the CNO application, and traces in the lower panel are aligned to the response onset. Recordings in (g, h) were performed from the same brain slices. Bars indicate the application of CNO and N/OFQ, respectively. Scale bars apply to (g, h). i Maximal fluorescence changes upon applications of CNO and N/OFQ, respectively. The box represents the interquartile range, indicating the 25th and 75th percentiles with a median marked by a horizontal line inside the box. Whiskers extend to the minimum and maximum values, excluding outliers (•). The numbers in brackets represent the number of experiments (brain slices). N values indicate the number of animals. Data represented as mean ± SEM.
Fig. 3
Fig. 3. Characterization of NOPLight response in vivo to pharmacological agonism and antagonism.
a Fiber photometry schematic. Cartoon of NOPLight viral injection and fiber implant in the VTA. b Representative image showing DAPI (blue) and NOPLight (green) expression with fiber placement. c Left: Averaged traces of NOPLight fluorescence after systemic (i.p.) injection of vehicle (veh, black; n = 11 mice) or 1, 5, or 10 mg/kg of selective NOPR agonist Ro 64-6198 (RO, green; n = 5, 12, or 16 mice/group, respectively). Right: Mean NOPLight fluorescence 20–25 min after RO injection increases dose-dependently (two-tailed Mann–Whitney test, **p = 0.0012, ****p < 0.0001). Data represented as mean ± SEM. d Left: Averaged traces of NOPLight fluorescence after 10 mg/kg RO (pink), 10 mg/kg selective NOPR antagonist LY2940094 (LY, o.g., blue), or both (purple) (n = 4 mice). Right: Increase in signal 20–25 min after RO is blocked by LY pretreatment (two-tailed Mann–Whitney test, *p = 0.0286, #p = 0.0286, n = 4 mice). Data represented as mean ± SEM. e Same as (d) for NOPR antagonist J-113397 (J11, i.p.) (two-tailed Mann–Whitney test, ##p = 0.0028, ####p < 0.0001, ****p < 0.0001, n = 9 mice, RO; 4 mice, J11; 9 mice, J11 + RO). Data represented as mean ± SEM. f Top: Cartoon of FLEX-NOPLight or NOPLight-ctr viral injection and fiber implant in the VTA. Bottom: Representative image showing expression of DAPI (blue) and FLEX-NOPLight (left, green) or NOPLight-ctr (right, green), with fiber placement in VTA. g Averaged traces of NOPLight (green), FLEX-NOPLight (blue), or NOPLight-ctr (gray) fluorescence (n = 16, 3, 6 mice, respectively) after systemic (i.p.) injection of 10 mg/kg RO. Data represented as mean ± SEM. h Area under the curve (AUC) of each NOPLight variant after RO injection (two-tailed Mann–Whitney test, *p = 0.0275, ***p = 0.0001, ****p < 0.0001, ns not significant (p = 0.9577), #p = 0.0238, ####p < 0.0001. Group sizes left to right: n = 11, 5, 12, 16, 3, and 6 mice). Data represented as mean ± SEM. PN paranigral VTA, veh vehicle, BL baseline.
Fig. 4
Fig. 4. NOPLight detects chemogenetically evoked endogenous N/OFQ release in vivo.
a Schematic of fiber photometry setup. Coronal brain cartoon of fiber implant and viral co-injection of FLEX-NOPLight with either DIO-hM3D(Gq) or mCherry in the VTA of PNOC-Cre mice. b Left: Representative traces of FLEX-NOPLight fluorescence after systemic (i.p.) injection of 5 mg/kg clozapine-N-oxide (CNO) in hM3D(Gq) (light green) or mCherry control (dark green) animals. Right: Mean FLEX-NOPLight fluorescence 40–45 min after CNO injection is significantly elevated relative to the pre-injection baseline period (BL) in hM3D(Gq) (two-tailed Wilcoxon test, *p = 0.0391, n = 8 mice) but not control animals (two-tailed Wilcoxon test, p > 0.9999, ns not significant, n = 3 mice). Z-scores for each individual animal averaged at baseline, and 50–55 min are shown (gray lines). Data represented as mean ± SEM. c Left: FLEX-NOPLight fluorescence (green) averaged before injection of 5 mg/kg CNO (0–10 min), and in 5 min bins following injection. 10 mg/kg of selective NOPR antagonist LY2940094 (LY) was administered (o.g.) to the LY + CNO (purple) group 30 min prior to photometry recording (two-way repeated-measures ANOVA with Bonferroni’s post hoc test, *p = 0.0207 (40–45 min), **p = 0.0094 (45–50 min) or 0.0024 (50–55 min), n = 8 mice, CNO; three mice, LY + CNO). Right: Area under the curve (AUC) of FLEX-NOPLight signal after CNO injection (cumulative, 45 min). Pretreatment with NOPR antagonist LY prevents CNO-induced increases in FLEX-NOPLight fluorescence (two-tailed Mann–Whitney test, #p = 0.0485, n = 8 mice, CNO; three mice, LY + CNO). Data represented as mean ± SEM.
Fig. 5
Fig. 5. NOPLight in vivo reports bidirectional endogenous N/OFQ dynamics during consummatory and aversive behaviors.
a Fiber photometry schematic. Cartoon of viral injection of NOPLight and fiber implant in VTA of wild-type mice (n = 7 mice). b Cartoon depicting head-fixed cued-sucrose setup and trial structure. c Averaged traces of NOPLight fluorescence following pretreatment with vehicle (veh, green) or 20 mg/kg NOPR antagonist J-113397 (J11, blue), aligned to tone onset (magenta, shaded). Data represented as mean ± SEM. d Average licks made during vehicle or J-113397 sessions (two-tailed Wilcoxon test, p = 0.1649, ns not significant, n = 7 mice). Data represented as mean ± SEM. e Heat maps of NOPLight fluorescence, rows correspond to trials averaged in (c) for vehicle (left) and J11 (right) sessions. f Area under the curve (AUC) for averaged traces from (c), calculated over 5-s intervals surrounding cued-sucrose events. Decrease in NOPLight fluorescence during 10% sucrose access (two-tailed Wilcoxon test, **p = 0.0034, n = 7 mice) is blocked by J11 pretreatment (two-tailed Mann–Whitney test, ##p = 0.0022, n = 7 mice). Data represented as mean ± SEM. g Top: Fiber photometry schematic. Middle: Cartoon depicting fiber implant and viral injection of DIO-GCaMP6m, FLEX-NOPLight, or NOPLight-ctr into the VTA of PNOC-Cre, OPRL1-Cre, or WT mice, respectively. Bottom: Session trial structure. h Left: Averaged trace of pnVTAPNOC GCaMP6m activity during tail lift. Right: AUC for photometry trace calculated over 5-s intervals surrounding tail lift (two-tailed Wilcoxon test, ***p = 0.0002 (5–10 s) or 0.0003 (10–15 s); ****p < 0.0001, n = 4 mice). Data represented as mean ± SEM. i Left: Averaged traces of FLEX-NOPLight (green) and NOPLight-ctr (gray) fluorescence during the tail lift. Right: AUC for photometry traces calculated over 5-s intervals surrounding tail lift. FLEX-NOPLight fluorescence increases during tail lift (two-tailed Wilcoxon test, **p = 0.0034 (0–5 s) or 0.0093 (5–10 s); n = 3 mice), NOPLight-ctr fluorescence remains unchanged (two-tailed Mann–Whitney test, #p = 0.0264 (0–5 s) or 0.0326 (5–10 s); n = 8 mice, NOPLight-ctr; 3 mice, FLEX-NOPLight). Data represented as mean ± SEM. VITI variable inter-trial interval.
Fig. 6
Fig. 6. NOPLight detection of endogenous VTA N/OFQ release during high effort reward-seeking.
a. Fiber photometry schematic. Cartoon of NOPLight viral injection and fiber implant in the VTA of WT mice (n = 4 mice). Representative image showing expression of DAPI (blue) and NOPLight (green) with fiber placement in VTA. b. Left: Cartoon depicting operant box setup for the progressive ratio (PR) test. Right: Trial structure for reward delivery during the paradigm. c. Top: Averaged trace of NOPLight signal for all mice (n = 4), aligned to rewarded active nose pokes (ANPs) made during the PR test. Epoch includes the 5 s light cue (yellow, shaded) that precedes reward delivery. Time to pellet retrieval and duration of consumption period averaged across all trials (brown, shaded). Data represented as mean ± SEM. Bottom: Heat map, each row corresponds to a single, rewarded ANP epoch. d Top: Averaged trace of NOPLight signal for all mice (n = 4), aligned to non-rewarded ANPs made during the PR test. Data represented as mean ± SEM. Bottom: Heat map, each row corresponds to a single, non-rewarded ANP epoch. e NOPLight fluorescence averaged over 5-s intervals for rewarded (green) and non-rewarded (blue) ANP epochs. Time to pellet retrieval and duration of consumption period averaged across all rewarded trials (brown, shaded). Across rewarded ANP trials, NOPLight signal decreases during reward consumption then immediately increases post-consumption relative to NOPLight signal measured during non-rewarded ANP epochs (two-way repeated-measures ANOVA with Bonferroni’s post hoc test, *p = 0.0122, **p = 0.0033, ***p = 0.0003, n = 4 mice). Data represented as mean ± SEM. f, g Area under the curve (AUC) for photometry traces from c and d, respectively, calculated over 5-s intervals surrounding (f) rewarded ANPs (two-tailed Wilcoxon test, *p = 0.0125 (25–30 s) or 0.031 (30–35 s); **p = 0.007 (5–10 s) or 0.0042 (15–20 s); ***p = 0.0008 (10–15 s); n = 4 mice) and (g) non-rewarded ANPs (two-tailed Wilcoxon test, *p = 0.0128 (5–10 s), ****p < 0.0001 (0–5 s), n = 4 mice). Data represented as mean ± SEM.

Update of

References

    1. Meunier J-C, et al. Isolation and structure of the endogenous agonist of opioid receptor-like ORL1 receptor. Nature. 1995;377:532–535. doi: 10.1038/377532a0. - DOI - PubMed
    1. Reinscheid RK, et al. Orphanin FQ: a neuropeptide that activates an opioidlike G protein-coupled receptor. Science. 1995;270:792–794. doi: 10.1126/science.270.5237.792. - DOI - PubMed
    1. Wang, Y. et al. Structures of the entire human opioid receptor family. Cell10.1016/j.cell.2022.12.026 (2023). - PubMed
    1. Thompson AA, et al. Structure of the nociceptin/orphanin FQ receptor in complex with a peptide mimetic. Nature. 2012;485:395–399. doi: 10.1038/nature11085. - DOI - PMC - PubMed
    1. Toll L, Bruchas MR, Calo’ G, Cox BM, Zaveri NT. Nociceptin/orphanin FQ receptor structure, signaling, ligands, functions, and interactions with opioid systems. Pharmacol. Rev. 2016;68:419–457. doi: 10.1124/pr.114.009209. - DOI - PMC - PubMed