. 2024 Jun 25;15(1):5393.
doi: 10.1038/s41467-024-49727-7.

Transcription regulates the spatio-temporal dynamics of genes through micro-compartmentalization

Affiliations

Transcription regulates the spatio-temporal dynamics of genes through micro-compartmentalization

Hossein Salari et al. Nat Commun. .

Abstract

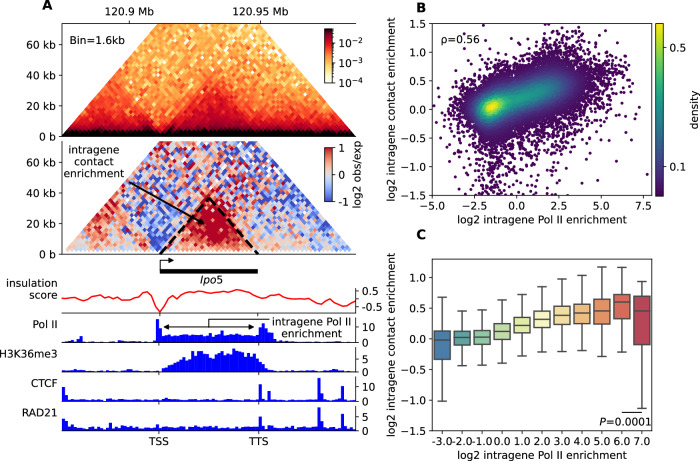
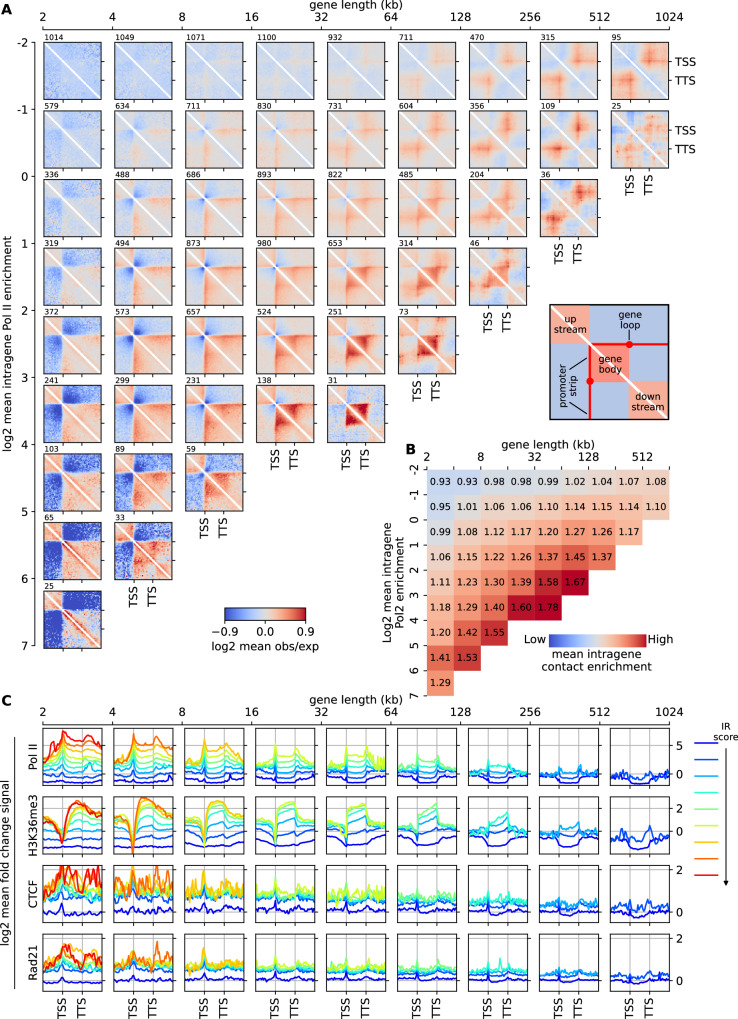
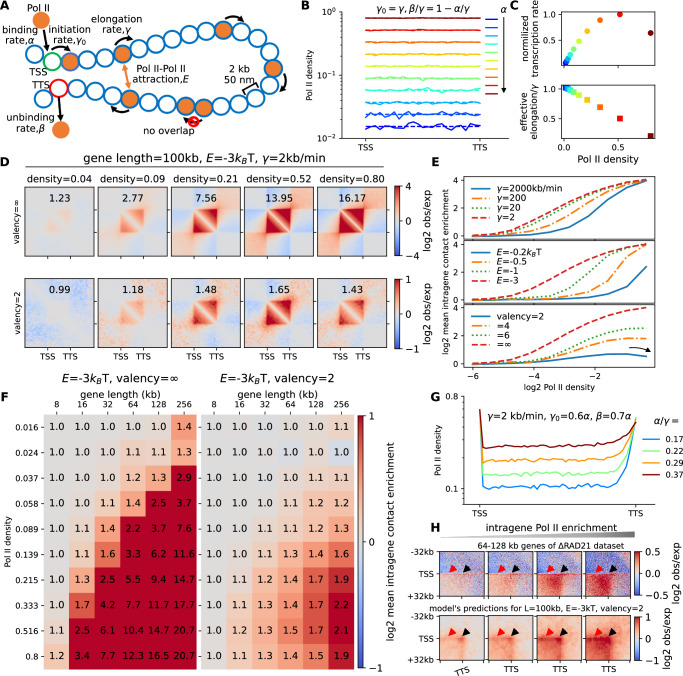
Although our understanding of the involvement of heterochromatin architectural factors in shaping nuclear organization is improving, there is still ongoing debate regarding the role of active genes in this process. In this study, we utilize publicly-available Micro-C data from mouse embryonic stem cells to investigate the relationship between gene transcription and 3D gene folding. Our analysis uncovers a nonmonotonic - globally positive - correlation between intragenic contact density and Pol II occupancy, independent of cohesin-based loop extrusion. Through the development of a biophysical model integrating the role of transcription dynamics within a polymer model of chromosome organization, we demonstrate that Pol II-mediated attractive interactions with limited valency between transcribed regions yield quantitative predictions consistent with chromosome-conformation-capture and live-imaging experiments. Our work provides compelling evidence that transcriptional activity shapes the 4D genome through Pol II-mediated micro-compartmentalization.


Conflict of interest statement

The authors declare no competing interests.

Figures

Fig. 1
Fig. 1. Correlation between intra-gene contact and intra-gene Pol II enrichments.
A Observed Micro-C contact map (top), observed/expected map (middle) and several ChIP-seq profiles (bottom) of the genomic region including the Ipo5 gene (chr14:120,874-120,984 kb) in mESC. The intra-gene contact (IC) and RNA Pol II (IR) enrichments are illustrated. B Scatterplot of IC versus IR for all genes longer than 1 kb (24,363 genes). Colors refer to the density of dots. C Boxplots of IC after clustering together the genes (dots in (B)) with similar IR. The number of genes in each cluster from left (IR score = −3) to right (IR score = 7) are, respectively, 175, 1629, 6603, 4515, 3926, 3673, 2463, 946, 265, 109, and 37. Boxplots present the median and 25th and 75th percentile, with the whiskers extending to 1.5 times the interquartile range. Two-tailed t-tests were performed between the two last clusters 6 and 7, p-value = 0.0001. Source data are provided as a Source Data file.
Fig. 2
Fig. 2. Gene classification based on size and Pol II occupancy, and pileup meta-gene analysis.
A Pileup meta-gene analysis (PMGA, see Methods) of the obs/exp map around genes clustered based on their length (horizontal axis) and Pol II enrichment (vertical axis). The number of genes of each cluster is indicated above on each map. Maps for clusters with less than 25 representative genes were not drawn, due to lack of statistics. B Average IC scores for each cluster in (A). C PMGA of different chromatin tracks: in each subplot, all the average profiles of the different Pol II clusters for genes of the same length range are shown (from left to right: from small to large genes); different colors correspond to the different Pol II clusters, from low (blue) to high (red) IR score (respectively, −2,−1,0,1,2,3,4,5,6). Source data are provided as a Source Data file.
Fig. 3
Fig. 3. Gene conformation is affected by acute change in Pol II but not in CTCF and cohesin.
A Comparison between PMGA of untreated WT cells and cells treated with transcription inhibitors for genes with size of 64-128 kb, IRwt > 1 in WT condition and with a reduced IR score in treated cells (IRtreat.<IRwt). B PMGA for genes with size of 64-128 kb and 1<IRwt < 2 in conditions of reduced CTCF, RAD21 or WAPL levels or for a subset of genes with low SMC1a level in WT cells (WT no SMC1a, most left). C Scatter Plot of fold change of intragene contact enrichment against the fold change in Pol II occupancy after TRP treatment for the genes >64 kb, IRwt > 1 in WT condition and with a reduced IR score in treated cells (IRtreat.<IRwt). The Spearman correlation is given. D The intragene contact enrichment upon acute depletion of RAD21, CTCF and WAPL, by IAA treatment of an engineered ES cell line, or by treatment with triptolide (TRP), as a function of IR score in the treated cells. The Spearman’s correlation between average IC and IR scores of WT is 0.97. Data are presented as mean values ± SD and were computed over a number of genes always higher than 10 (median number = 1735). E Scheme summarizing the different determinants of structures observed inside or around active genes. Source data are provided as a Source Data file.
Fig. 4
Fig. 4. Transcription-mediated interactions regulate gene folding.
A Schematic representation of the TASEP-decorated polymer model for gene transcription and 3D folding. B Pol II profiles along a 100kbp-long gene (L = 50 monomers) for parameters tuned to generate a uniform occupancy along the gene, from low (blue) to high (red) densities, (respectively, 0.016, 0.024, 0.037, 0.058, 0.089, 0.139, 0.215, 0.333, 0.516, and 0.800). The solid and dashed curves are predictions from Monte-Carlo simulations and analytical calculations, respectively (see Methods). C Normalized transcription rate (top), defined as the average number of Pol II unloadings from the TTS per time unit divided by its maximum, and normalized effective elongation rate (bottom), defined as the inverse of the time needed for one Pol II to fully transcribed a gene, as a function of Pol II density. D Predicted contact maps around a 100kbp-long gene for different Pol II densities and valencies. Corresponding IC scores are given. E IC versus IR curves as a function of the elongation rate γ (top), strength of interaction E (middle) and valency (bottom). F IC scores against IR scores (Pol II density) and gene length for two different valencies. The color bar is presented in a log2 scale, while the values are given in a linear scale. G Examples of non-uniform Pol II profiles having significant accumulations at TSS and TTS. (H) (Top) PMGA analysis of the contact around the TSS-TTS loop for 64-128 kb-long genes with increasing IR scores (from left to right) taken from ∆RAD21 dataset. (Bottom) Model predictions around the TSS-TTS loop for the non-uniform cases described in (G). TTS-TTS loops and promoter stripes are shown with black and red arrows, respectively. Source data are provided as a Source Data file.
Fig. 5
Fig. 5. Transcriptional bursting leads to dynamical changes in gene conformation.
A Schematic representation of transcriptional burst, where TSS alternatively switched on and off. B Three different examples of bursty gene activity ranging from long (k = 0.01/min) to short (k = 0.04/min) train size. C Probability distributions of the number of trains elongating on a gene at the same time for the three bursty regimes depicted in (B). D Average Pol II density profiles for the three bursty regimes depicted in (B) and in the absence of burst. E Predicted contact maps with (lower left triangular part) and without burst (upper right triangular part) for long (top) and short (bottom) trains. F Pol II density profiles when TSS is “on” (solid lines) or “off” (dashed lines) for long (blue lines) and short (green lines) trains. G Predicted contact maps for conditions similar to (F). Color scale is the same as panel (E). H (Top to bottom) Time evolution of the radius of gyration (RG) of a gene, TSS state, Pol II density along the gene and the number of trains elongating along the gene for k = 0.01/min. Examples of 3D gene conformation are drawn when the gene is more or less condensed. Bars = 200 nm. I Violin plots of RG in the “off” and “on” states for the three burst regimes in (B). The black dashed lines show the predictions for homopolymer model (i.e. zero interaction case). J Boxplot of RG as a function of the Pol II density for k = 0.01/min. Boxplots present the median and 25th and 75th percentile, with the whiskers extending to 1.5 times the interquartile range. They were computed over a number of snapshots always higher than 10 (median number ~105). K A typical snapshot of gene 3D conformation (gene in light blue, flanking regions in dark blue) in the presence of two trains. The 1D representation shows the locations of Pol II-bound monomers for each train (orange and red dots). All simulations were done for a 100-kb gene with valency = 2, E=3kBT. Source data are provided as a Source Data file.
Fig. 6
Fig. 6. Transcription activity slows down gene mobility.
A Mean-squared displacement MSD~DΔtδ vs time-lag Δt for different Pol II densities for a 256kbp-long gene. B Diffusion exponent δ as a function of gene size and Pol II density. C As in (B) but for the diffusion constant D normalized by its value D0 in the absence of transcription. The color bar is presented in a log2 scale, while the values are given in a linear scale. D The ratio of MSD with (MSD) and without (MSD0) Pol II at t = 9.3 s as a function of Pol II density for a 256kbp-long gene. Color scale as in (A) and data are presented as mean values ± SD and were computed over 20 different trajectories. All simulations were done with valency = 2, E=3kBT. Source data are provided as a Source Data file.
Fig. 7
Fig. 7. Inter-gene contacts between active genes.
A Micro-C contact map of a ~1 Mb region of mESC chromosome 1, with corresponding gene annotation and ChIP-seq profiles below. Inset shows a zoom between the long, highly-active genes of Ahctf1 and Parp1 (respectively, 58.7 kb and 32.3 kb-long and an expression of 22.4 FPKM and 151.4 FPKM). B Inter-gene pileup meta-gene analysis of the contact enrichment between two distant genes as a function of their intra-gene Pol II enrichment. C Model predictions for contacts between 60-kb-long genes for three different Pol II densities. D Examples of simulated 3D configurations illustrating the inter-gene interactions at various Pol II densities (gene regions in yellow and red, surrounding genomic regions in blue). All simulations were done with valency=2, E=3kBT. Source data are provided as a Source Data file.

References

    1. Eagen KP. Principles of chromosome architecture revealed by Hi-C. Trends Biochem. Sci. 2018;43:469–478. doi: 10.1016/j.tibs.2018.03.006. - DOI - PMC - PubMed
    1. Jerkovic I, Cavalli G. Understanding 3D genome organization by multidisciplinary methods. Nat. Rev. Mol. Cell Biol. 2021;22:511–528. doi: 10.1038/s41580-021-00362-w. - DOI - PubMed
    1. Lieberman-Aiden E, et al. Comprehensive mapping of long-range interactions reveals folding principles of the human genome. Science. 2009;326:289–293. doi: 10.1126/science.1181369. - DOI - PMC - PubMed
    1. Rowley MJ, et al. Evolutionarily conserved principles predict 3D chromatin organization. Mol. Cell. 2017;67:837–852. doi: 10.1016/j.molcel.2017.07.022. - DOI - PMC - PubMed
    1. Dixon JR, et al. Topological domains in mammalian genomes identified by analysis of chromatin interactions. Nature. 2012;485:376–380. doi: 10.1038/nature11082. - DOI - PMC - PubMed