. 2024 Aug;34(8):572-585.
doi: 10.1038/s41422-024-00992-7. Epub 2024 Jun 25.

Localized, highly efficient secretion of signaling proteins by migrasomes

Affiliations

Localized, highly efficient secretion of signaling proteins by migrasomes

Haifeng Jiao et al. Cell Res. 2024 Aug.

Abstract

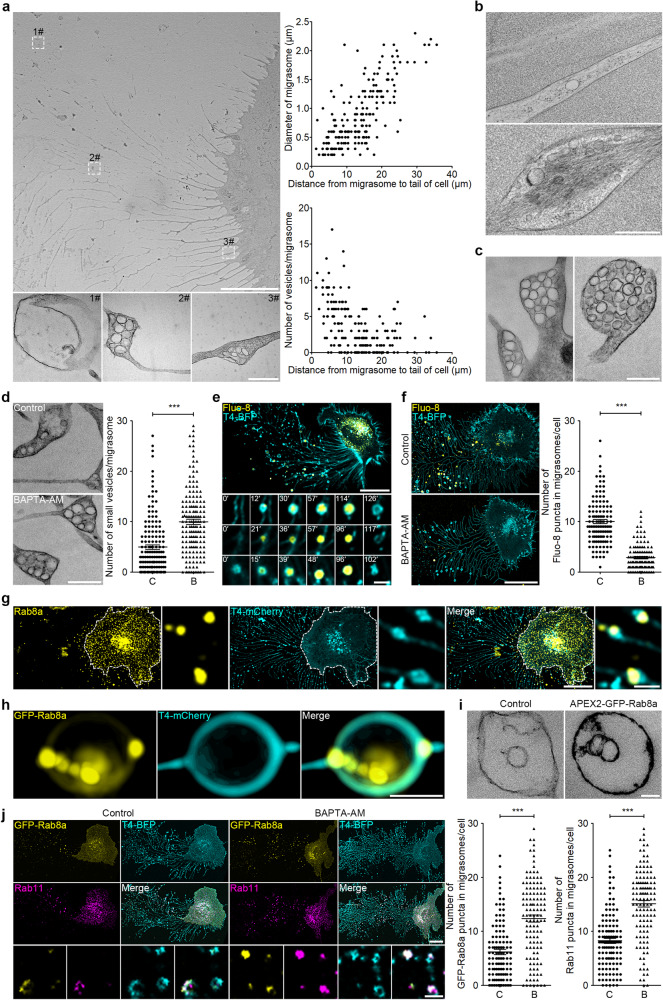
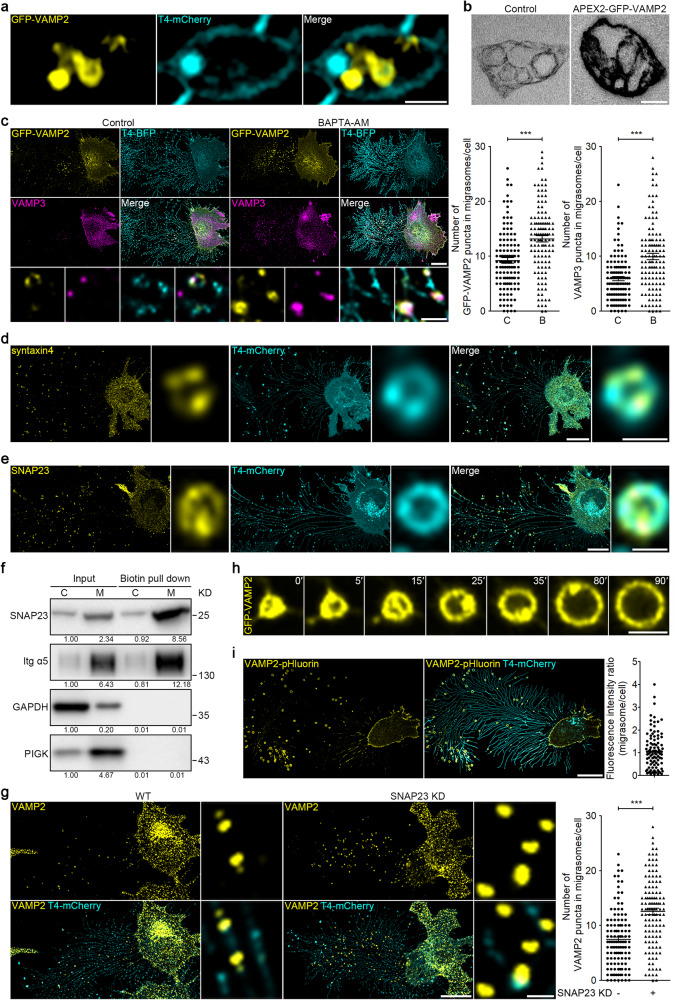
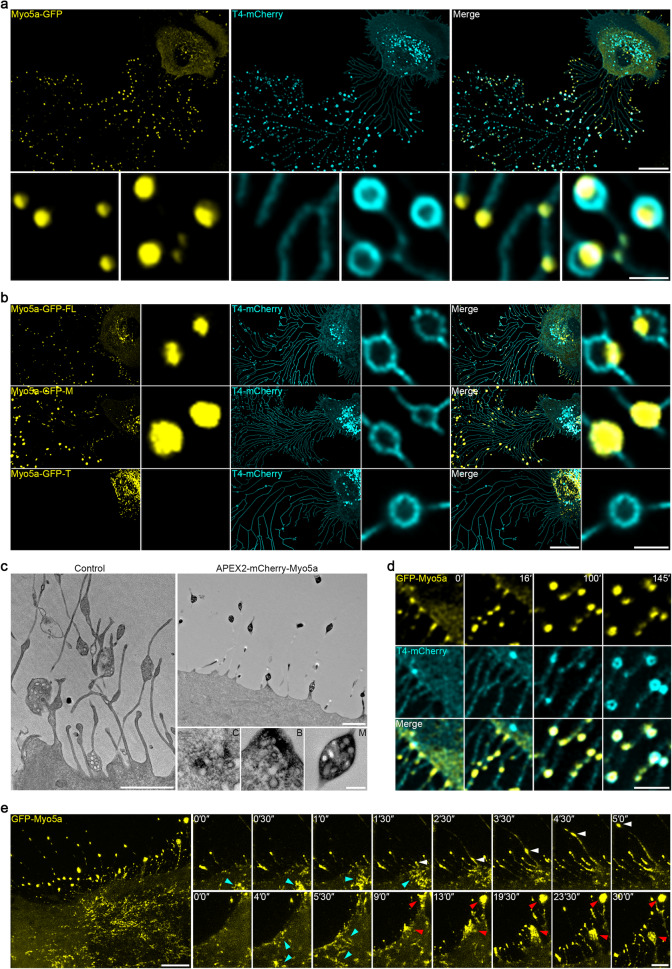
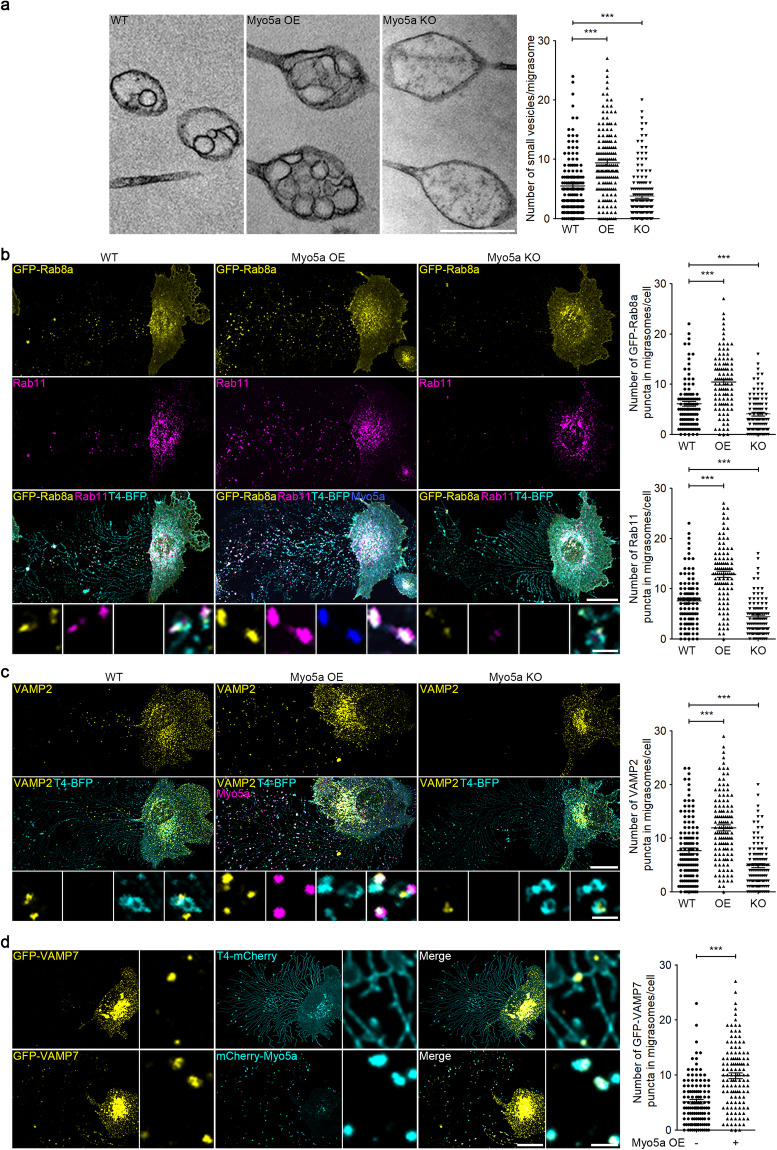
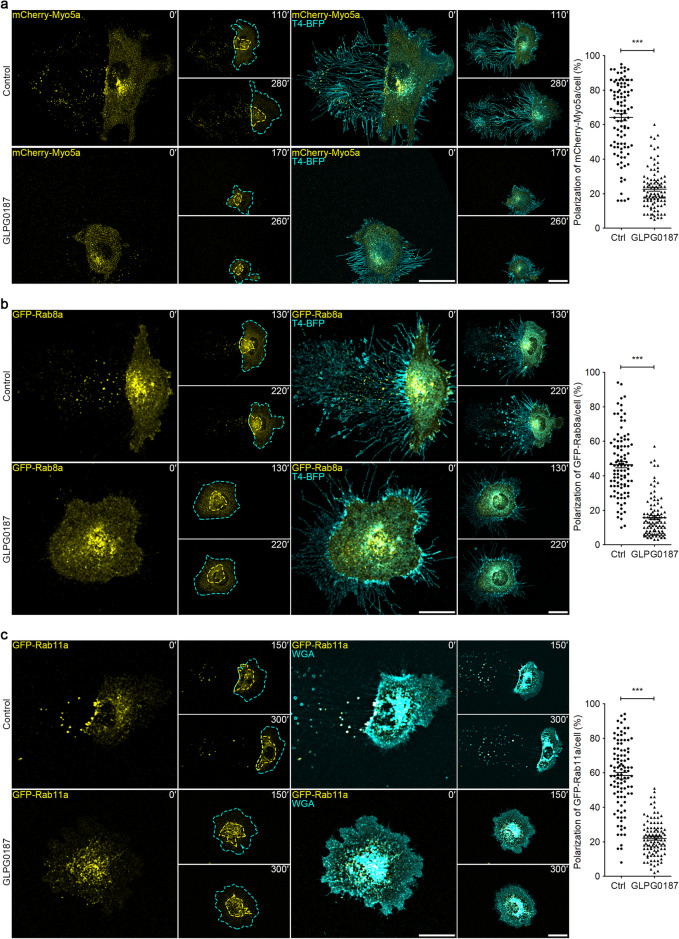
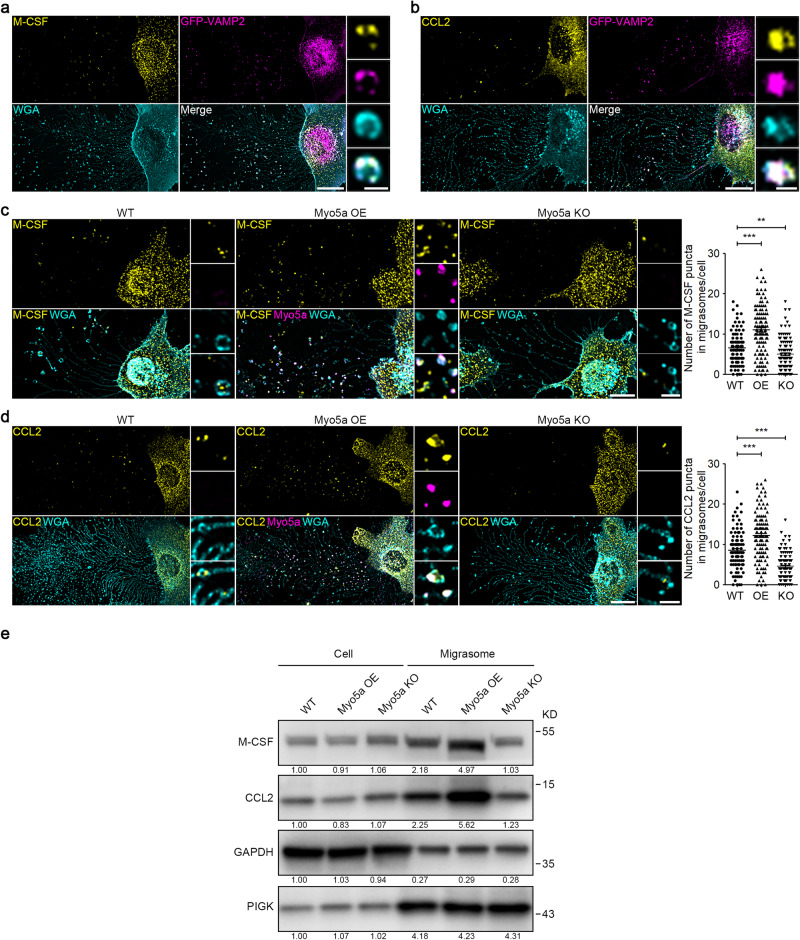
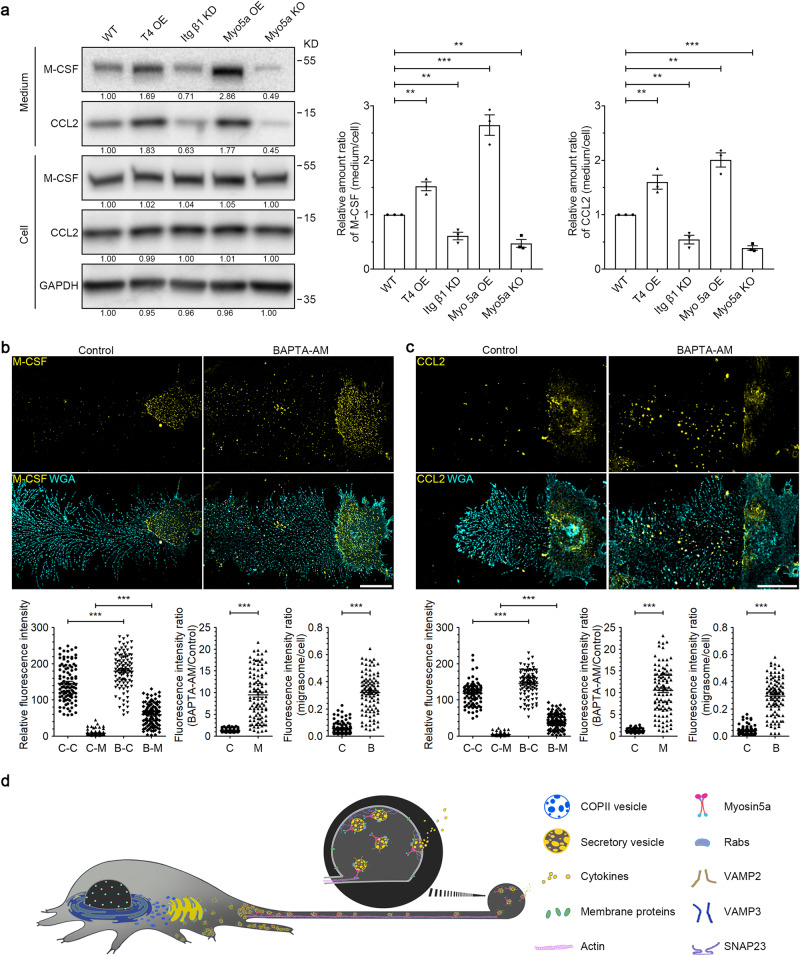
Migrasomes, enriched with signaling molecules such as chemokines, cytokines and angiogenic factors, play a pivotal role in the spatially defined delivery of these molecules, influencing critical physiological processes including organ morphogenesis and angiogenesis. The mechanism governing the accumulation of signaling molecules in migrasomes has been elusive. In this study, we show that secretory proteins, including signaling proteins, are transported into migrasomes by secretory carriers via both the constitutive and regulated secretion pathways. During cell migration, a substantial portion of these carriers is redirected to the rear of the cell and actively transported into migrasomes, driven by the actin-dependent motor protein Myosin-5a. Once at the migrasomes, these carriers fuse with the migrasome membrane through SNARE-mediated mechanisms. Inhibiting migrasome formation significantly reduces secretion, suggesting migrasomes as a principal secretion route in migrating cells. Our findings reveal a specialized, highly localized secretion paradigm in migrating cells, conceptually paralleling the targeted neurotransmitter release observed in neuronal systems.


Conflict of interest statement

The authors declare no competing interests.

Figures

Fig. 1
Fig. 1. Characterization of the intraluminal vesicles of migrasomes.
a TEM images of an L929 cell. Scale bar, 10 μm. Lower panels, enlarged regions of interest (ROI). Scale bar, 500 nm. Right panels, quantification of the relationship between the distance from the migrasome to the cell body and the migrasome diameter (top) or the number of intraluminal vesicles per migrasome (bottom). n = 30 cells from three independent experiments. b TEM images of high-pressure freezing samples of retraction fiber and migrasome from L929 cells. Upper panel, retraction fiber. Lower panel, migrasome. Scale bar, 500 nm. c TEM images of migrasomes from L929 cells. Left panel, the entrances of retraction fibers. Right panel, a detached migrasome. Scale bar, 500 nm. d TEM images of migrasomes from L929 cells treated with 10 μM BAPTA-AM for 10 h. Scale bar, 500 nm. Right panel, statistical analysis of the number of small vesicles per migrasome. Data are means ± SEM. C control, B BAPTA-AM. n > 100 migrasomes from three independent experiments. Two-tailed unpaired t-test was used for statistical analyses. ***P < 0.001. e L929 cells stably expressing Tspan4 (T4)-BFP were stained with Fluo-8 and then subjected to time-lapse imaging. Time interval, 180 s. Scale bar, 20 μm. The lower panels show enlarged migrasomes. Scale bar, 2 μm. f L929-T4-BFP cells, treated with 10 μM BAPTA-AM for 10 h, were stained with Fluo-8 and then visualized. Scale bar, 20 μm. Right panel, statistical analysis of the number of Fluo-8 puncta in migrasomes per cell. Data are means ± SEM. n > 100 cells from three independent experiments. Two-tailed unpaired t-test was used for statistical analyses. ***P < 0.001. g L929-T4-mCherry cells were immunostained with antibody against Rab8a and then visualized. White dashed lines outline the cell body. Scale bar, 20 µm. Right panels, enlarged ROI. Scale bar, 2 µm. h SIM images of a migrasome from L929 cells stably expressing GFP-Rab8a and T4-mCherry. Scale bar, 500 nm. i Representative TEM images of the DAB staining pattern in migrasomes from L929-APEX2-GFP-Rab8a cells. Scale bar, 100 nm. j GFP-Rab8a- and T4-BFP-expressing L929 cells, treated with 10 μM BAPTA-AM for 10 h, were stained with Rab11 antibody and then visualized. Scale bar, 20 μm. Lower panels, enlarged ROI. Scale bar, 2 μm. Right panels, statistical analysis of the number of GFP-Rab8a and Rab11 puncta in migrasomes per cell. Data are means ± SEM. n > 100 cells from three independent experiments. Two-tailed unpaired t-test was used for statistical analyses. ***P < 0.001.
Fig. 2
Fig. 2. SNAREs mediate the fusion of intraluminal vesicles with the migrasome membrane.
a SIM images of L929 cells stably expressing GFP-VAMP2 and T4-mCherry. Scale bar, 200 nm. b TEM images of L929 cells stably expressing APEX2-GFP-VAMP2 and reacted with DAB. Scale bar, 200 nm. c L929 cells stably expressing GFP-VAMP2 and T4-BFP, treated with or without 10 μM BAPTA-AM for 10 h, were stained with VAMP3 antibody and then visualized. Scale bar, 20 μm. Lower panels, enlarged ROI. Scale bar, 2 µm. Right panels, statistical analysis of the number of GFP-VAMP2 and VAMP3 puncta in migrasomes per cell. Data are means ± SEM. n > 100 cells from three independent experiments. Two-tailed unpaired t-test was used for statistical analyses. ***P < 0.001. d, e Immunostaining of endogenous syntaxin4 (d) or SNAP23 (e) in L929-T4-mCherry cells. Scale bar, 20 µm. The right panels show enlarged migrasomes. Scale bar, 1 μm. f L929 cells were cultured in FN-precoated dishes for 10 h, and were then treated with Sulfo-NHS-SS-Biotin to biotinylated membrane proteins. Biotin-labeled membrane proteins were subsequently isolated from cell bodies or migrasomes using NeutrAvidin Agarose, respectively. Equal amounts of total protein from cell bodies (C) or migrasomes (M) were then subjected to western blot analysis. Integrin α5 (Itg α5) and PIGK were used as migrasome markers in L929 cells. Representative densitometry analysis of western blot gray values is shown. Three independent experiments were conducted. g Immunostaining of endogenous VAMP2 in wild-type (WT) or SNAP23 KD L929-T4-mCherry cells. Scale bar, 20 µm. Right panels, enlarged ROI. Scale bar, 2 µm. Statistical analysis of the number of VAMP2 puncta in migrasomes per cell is shown as the means ± SEM. n > 100 cells from three independent experiments were analyzed using the two-tailed unpaired t-test. ***P < 0.001. h L929 cells stably expressing GFP-VAMP2 were subjected to time-lapse imaging. Time-lapse images were acquired at intervals of 30 s. Scale bar, 2 µm. i Confocal images of L929 cells stably expressing VAMP2-pHluorin and T4-mCherry. Scale bar, 20 µm. The right panel shows statistical analysis of the fluorescence intensity ratio. Each point represents the migrasome (all the migrasomes from an individual cell)/cell body fluorescence intensity ratio. n > 100 cells from three independent experiments.
Fig. 3
Fig. 3. Myosin-5a is actively transported into the migrasome.
a Confocal images of L929 cells stably expressing Myosin-5a (Myo5a-GFP) and T4-mCherry. Scale bar, 20 µm. Lower panels, enlarged ROI. Scale bar, 2 µm. b Confocal images of L929-T4-mCherry cells stably expressing the indicated forms of Myo5a: full-length (FL), motor domain (M) and tail domain (T). Scale bar, 20 µm. Right panels, enlarged ROI. Scale bar, 2 µm. c APEX2-based TEM images of L929 cells stably expressing APEX2-mCherry-Myo5a. Scale bar, 2 µm. The lower panels show higher-magnification images of vesicles from the cell body (C), the base of a retraction fiber (B) and the migrasome (M). Scale bar, 200 nm. d Time-lapse images of L929 cells stably expressing GFP-Myo5a and T4-mCherry. Time interval, 90 s. Scale bar, 5 µm. e GI-SIM images of L929-GFP-Myo5a cells. Time-lapse images were acquired at intervals of 30 s. Scale bar, 5 µm. Right panels, enlarged ROI. Blue arrowheads indicate Myo5a transporting to the edge of the cell. White arrowheads indicate Myo5a moving into migrasomes. Red arrowheads indicate Myo5a accumulating at the edge of cell and left on retraction fibers. Scale bar, 2 µm.
Fig. 4
Fig. 4. Myosin-5a mediates transport of migrasome intraluminal vesicles.
a TEM images of WT, Myo5a OE and Myosin-5a knockout (Myo5a KO) L929 cells. Scale bar, 500 nm. The right panel shows statistical analysis of the number of small vesicles per migrasome. Data are means ± SEM for > 100 migrasomes from three independent experiments. Two-tailed unpaired t-test was used for statistical analyses. ***P < 0.001. b Immunostaining of endogenous Rab11 in WT, Myo5a OE and Myo5a KO L929-GFP-Rab8a cells. Scale bar, 20 μm. Lower panels, enlarged ROI. Scale bar, 2 μm. Right panels, statistical analysis of the number of GFP-Rab8a and Rab11 puncta in migrasomes per cell. Data are means ± SEM. n > 100 cells from three independent experiments. Two-tailed unpaired t-test was used for statistical analyses. ***P < 0.001. c Immunostaining of endogenous VAMP2 in WT, Myo5a OE and Myo5a KO L929 cells. Scale bar, 20 µm. Lower panels, enlarged ROI. Scale bar, 2 μm. Right panel, statistical analysis of the number of VAMP2 puncta in migrasomes per cell. Data are means ± SEM. n > 100 cells from three independent experiments. Two-tailed unpaired t-test was used for statistical analyses. ***P < 0.001. d Stable expression of T4-mCherry or mCherry-Myo5a was established in L929-GFP-VAMP7 cells. The cells were then subjected to confocal analysis. Scale bar, 20 µm. Right panels, enlarged ROI. Scale bar, 2 µm. Statistical analysis of the number of GFP-VAMP7 puncta in migrasomes per cell is shown as the means ± SEM. n > 100 cells from three independent experiments were analyzed using the two-tailed unpaired t-test (right panel). ***P < 0.001.
Fig. 5
Fig. 5. Cell migration causes the polarization of secretory carriers to the rear end of the cell.
a L929 cells stably expressing mCherry-Myo5a and T4-BFP, treated with or without 10 μM GLPG0187, were subjected to time-lapse imaging. Time interval, 10 min. Cyan dashed lines outline the cell body, and yellow dashed lines outline mCherry-Myo5a puncta. Scale bar, 20 μm. Polarization of mCherry-Myo5a was quantified and shown as the means ± SEM for triplicate samples of > 50 cells. Two-tailed unpaired t-test was used for statistical analyses (right panel). ***P < 0.001. b L929 cells stably expressing GFP-Rab8a and T4-BFP, treated with or without 10 μM GLPG0187, were subjected to time-lapse imaging. Time interval, 10 min. Cyan dashed lines outline the cell body, and yellow dashed lines outline GFP-Rab8a vesicles, respectively. Scale bar, 20 μm. Polarization of GFP-Rab8a was quantified and shown as the means ± SEM for triplicate samples of > 50 cells. Two-tailed unpaired t-test was used for statistical analyses (right panel). ***P < 0.001. c L929 cells stably expressing GFP-Rab11a, treated with or without 10 μM GLPG0187, were stained with wheat germ agglutinin (WGA) and then subjected to time-lapse imaging. Time interval, 10 min. Cyan dashed lines outline the cell body, and yellow dashed lines outline GFP-Rab11a vesicles, respectively. Scale bar, 20 μm. Polarization of GFP-Rab11a was quantified and shown as the means ± SEM for triplicate samples of > 50 cells. Two-tailed unpaired t-test was used for statistical analyses (right panel). ***P < 0.001.
Fig. 6
Fig. 6. Migrasomes are enriched with cytokines.
a, b L929-GFP-VAMP2 cells were stained with M-CSF (a) or CCL2 (b) antibody and then visualized. Scale bar, 20 μm. The right panels show enlarged migrasomes. Scale bar, 2 μm. c, d Immunostaining of endogenous M-CSF (c) or CCL2 (d) in WT, Myo5a OE and Myo5a KO L929 cells. Scale bar, 20 µm. Right panels, enlarged ROI. Scale bar, 2 µm. Statistical analysis of the number of M-CSF (c) and CCL2 (d) puncta in migrasomes per cell is shown as the means ± SEM. n > 100 cells from three independent experiments were analyzed using the two-tailed unpaired t-test (right panel). **P < 0.01, ***P < 0.001. e Migrasomes were purified from the indicated L929 cells. Cell lysates and migrasomes were normalized with total protein and subjected to western blot analysis using the indicated antibodies. PIGK was used as a migrasome marker in L929 cells. Representative densitometry analysis of western blot gray values is shown. Three independent experiments were conducted.
Fig. 7
Fig. 7. Migrasomes are the major sites of secretion in migrating cells.
a Secretion analysis of M-CSF and CCL2 in the indicated L929 cells. The concentrated media were collected and normalized with the numbers of cells, and were then subjected to western blot analysis using the indicated antibodies. Representative densitometry analysis of western blot gray values is shown. The ratios of secreted cytokines vs those in the cell body were quantified and shown as the means ± SEM from three independent experiments. Two-tailed unpaired t-test was used for statistical analyses (lower panels). **P < 0.01, ***P < 0.001. b, c L929 cells, either untreated or treated with 10 μM BAPTA-AM for 10 h, were stained with M-CSF (b) or CCL2 (c) antibody. Z-stack images were acquired by confocal microscopy, and z-projection was shown as the max intensity. Scale bar, 20 μm. The lower panels show statistical analysis of relative fluorescence intensity of control-cell body (C-C), control-migrasome (C-M), BAPTA-AM-cell body (B-C) and BAPTA-AM-migrasome (B-M). Data are means ± SEM. n > 100 cells from three independent experiments. Two-tailed unpaired t-test was used for statistical analyses. ***P < 0.001. d Diagram showing how migrasomes are involved in secretion in migrating cells.

References

    1. Ma, L. et al. Discovery of the migrasome, an organelle mediating release of cytoplasmic contents during cell migration. Cell Res.25, 24–38 (2015). 10.1038/cr.2014.135 - DOI - PMC - PubMed
    1. Jiang, D. et al. Migrasomes provide regional cues for organ morphogenesis during zebrafish gastrulation. Nat. Cell Biol.21, 966–977 (2019). 10.1038/s41556-019-0358-6 - DOI - PubMed
    1. Zhang, C. et al. Monocytes deposit migrasomes to promote embryonic angiogenesis. Nat. Cell Biol.24, 1726–1738 (2022). 10.1038/s41556-022-01026-3 - DOI - PubMed
    1. Blobel, G. et al. Translocation of proteins across membranes: the signal hypothesis and beyond. Symp. Soc. Exp. Biol.33, 9–36 (1979). - PubMed
    1. Jackson, R. C. & Blobel, G. Post-translational processing of full-length presecretory proteins with canine pancreatic signal peptidase. Ann. N. Y. Acad. Sci.343, 391–404 (1980). 10.1111/j.1749-6632.1980.tb47268.x - DOI - PubMed

LinkOut - more resources