. 2024 Jun 25;7(1):167.
doi: 10.1038/s41746-024-01170-0.

Artificial intelligence-enhanced electrocardiography derived body mass index as a predictor of future cardiometabolic disease

Affiliations

Artificial intelligence-enhanced electrocardiography derived body mass index as a predictor of future cardiometabolic disease

Libor Pastika et al. NPJ Digit Med. .

Abstract

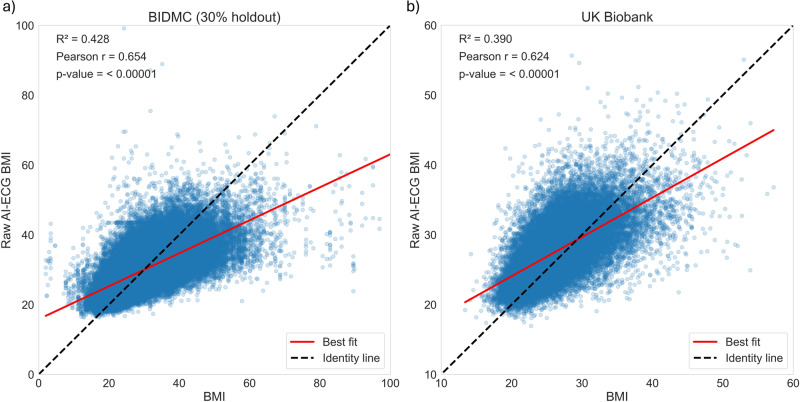
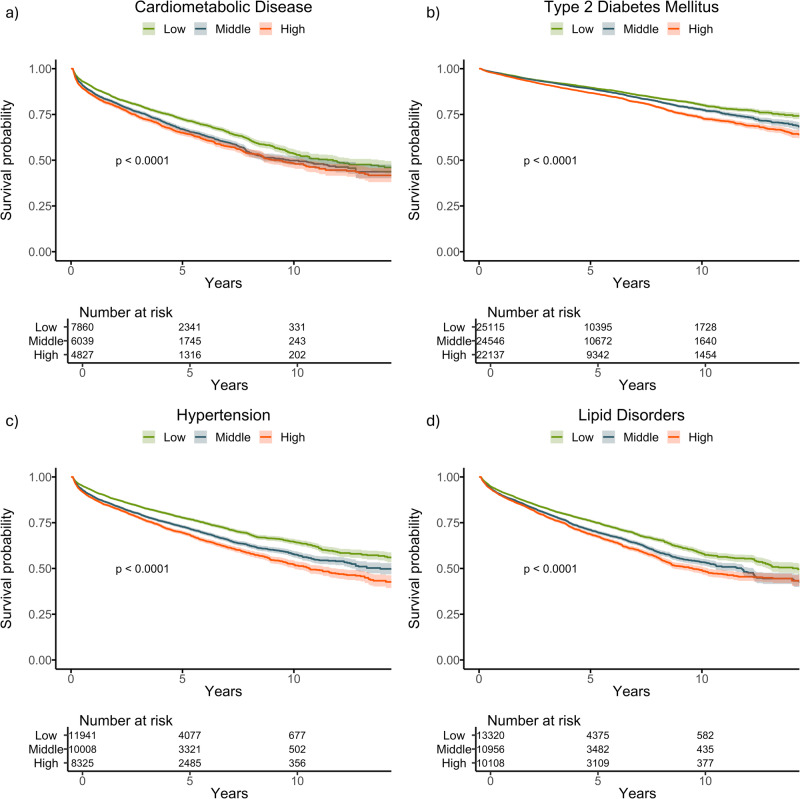
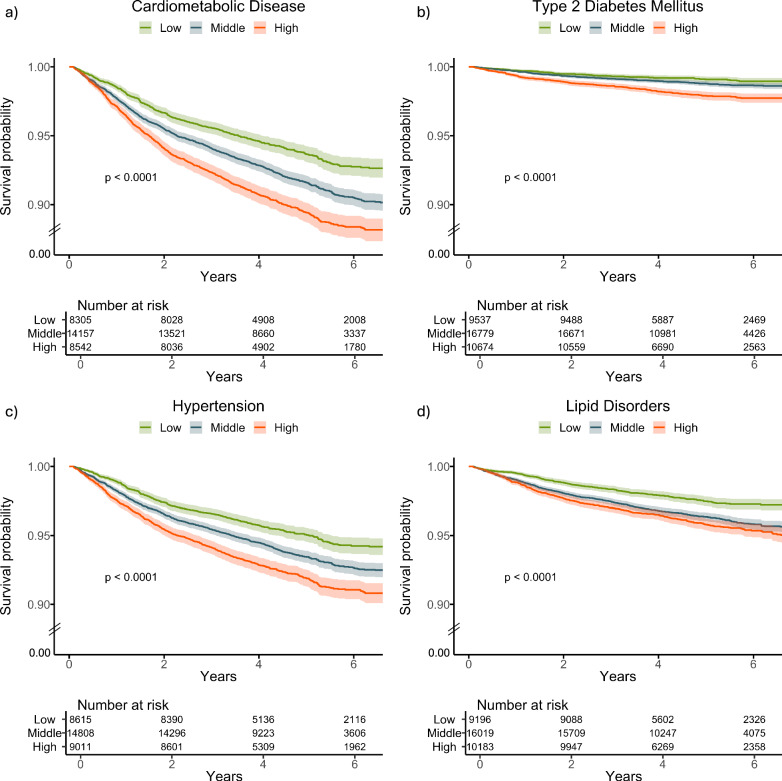
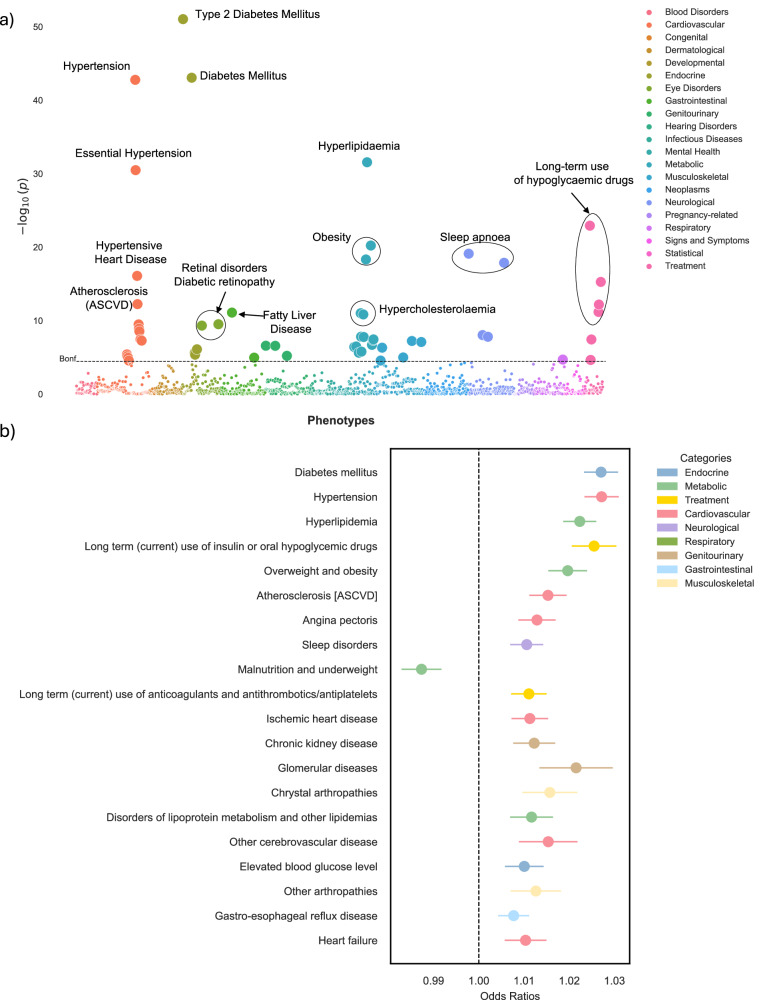
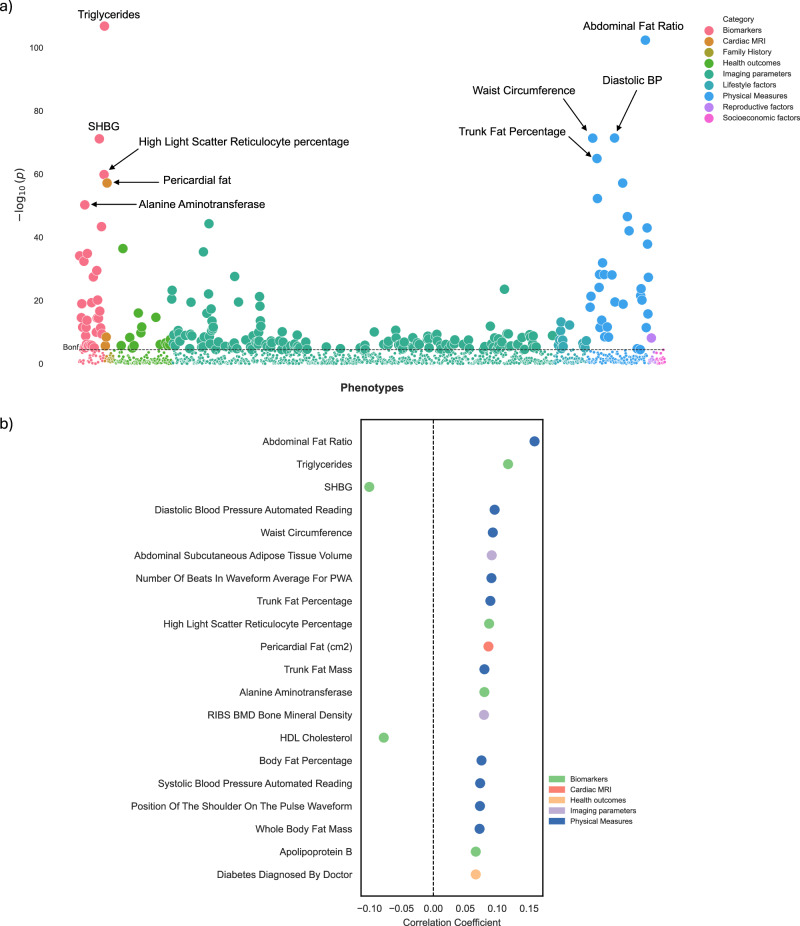
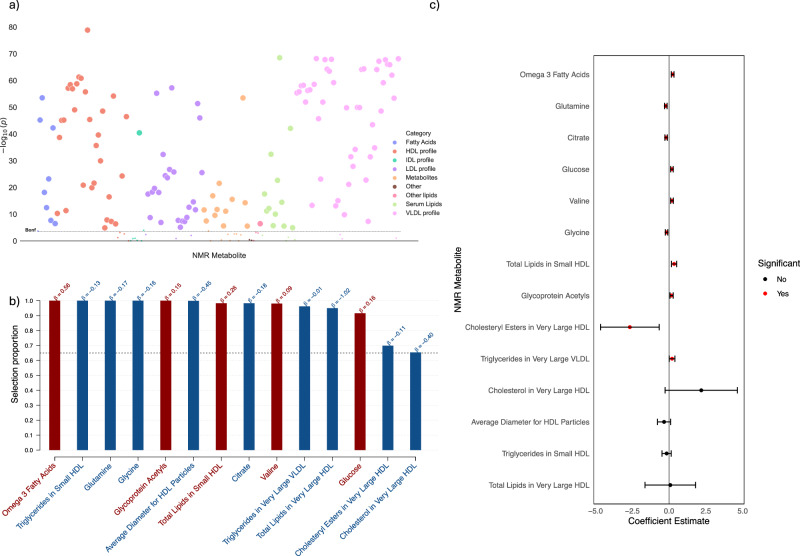
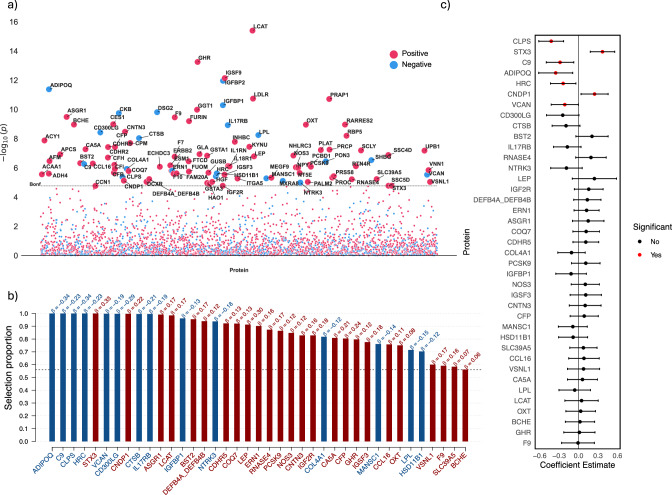
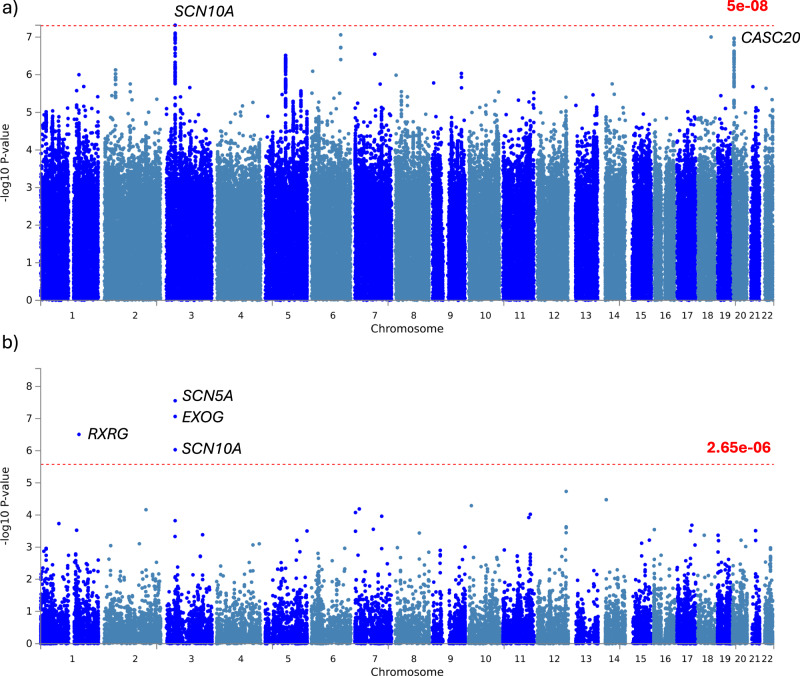
The electrocardiogram (ECG) can capture obesity-related cardiac changes. Artificial intelligence-enhanced ECG (AI-ECG) can identify subclinical disease. We trained an AI-ECG model to predict body mass index (BMI) from the ECG alone. Developed from 512,950 12-lead ECGs from the Beth Israel Deaconess Medical Center (BIDMC), a secondary care cohort, and validated on UK Biobank (UKB) (n = 42,386), the model achieved a Pearson correlation coefficient (r) of 0.65 and 0.62, and an R2 of 0.43 and 0.39 in the BIDMC cohort and UK Biobank, respectively for AI-ECG BMI vs. measured BMI. We found delta-BMI, the difference between measured BMI and AI-ECG-predicted BMI (AI-ECG-BMI), to be a biomarker of cardiometabolic health. The top tertile of delta-BMI showed increased risk of future cardiometabolic disease (BIDMC: HR 1.15, p < 0.001; UKB: HR 1.58, p < 0.001) and diabetes mellitus (BIDMC: HR 1.25, p < 0.001; UKB: HR 2.28, p < 0.001) after adjusting for covariates including measured BMI. Significant enhancements in model fit, reclassification and improvements in discriminatory power were observed with the inclusion of delta-BMI in both cohorts. Phenotypic profiling highlighted associations between delta-BMI and cardiometabolic diseases, anthropometric measures of truncal obesity, and pericardial fat mass. Metabolic and proteomic profiling associates delta-BMI positively with valine, lipids in small HDL, syntaxin-3, and carnosine dipeptidase 1, and inversely with glutamine, glycine, colipase, and adiponectin. A genome-wide association study revealed associations with regulators of cardiovascular/metabolic traits, including SCN10A, SCN5A, EXOG and RXRG. In summary, our AI-ECG-BMI model accurately predicts BMI and introduces delta-BMI as a non-invasive biomarker for cardiometabolic risk stratification.


Conflict of interest statement

The authors declare no competing non-financial interests, but the following competing financial interests: J.W.W. was previously on the advisory board for Heartcor solutions LLC and previously received research support from Anumana, J.S.W. has consulted for MyoKardia, Inc., Pfizer, Foresite Labs, and Health Lumen, and receives research support from Bristol Myers-Squibb. The remaining authors declare no Competing Financial Interests.

Figures

Fig. 1
Fig. 1. Association between AI-ECG BMI predictions and measured BMI in the BIDMC and UK Biobank cohorts.
Scatter plots depicting the association between raw AI-ECG-BMI predictions and measured BMI within (a) the 30% holdout BIDMC and (b) UK Biobank cohorts. The black identity line serves as a reference point, representing the ideal prediction scenario. The red line represents the best-fit line. The R2 (Pearson correlation) was 0.43 (r = 0.65) in the 30% holdout BIDMC, and 0.39 (r = 0.62) in the UK Biobank cohort.
Fig. 2
Fig. 2. Kaplan–Meier survival curves stratified by delta-BMI curves for future cardiometabolic outcomes in the BIDMC cohort.
Kaplan–Meier survival curves stratified by tertiles of delta-BMI in the BIDMC Cohort: Subplots ad depict survival curves for cardiometabolic disease, type 2 diabetes mellitus, hypertension, and lipid disorders, respectively. Patients are stratified into tertiles based on delta-BMI, providing insights into the differential risk of each outcome. Log-rank p-values are reported for each outcome, highlighting statistically significant differences in survival across delta-BMI tertiles. Tertile cut-offs for delta-BMI are defined as follows: Bottom (delta-BMI ≤ −3.74), Middle (−3.74 to 2.44), and Top (>2.44).
Fig. 3
Fig. 3. Kaplan–Meier survival curves stratified by delta-BMI curves for future cardiometabolic outcomes in the UK Biobank.
Kaplan–Meier survival curves stratified by tertiles of delta-BMI in the UK Biobank Cohort: Subplots ad depict survival curves for cardiometabolic disease, type 2 diabetes mellitus, hypertension, and lipid disorders, respectively. Patients are stratified into tertiles based on delta-BMI, providing insights into the differential risk of each outcome. Log-rank p-values are reported for each outcome, highlighting statistically significant differences in survival across delta-BMI tertiles. Tertile cut-offs for delta-BMI are defined as follows: Bottom (delta-BMI ≤ 3.74), Middle (−3.74 to 2.44), and Top (>2.44). To enhance clarity, the lower limit of the y-axis has been adjusted to 0.90, indicated by the break lines between 0.90 and 0.
Fig. 4
Fig. 4. Phenome-wide association study (PheWAS) of delta-BMI in the BIDMC cohort.
Exploration of the underlying biology through a phenome-wide association study (PheWAS) in the BIDMC cohort: a A PheWAS Manhattan plot showing the negative logarithm of the univariate logistic regression p-values between delta-BMI and disease phecodes, adjusted for measured BMI, sex, age, and age2. The dashed horizontal line signifies the Bonferroni corrected threshold for multiple comparisons. Out of 1408 comparisons, 55 (3.9%) reached significance based on the Bonferroni correction. An interactive version of the plots can be accessed in the Online Supplement. b Illustrates the top 20 significant phecodes associated with delta-BMI, presenting their respective odds ratios with 95% CI. ASCVD atherosclerotic cardiovascular disease.
Fig. 5
Fig. 5. Phenome-wide association study (PheWAS) of delta-BMI in the UK Biobank.
Exploration of the underlying biology through a phenome-wide association study (PheWAS) in the UK Biobank using clinical phenotypes: a A PheWAS Manhattan plot showing the negative logarithm of the univariate correlation p-values between delta-BMI and routinely recorded clinical features, adjusted for measured BMI, sex, age, and age2. The dashed horizontal line signifies the Bonferroni corrected threshold for multiple comparisons. Out of 1368 comparisons, 231 (16.9%) reached significance based on the Bonferroni correction, most of which came from imaging parameters, physical measures, and biomarkers. An interactive version of the plots can be accessed in the Online Supplement. b Illustrates the top 20 significant clinical phenotypes correlated with delta-BMI, presenting their respective correlation coefficients (Pearson). SHBG Sex Hormone Binding Globulin, PWA Pulse Wave Analysis, BP Blood Pressure, BMD Bone Mineral Density, HDL High-Density Lipoprotein.
Fig. 6
Fig. 6. Metabolomic analysis of delta-BMI variability.
Exploration of the underlying biology of delta-BMI variability using the UK Biobank NMR metabolomic data: a A metabolome-wide association study (MWAS) Manhattan plot showing the negative logarithm of the univariate correlation p-values between delta-BMI and the concentrations of NMR metabolites, adjusted for BMI, sex, age, and age2. Out of 168 comparisons, 136 (80.1%) reached significance based on the Bonferroni correction. An interactive version of the plots can be accessed in the Online Supplement. b Stability selection analysis employing LASSO regression on significant MWAS metabolites: This analysis, conducted over 1000 iterations with 80% subsampling, identifies robust metabolite associations with delta-BMI. Adjustments were made for measured BMI, sex, age, and age2. The black dashed line represents the calibrated selection proportion. c Multivariate linear regression analysis of stably selected metabolites against delta-BMI, adjusted for measured BMI, sex, age, and age2, demonstrating the individual contribution of stably selected metabolites to variations in delta-BMI.
Fig. 7
Fig. 7. Proteomic analysis of delta-BMI variability.
Exploration of the underlying biology of delta-BMI variability using the UK Biobank PPP data: a A protein-wide association study (PWAS) Manhattan plot showing the negative logarithm of the univariate correlation p-values between delta-BMI and the concentration of proteins, adjusted for measured BMI, sex, age, and age2. Of the 2919 proteins analysed, 100 (3.4%) surpassed the Bonferroni-corrected significance threshold. An interactive version of the plots can be accessed in the Online Supplement. b Stability selection analysis employing LASSO regression on significant PWAS proteins: This analysis, conducted over 1000 iterations with 80% subsampling, identifies robust protein associations with delta-BMI. Adjustments were made for measured BMI, sex, age, and age2. The black dashed line represents the calibrated selection proportion. c Multivariate linear regression analysis of stably selected proteins against delta-BMI, adjusted for measured BMI, sex, age, and age2, demonstrating the individual contribution of stably selected proteins to variations in delta-BMI.
Fig. 8
Fig. 8. Genome-wide association study (GWAS) of delta-BMI variability.
Exploration of the underlying biology of delta-BMI variability through a genome-wide association study (GWAS): GWAS Manhattan plots of genomic loci associated with delta-BMI. a Highlights the nearest genes associated with single nucleotide polymorphisms (SNP), with the red line depicting the genome-wide significant threshold (P < 5 ×10⁻⁸). b Displays a Manhattan plot derived from the gene-based test using MAGMA, mapping input SNPs to 18,882 protein-coding genes; the red line represents the genome-wide significant threshold (P < 2.65 ×10⁻⁶). SCN10A sodium voltage-gated channel alpha subunit 10, CASC20 cancer susceptibility 20, RXRG retinoid X receptor gamma, SCN5A sodium voltage-gated channel alpha subunit 10, EXOG exo/endonuclease G.
Fig. 9
Fig. 9. Explainable AI in ECG morphology.
Explainable ECG morphology: An XGBoost model was trained using variational autoencoder-derived latent factors to estimate the AI-ECG-derived BMI predictions. a Depicts a beeswarm plot of the 20 most influential latent factors, ordered by their feature importance derived from the SHAP (SHapley Additive exPlanations) values. Each dot represents a SHAP value for a specific latent factor, providing insight into the significance of these latent factors and the direction of their impact on the AI-ECG BMI predictions. For example, for latent factor 50, lower values of the latent factor (in blue) indicate a positive impact on the AI-ECG BMI estimation, resulting in higher BMI predictions, while higher feature values (in red) indicate a negative impact on the AI-ECG BMI estimation, resulting in lower BMI predictions. b Illustrates the latent traversals of the top 5 latent features and their impact on the ECG morphology. ECG morphologies corresponding with high and low AI-ECG BMI predictions are represented in red and blue, respectively. Subplots c and d show correlation heatmaps between ECG parameters and the VAE-derived latent factors for the BIDMC and UK Biobank cohorts, respectively.

References

    1. Jaacks LM, et al. The obesity transition: stages of the global epidemic. Lancet Diabetes Endocrinol. 2019;7:231–240. doi: 10.1016/S2213-8587(19)30026-9. - DOI - PMC - PubMed
    1. Miranda JJ, et al. Understanding the rise of cardiometabolic diseases in low- and middle-income countries. Nat. Med. 2019;25:1667–1679. doi: 10.1038/s41591-019-0644-7. - DOI - PubMed
    1. Shuster A, Patlas M, Pinthus JH, Mourtzakis M. The clinical importance of visceral adiposity: a critical review of methods for visceral adipose tissue analysis. Br. J. Radio. 2012;85:1–10. doi: 10.1259/bjr/38447238. - DOI - PMC - PubMed
    1. Nuttall FQ. Body Mass Index: Obesity, BMI, and Health: A Critical Review. Nutr. Today. 2015;50:117–128. doi: 10.1097/NT.0000000000000092. - DOI - PMC - PubMed
    1. Elffers TW, et al. Body fat distribution, in particular visceral fat, is associated with cardiometabolic risk factors in obese women. PLoS One. 2017;12:e0185403. doi: 10.1371/journal.pone.0185403. - DOI - PMC - PubMed