. 2024 Jul;10(7):1126-1143.
doi: 10.1038/s41477-024-01725-9. Epub 2024 Jun 25.

Parallel degradome-seq and DMS-MaPseq substantially revise the miRNA biogenesis atlas in Arabidopsis

Affiliations

Parallel degradome-seq and DMS-MaPseq substantially revise the miRNA biogenesis atlas in Arabidopsis

Xingxing Yan et al. Nat Plants. 2024 Jul.

Abstract

MicroRNAs (miRNAs) are produced from highly structured primary transcripts (pri-miRNAs) and regulate numerous biological processes in eukaryotes. Due to the extreme heterogeneity of these structures, the initial processing sites of plant pri-miRNAs and the structural rules that determine their processing have been predicted for many miRNAs but remain elusive for others. Here we used semi-active DCL1 mutants and advanced degradome-sequencing strategies to accurately identify the initial processing sites for 147 of 326 previously annotated Arabidopsis miRNAs and to illustrate their associated pri-miRNA cleavage patterns. Elucidating the in vivo RNA secondary structures of 73 pri-miRNAs revealed that about 95% of them differ from in silico predictions, and that the revised structures offer clearer interpretation of the processing sites and patterns. Finally, DCL1 partners Serrate and HYL1 could synergistically and independently impact processing patterns and in vivo RNA secondary structures of pri-miRNAs. Together, our work sheds light on the precise processing mechanisms of plant pri-miRNAs.


Figures

Extended Data Fig. 1 ∣
Extended Data Fig. 1 ∣. Quality control of DMS-MaPseq library and overall patterns of DMS-MaPseq signals cross pri-miRNA backbones.
(a) Average mismatch ratios of A/C/G/U caused by DMS reactivities in Col-0, dcl1-9, hyl1-2 and se-1. The data are from 67 commonly detected pri-miRNAs from three biological replicates for Col-0, dcl1-9 and hyl1-2, but two biological replicates for se-1. P (dcl1-9 vs Col-0) = 0.132, P (hyl1-2 vs Col-0) = 0.06494, P (se-1 vs Col-0) = 0.1714. P value by Wilcoxon test. (b) Boxplots show the DMS reactivities for 16 SBTL (left panel) and 12 SLTB (right panel) pri-miRNAs around base/top and duplex regions in Col-0, from three biological replicates. In both top and bottom panels, position ‘0’ is defined as the first nucleotides of duplex region, the purple and yellow arrowheads labeled in the pri-miRNA cartoon represent the first cleavage sites. The blue and pink regions represent miRNA/* duplex. Centres of the boxes represent the median values. Upper bound and lower bound show the first and the third quartiles respectively. Whiskers indicate data within 1.5× the interquartile range of both quartiles. Data points at the ends of whiskers represent outliers. (c) Pri-miR156a, pri-miR168a, pri-miR844a and pri-miR856a show identical structures in DRS (right) compared to RPS (left). Black and gray arrows indicated first cutting sites for BTL and LTB directions, respectively. RPS: RNAfold Predicted Structures. DRS: DMS Reactivity based Structures.
Extended Data Fig. 2 ∣
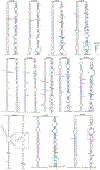
Extended Data Fig. 2 ∣. Pri-miR156c, d, pri-miR157a, pri-miR158a, pri-miR159a, b, pri-miR161, pri-miR162a, b, pri-miR163, and pri-miR164a, c show structural differences in DRS (right) compared to RPS (left).
Black and gray arrows indicated first cutting sites for BTL and LTB directions, respectively. RPS: RNAfold Predicted Structures. DRS: DMS Reactivity based Structures. Blue dotted boxes indicated structural differences in DRS.
Extended Data Fig. 3 ∣
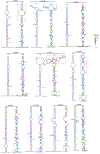
Extended Data Fig. 3 ∣. Pri-miR165a, b, pri-miR166a, e, f, and pri-miR167a-d show structural differences in DRS (right) compared to RPS (left).
Black and gray arrows indicated first cutting sites for BTL and LTB directions, respectively. RPS: RNAfold Predicted Structures. DRS: DMS Reactivity based Structures. Blue dotted boxes indicated structural differences in DRS.
Extended Data Fig. 4 ∣
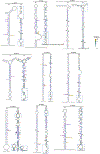
Extended Data Fig. 4 ∣. Pri-miR168b, pri-miR169a, d, and pri-miR171a-c show structural differences in DRS (right) compared to RPS (left).
Black and gray arrows indicated first cutting sites for BTL and LTB directions, respectively. RPS: RNAfold Predicted Structures. DRS: DMS Reactivity based Structures. Blue dotted boxes indicated structural differences in DRS.
Extended Data Fig. 5 ∣
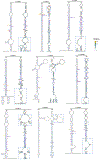
Extended Data Fig. 5 ∣. Pri-miR172a-e, pri-miR319a, b, pri-miR390a, b and pri-miR391 show structural differences in DRS (right) compared to RPS (left).
Black and gray arrows indicated first cutting sites for BTL and LTB directions, respectively. RPS: RNAfold Predicted Structures. DRS: DMS Reactivity based Structures. Blue dotted boxes indicated structural differences in DRS.
Extended Data Fig. 6 ∣
Extended Data Fig. 6 ∣. Pri-miR393a, pri-miR394b, pri-miR395c, f, pri-miR396a, b, pri-miR397a, pri-miR398b, c and pri-miR400 show structural differences in DRS (right) compared to RPS (left).
Black and gray arrows indicated first cutting sites for BTL and LTB directions, respectively. RPS: RNAfold Predicted Structures. DRS: DMS Reactivity based Structures. Blue dotted boxes indicated structural differences in DRS.
Extended Data Fig. 7 ∣
Extended Data Fig. 7 ∣. Pri-miR403, pri-miR408, pri-miR447b, pri-miR771a, pri-miR779a, pri-miR780a, pri-miR781a, pri-miR823a and pri-miR825a show structural differences in DRS (right) compared to RPS (left).
Black and gray arrows indicated first cutting sites for BTL and LTB directions, respectively. RPS: RNAfold Predicted Structures. DRS: DMS Reactivity based Structures. Blue dotted boxes indicated structural differences in DRS.
Extended Data Fig. 8 ∣
Extended Data Fig. 8 ∣. Pri-miR828a, pri-miR833a, pri-miR849a, pri-miR851a, pri-miR853a, pri-miR1888b, pri-miR2112, pri-miR3434 and pri-miR4245 show structural differences in DRS (right) compared to RPS (left).
Black and gray arrows indicated first cutting sites for BTL and LTB directions, respectively. RPS: RNAfold Predicted Structures. DRS: DMS Reactivity based Structures. Blue dotted boxes indicated structural differences in DRS.
Extended Data Fig. 9 ∣
Extended Data Fig. 9 ∣. In vivo RSS of pri-miRNAs can better explain the first cleavage sites than in silico predicted structures.
(a) Barchart shows around 5% additional BTL-typed pri-miRNAs have internal loops/bulges that are 9-11 nt and 15-17 nt away from the first cleavage sites obtained in DRS vs RPS. (b) Barchart shows around 13% additional LTB-typed pri-miRNAs have internal loops/bulges that are 9-11 nt and 15-17 nt away from the first cleavage sites obtained In DRS vs RPS. (c) Venn diagram shows that both BTL- and LTB-typed pri-miRNAs concurrently present internal loops/bulges that are ~9-11 nt and ~15-17 nt away from the first cutting sites. RPS: RNAfold Predicted Structures. DRS: DMS Reactivity based Structures.
Extended Data Fig. 10 ∣
Extended Data Fig. 10 ∣. DCL1, SE and HYL1 impact RSS of pri-miRNAs.
(a) Gini index of 67 common pri-miRNAs in Col-0, dcl1-9, hyl1-2 and se-1. P value by Wilcoxon test. The data are from three biological replicates for Col-0, dcl1-9 and hyl1-2, but two biological replicates for se-1. P (dcl1-9 vs Col-0) = 0.43, P (hyl1-2 vs Col-0) = 0.073, P (se-1 vs Col-0) = 0.0015. P value by Wilcoxon test. Centres of the boxes represent the median values. Upper bound and lower bound show the first and the third quartiles respectively. Whiskers indicate data within 1.5× the interquartile range of both quartiles. (b-d) Examples of SBTL-processed pri-miR447b (b), SLTB-processed pri-miR319a (c) and bidirectional-processed pri-miR166a (d) that show structural difference of pri-miRNAs in dcl1-9, hyl1-2 and se-1 compared to Col-0. Dotted boxes indicated structural differences in mutants. (e) Re-design of a known amiR backbone from pri-miR159a. An existing amiR backbone of pri-miR159a (top panel). Re-designing of the amiR backbone of pri-miR159a (bottom panel). amiR sequence is labelled with purple.
Fig. 1 ∣
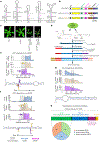
Fig. 1 ∣. Identification of bona fide pri-miRNAs by degradome-seq of semi-active DCL1 mutants in Arabidopsis.
a, Five processing patterns of pri-miRNAs: BTL, SBTL, LTB, SLTB and bidirectional processing. In each case, DCL1 initially cleaves pri-miRNAs at a site that is ~15–17 nt away from a reference ssRNA–dsRNA junction (15–17-nt molecular ruler). The blue and pink regions in the pri-miRNA diagrams represent miRNA/* duplexes. Black arrowheads and text in the cartoon indicate the cleavage direction from base to loop, while grey arrowheads and text represent the cleavage pattern from loop to base. b, The domain arrangement of DCL1 (WT) and point alterations in semi-active DCL1 mutants (E1507Q and E1696Q). The nuclear localization signal (NLS), helicase domain, DUF283, Platform, PAZ, RNase III a and III b, and dsRNA-binding domain (dsRBD) are shown in black, yellow, green, pink, dark orange, yellow-brown, purple and blue, respectively. c, Phenotypes of three-week-old Col-0, dcl1-9+/− and transgenic dcl1-9+/−;PDCL1–FM–DCL1E1507Q and dcl1-9+/−;PDCL1–FM–DCL1E1696Q plants. Scale bars, 1 cm. d, Scheme for construction of the degradome-seq libraries. RT, reverse transcription. eg, Exemplified cleavage patterns of DCL1-dependent pri-miR864 (BTL direction) (e), DCL1-dependent pri-miR162a (LTB direction) (f) and DCL1-independent sRNA5630a (g). The yellow-brown and purple arrows represent RNase III a and III b cleavage sites, respectively. The percentages indicate the relative cutting ratios. Note that the previously claimed pri-miR5630a does not have a clear cleavage site by DCL1 in the WT or the DCL1E1507Q and DCL1E1696Q lines. h, The fraction of pri-miRNAs that have been verified to be DCL1 dependent. The total number of Arabidopsis pri-miRNAs is taken from miRBase Release 22.1. Note that only 147 of the 326 previously annotated pri-miRNAs are bona fide miRNAs on the basis of the cleavage activity of DCL1. The processing patterns for 35% of the true pri-miRNAs could be re-validated, whereas the other 30% display processing patterns deviating from the published literature and have now been re-annotated. Additionally, the processing patterns of the other 35% of pri-miRNAs were newly identified here.
Fig. 2 ∣
Fig. 2 ∣. Degradome-seq reveals that 37, 16, 38, 13 and 43 pri-miRNAs display the BTL, SBTL, LTB, SLTB and bidirectional processing patterns, respectively.
a, Pri-miR167a is 1 of 21 examples whose canonical BTL processing patterns are fully validated here. b, Pri-miR173 is one of three examples whose processing patterns are re-annotated here. The cleavage site marked with an asterisk was also discovered in fiery1 (ref. 14). c, Pri-miR780a is 1 of 13 examples whose processing patterns are newly identified. d, Pri-miR169j is 1 of 13 examples whose canonical SBTL processing patterns are fully validated here. e, Pri-miR823 is one of three newly identified examples following the SBTL processing pattern. f, Pri-miR160a is 1 of 13 examples whose canonical LTB processing patterns are fully validated here. g, Pri-miR395d is one of five examples that are revised to be processed through LTB. h, Pri-miR4245 is 1 of 20 examples whose processing patterns are newly identified to follow the LTB direction. i, Pri-miR159a is one of five examples whose canonical SLTB processing patterns are fully validated here. j, Pri-miR839a is one of eight newly identified examples following the SLTB pattern. k, Pri-miR166a is 1 of 24 canonical pri-miRNAs with bidirectional processing patterns. l, Pri-miR396a is one example of five re-annotated bidirectional pri-miRNAs with new productive and abortive products. m, Pri-miR825 is one example of 14 re-annotated bidirectional pri-miRNAs with new productive products. It can follow BTL processing to produce a non-canonical but abundant pair of miRNA/* (5p-2/3p-2) besides the previously reported LTB pattern that produces canonical miR825/* (5p-1/3p-1). The cleavage site marked with an asterisk was also discovered in the WT. In am, the percentages indicate the relative ratios of cleavage sites of individual pri-miRNAs by two semi-active DCL1 variants. Black dotted arrows denote the intended cutting positions that are not detectable in our system. Thicker arrows indicate higher cutting ratios. The pri-miRNA names in orange, blue and green indicate re-validated, re-annotated and newly identified ones, respectively. The five patterns (BTL, SBTL, LTB, SLTB and bidirectional) are summarized in the middle.
Fig. 3 ∣
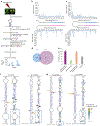
Fig. 3 ∣. SE and HYL1 show different impacts on pri-miRNA processing.
a,b, Distributions of the first cleavage sites for 72 BTL-processed (a) and 46 LTB-processed (b) pri-miRNAs in Col-0 (blue), DCL1E1507Q (purple), DCL1E1696Q (yellow-brown), hyl1-2 (green) and se-2 (orange). The positions labelled ‘0’ are defined as the first cutting sites detected in the DCL1E1507Q and DCL1E1696Q transgenic lines in the top and bottom panels and shown by the purple and yellow arrowheads, respectively, in the pri-miRNA diagrams. The blue and pink regions in the pri-miRNA diagrams represent the miRNA/* duplex. The data are from two biological replicates for each sample. c, The numbers (top) and processing patterns (bottom) of pri-miRNAs that are impacted by SE and/or HYL1 proteins. Note that only the first cutting sites of BTL patterns are indicated by black arrowheads. d, Venn diagram showing overlapping of miRNAs that are dependent on or independent of SE and HYL1. e, List of 11 pri-miRNAs for which SE and HYL1 exert opposite impacts on their processing.
Fig. 4 ∣
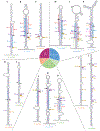
Fig. 4 ∣. DMS-MaPseq reveals bona fide RSS of pri-miRNAs in vivo.
a, Schematic illustration of DMS-MaPseq to detect RSS of pri-miRNAs. GSP, gene-specific primers. b,c, The DMS reactivities on basal segments, lower stems and duplex regions of BTL-processed pri-miRNAs (b) and on terminal loops, upper stems and duplex regions of LTB-processed pri-miRNAs (c) in Col-0. Positions labelled ‘0’ are defined as the first cutting sites in DCL1E1507Q and DCL1E1696Q transgenic lines in the top and bottom panels and are indicated by purple and yellow arrowheads, respectively, in the pri-miRNA diagrams. The blue and pink regions represent the miRNA/* duplex. The data are from three biological replicates. The central lines in the boxes represent the median values, the upper and lower bounds show the first and third quartiles, the whiskers indicate data within 1.5× the interquartile range of both quartiles, and points past the ends of the whiskers represent outliers. d, Venn diagram showing the overlap between DMS-reactivity-based structures (DRS) and RNAfold-predicted structures (RPS). e, Pri-miRNAs with different structures in vivo and in silico are further divided into four categories on the basis of detailed structure differences. f,g, BTL-processed pri-miR170 and pri-miR397b (f) and LTB-processed pri-miR160a and pri-miR160c (g) are four representative examples of the 69 pri-miRNAs that show different structures between in vivo DMS-reactivity-based modelling (right) and in silico modelling (left). The annotated miRNA/* regions are shaded with the outlines in blue and pink. The black dotted arrow denotes an intended cutting position that was not detectable in our system. The black and grey arrows indicate the first cleavage sites for BTL- and LTB-patterned pri-miRNAs, respectively. The structural differences are highlighted in the blue dashed boxes. The residues with the top 5%, 25% and 70% DMS activities are labelled with red, yellow and cyan backgrounds, respectively. The remaining residues with mismatch ratios below 0.01% are labelled with a white background. Guanines (G) and uracils (U) are marked with a grey background.
Fig. 5 ∣
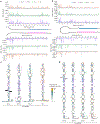
Fig. 5 ∣. DRS provides more meaningful interpretation for determination of the initial cleavages of pri-miRNAs than RPS.
a, Profiling of distances from the reference dsRNA–ssRNA junction sites derived from both RNAfold and DMS-MaPseq to the first cleavage sites revealed that ~15–17 nt is the predominant molecular ruler length for BTL-processed (left) and LTB-processed (right) pri-miRNAs. b, Pri-miR397a (left) and pri-miR851a (right) are two representative BTL-type examples that have more optimal distances for DCL1 processing between the internal reference regions and the first cleavage sites (black arrows) detected in DRS (right) than predicted from RPS (left). The black and grey brackets show 15–17-nt and 9–11-nt lengths from the reference loops, shown in black and grey dashed boxes, to the first cutting sites, respectively. c, Pri-miR390b (left) and pri-miR4245 (right) are two representative LTB-type examples that have more optimal distances for DCL1 processing between the internal reference regions and the first cleavage sites (grey arrows) detected in DRS (right) than predicted from RPS (left). The black dotted arrow denotes an intended cutting position that was not detectable in our system. d, Both RNAfold and DMS-MaPseq showed that pri-miRNAs typically harboured extra internal loops or bulges positioned approximately 9–11 nt away from their initial cleavage sites for BTL-processed (top) and LTB-processed (bottom) pri-miRNAs. e, Reanalysis of the cryogenic electron microscopy density map of the DCL1–pri-miR166f complex from published data suggests the presence of new binding pockets for additional internal loops/bulges that might be 9–11 nt away from the first cleavage sites (black arrowhead). Dark blue represents positively charged surfaces of DCL1. The blue lines indicate three different bulges in the lower stem of pri-miR166f. The colour scheme for the different domains of DCL1 is the same as in Fig. 1b. f, Parallel DMS-MaPseq and degradome-seq analyses show that the first cleavage sites are predominantly located at the unpaired regions for BTL-processed pri-miRNAs, whereas the pattern is less pronounced for LTB-typed pri-miRNAs. Solid and hollow circles represent paired and unpaired nucleotides, respectively. Solid blue and pink circles represent the partial miRNA/* duplex.
Fig. 6 ∣
Fig. 6 ∣. DCL1, SE and HYL1 maintain the proper pri-miRNA secondary structures for processing.
a,b, DMS reactivities on the basal segments, lower stem and duplex regions for BTL-processed pri-miRNAs (a) and on the terminal loops, upper stem and duplex regions for LTB-processed pri-miRNAs (b) in Col-0 (blue), dcl1-9 (purple), hyl1-2 (green) and se-1 (orange). Positions labelled ‘0’ are defined as the first cutting sites in DCL1E1507Q and DCL1E1696Q transgenic lines in the top and bottom panels and are shown by the purple and yellow arrowheads, respectively, in the pri-miRNA diagrams. The blue and pink regions in the pri-miRNA diagrams represent the miRNA/* duplex. The data are from 67 commonly detected pri-miRNAs from 3 biological replicates for Col-0, dcl1-9 and hyl1-2, but 2 biological replicates for se-1. The central lines in the boxes represent the median values, the upper and lower bounds show the first and third quartiles, and the whiskers indicate data within 1.5× the interquartile range of both quartiles. c,d, Pri-miR395f (c) and pri-miR156a (d) are two examples of BTL-processed and LTB-processed pri-miRNAs, respectively, that show different RSS in dcl1-9, hyl1-2 and se-1 compared with Col-0. The dashed boxes indicate structural differences in the mutants.
Fig. 7 ∣
Fig. 7 ∣. Atlas of miRNA biogenesis in Arabidopsis drawn from degradome-seq and DMS-MaPseq.
a, Degradome-seq identified 147 bona fide pri-miRNAs from 326 previously annotated pri-miRNAs, and reclassified them into 5 processing patterns, namely, BTL, SBTL, LTB, SLTB and bidirectional processing. b, Ninety-five percent of in vivo RSS for pri-miRNAs, derived from our DMS-MaPseq (DRS), were different from RNAfold-predicted structures (RPS). The DRS better explains why DCL1 selects the first cutting sites (black arrows) that are 15–17 nt (black lines) away from the internal loops or bulges. DRS also detects additional internal loops or bulges that are 9–11 nt (grey lines) away from the first cleavage sites by DCL1. See ‘Discussion’ for details.

Comment in

References

    1. Bartel DP MicroRNAs: target recognition and regulatory functions. Cell 136, 215–233 (2009). - PMC - PubMed
    1. Song XW, Li Y, Cao XF & Qi YJ MicroRNAs and their regulatory roles in plant–environment interactions. Annu. Rev. Plant Biol 70, 489–525 (2019). - PubMed
    1. Li S, Castillo-González C, Yu B & Zhang X The functions of plant small RNA s in development and in stress responses. Plant J. 90, 654–670 (2017). - PubMed
    1. Ma Z & Zhang X Actions of plant Argonautes: predictable or unpredictable? Curr. Opin. Plant Biol 45, 59–67 (2018). - PubMed
    1. Gebert LFR & MacRae IJ Regulation of microRNA function in animals. Nat. Rev. Mol. Cell Biol 20, 21–37 (2019). - PMC - PubMed

Publication types

MeSH terms

LinkOut - more resources