. 2024 Aug;25(8):1489-1506.
doi: 10.1038/s41590-024-01880-3. Epub 2024 Jun 25.

A humanized mouse that mounts mature class-switched, hypermutated and neutralizing antibody responses

Affiliations

A humanized mouse that mounts mature class-switched, hypermutated and neutralizing antibody responses

Daniel P Chupp et al. Nat Immunol. 2024 Aug.

Abstract

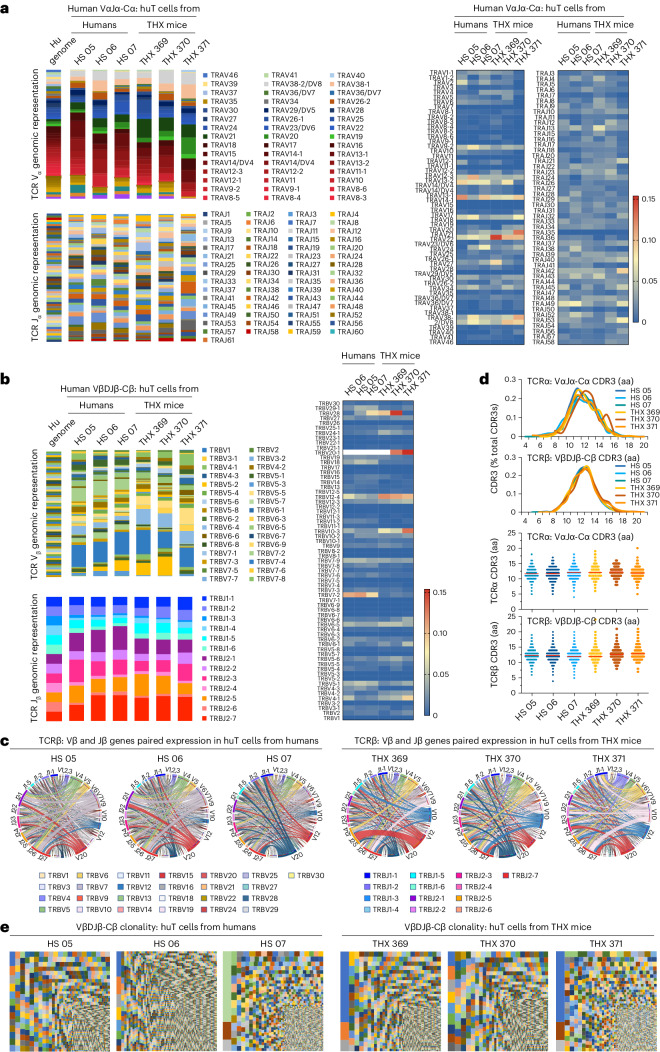
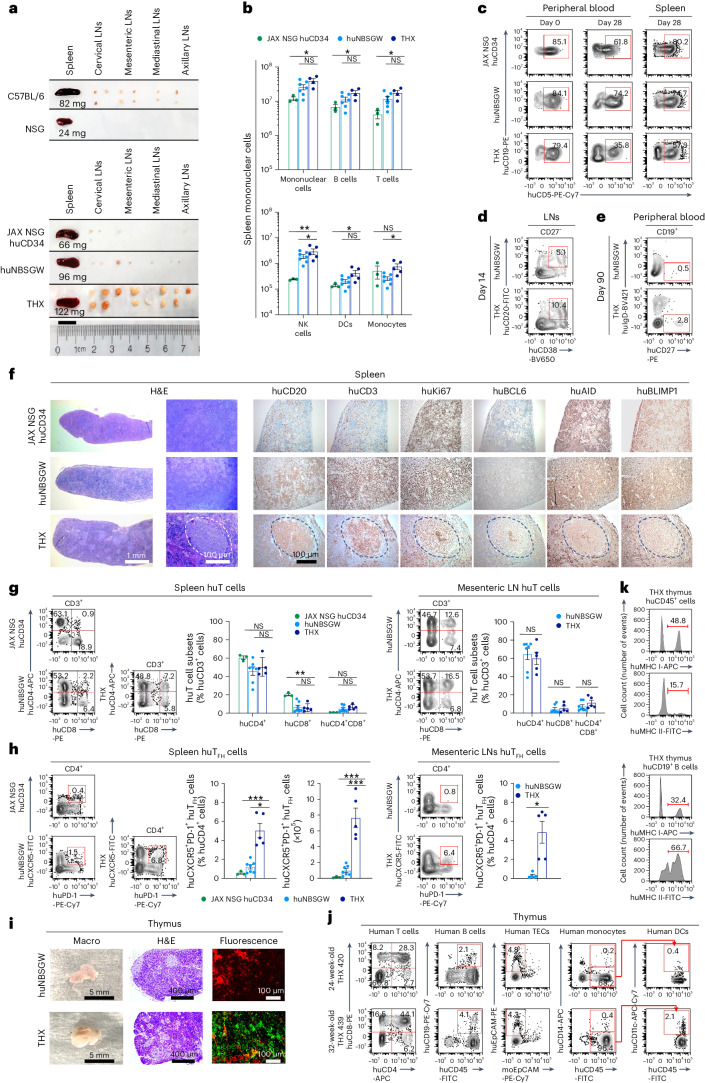
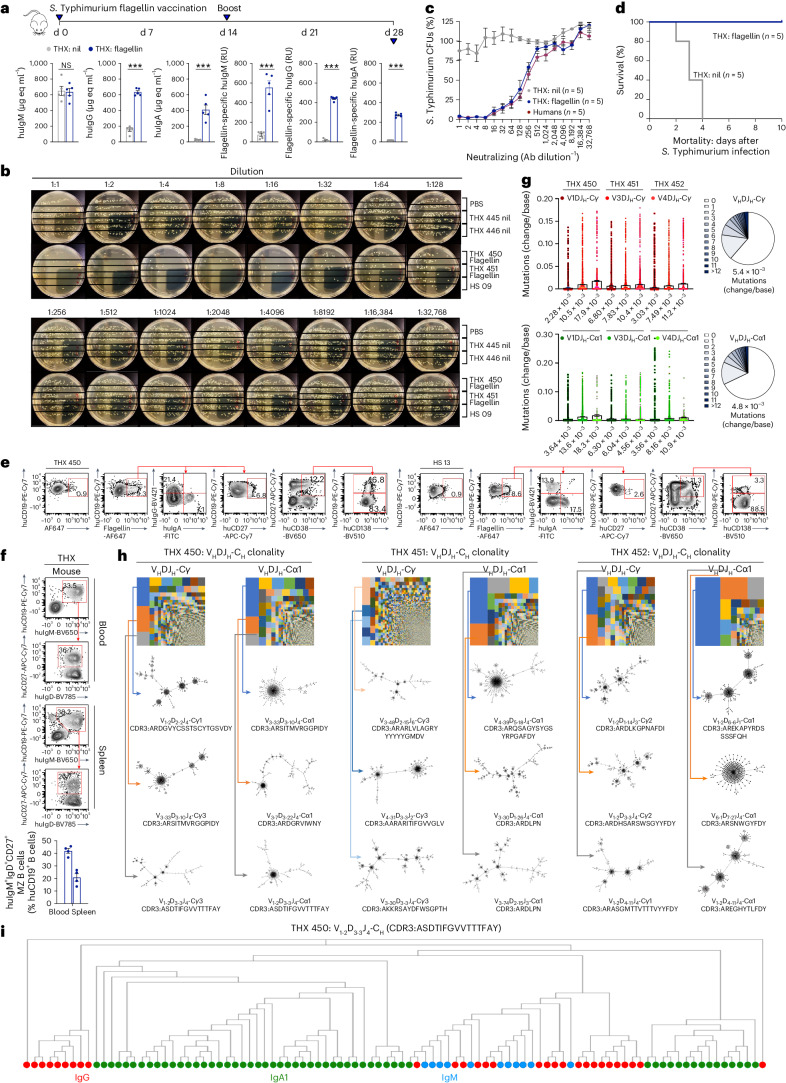
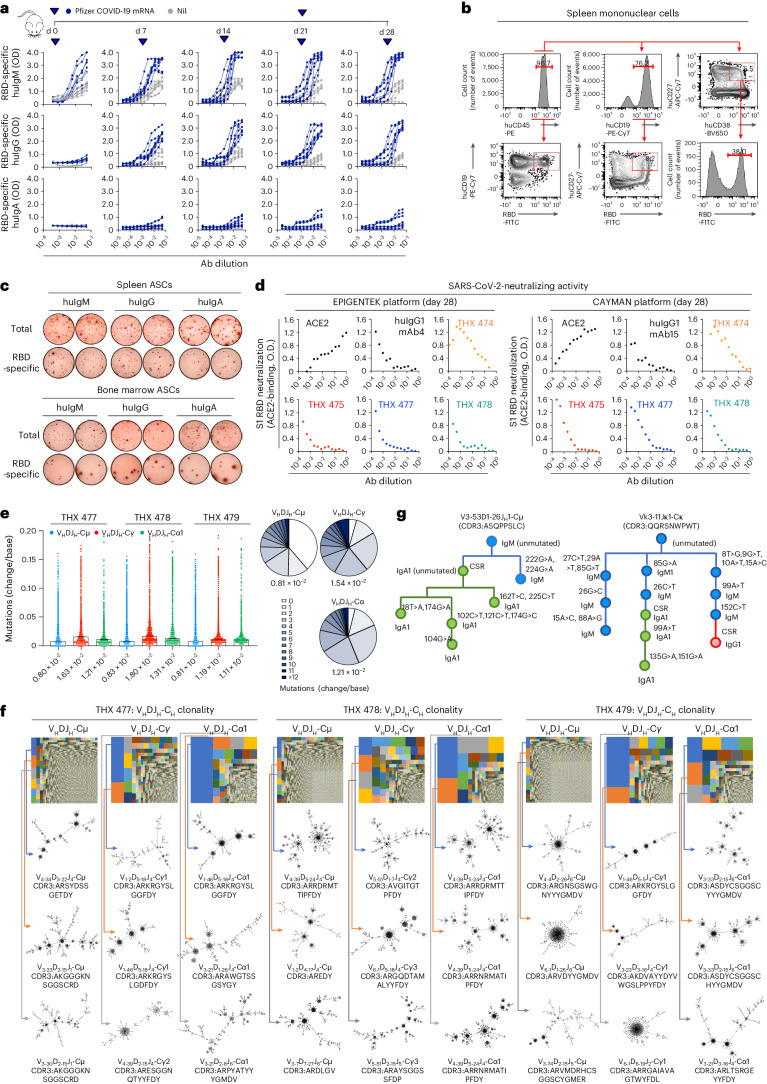
Humanized mice are limited in terms of modeling human immunity, particularly with regards to antibody responses. Here we constructed a humanized (THX) mouse by grafting non-γ-irradiated, genetically myeloablated KitW-41J mutant immunodeficient pups with human cord blood CD34+ cells, followed by 17β-estradiol conditioning to promote immune cell differentiation. THX mice reconstitute a human lymphoid and myeloid immune system, including marginal zone B cells, germinal center B cells, follicular helper T cells and neutrophils, and develop well-formed lymph nodes and intestinal lymphoid tissue, including Peyer's patches, and human thymic epithelial cells. These mice have diverse human B cell and T cell antigen receptor repertoires and can mount mature T cell-dependent and T cell-independent antibody responses, entailing somatic hypermutation, class-switch recombination, and plasma cell and memory B cell differentiation. Upon flagellin or a Pfizer-BioNTech coronavirus disease 2019 (COVID-19) mRNA vaccination, THX mice mount neutralizing antibody responses to Salmonella or severe acute respiratory syndrome coronavirus 2 Spike S1 receptor-binding domain, with blood incretion of human cytokines, including APRIL, BAFF, TGF-β, IL-4 and IFN-γ, all at physiological levels. These mice can also develop lupus autoimmunity after pristane injection. By leveraging estrogen activity to support human immune cell differentiation and maturation of antibody responses, THX mice provide a platform to study the human immune system and to develop human vaccines and therapeutics.


Conflict of interest statement

The authors declare no competing interests.

Figures

Fig. 1
Fig. 1. THX mice support full and sustained development of human immune cells.
a, Left, huCD45+ PBMCs reconstitution at indicated time points in THX (n = 11), huNBSGW (n = 6) and huNSG (n = 5) mice grafted with cord blood huCD34+ cells. Engraftment levels depicted as percentage of total (human plus mouse) CD45+ PBMCs. Arrow denotes the beginning of E2 treatment in huNBSGW mice that would later become THX mice (dark navy line starting at 18 weeks of age) and continuing thereafter. Right, Human and mouse CD45+ PBMCs (% total PBMCs), as identified by flow cytometry. Fluorescence-activated cell sorting (FACS) plots are from one THX, one huNBSGW and one huNSG mouse, each representative of five mice. b, huCD45+ mononuclear cell counts in THX, huNBSGW and huNSG mice. c, Total serum huIgM, huIgD, huIgG, huIgA and huIgE (expressed as µg equivalents per ml, µg eq ml−1) in THX (n = 6), huNBSGW (n = 5) and huNSG (n = 7) mice—huIgD and huIgE were undetectable in huNBSGW and huNSG mice. d, Survival of THX (n = 48), huNBSGW (n = 23) and huNSG (n = 18) mice through 55 weeks after huCD34+ cell engraftment (Kaplan–Meier curves, THX versus huNSG mice, P = 0.0323; THX versus huNBSGW mice, P = 0.1809, log-rank Mantel–Cox test). e, Number of huB cells (huCD45+CD19+), huT cells (huCD45+CD3+), huDCs (huCD45+CD3CD14CD11c+), huNK cells (huCD45+CD3CD56+) and human monocytes (huCD45+CD3CD14+) per ml of peripheral blood in THX, huNBSGW and huNSG mice (same mice as in b). f, Human immune cell profiling of THX mouse (n = 5) spleen huCD45+ cells analyzed by high-parameter cytometry with time-of-flight (CyTOF) analysis of 30 human markers. THX mouse spleen huCD45+ lymphoid and myeloid cell proportions were similar to those in spleens of humans (n = 6) who died from accidental death (Supplementary Table 4g). g, BM huCD34+ cells in THX (n = 3), huNBSGW (n = 3) and huNSG mice (n = 3). In the histograms (b, c and g), each dot represents an individual mouse, and the bar depicts the mean with s.e.m. Statistical significance (c and g) was assessed using two-sided Student’s unpaired t-test (NS, not significant; *P < 0.05, **P < 0.01, ***P < 0.001). Source data
Fig. 2
Fig. 2. THX mice huBCR repertoire and clonality are similar to those in humans.
a, huIgH VH, D and JH gene genomic representation and expression in blood and spleen huIgM+ B cells of healthy humans (n = 3, HS 01, 02, 03) and non-intentionally immunized THX mice (n = 3, THX 365, 366, 367), depicted as stacked columns. In these, different colors denote different huVH, huD or huJH gene families; color gradients denote individual family members—the huIgH locus haploid complement consists of 36–49 functional huVH genes segregated into 7 families. b, Heat map of individual huVH family members in huIgM+ B cells of HS and THX mice as in a. c, Associated expression of huVH and huJH genes in huIgM+ B cell repertoire of HS and THX mice as in a, depicted by Circos plots. Outermost Circos plot tracks mark the boundaries of each huVH or huJH region subfamily. d, huIgH CDR3 (translated amino acid sequence) length distribution (left) and frequency (right) in huIgM+ B cell recombined huVHDJH-Cμ transcripts of HS and THX mice as in a—the somatically generated IgH CDR3 is the most polymorphic BCR region and provides the main structural correlate for antigen binding. In the violin plots, the upper and lower edges of the box plot indicate the 75th and 25th percentiles, respectively, and the middle line indicates the median. Each dot depicts CDR3 length in an individual huB cell. e, huB cell clones in HS and THX mice as in a, as identified by unique huVHDJH-Cμ (including CDR3 as translated amino acid sequence) transcripts and depicted by TreeMaps. Individual rectangle or square (unique color) area reflects huB cell clone size. In THX mice, huVHDJH-Cμ transcripts identified 521,859, 23,052 and 20,045 discrete huB cell clones in the same order of magnitude as in HS huVHDJH-Cμ transcripts, which identified 11,115, 9,016 and 11,570 huB cell clones. f, huIgK chain (Vκ and Jκ) and huIgL chain (Vλ and Jλ-Cλ) gene genomic representation and expression in huIgM+ B cells of HS and THX mice as in a, depicted as stacked columns. In these, different colors denote different huVκ, huJκ or huVλ, huCλ gene families; color gradients denote individual gene family members—the huIgκ locus comprises 39 functional huVκ genes and 5 huJκ genes, while the huIgλ locus comprises 30 functional huVλ genes segregated into 10 subgroups and 5 functional huJλ-Cλ clusters.
Fig. 3
Fig. 3. THX mice huTCR cell repertoire and clonality are similar to those in humans.
a, huVα and huJα (huTCRa) genomic representation and gene expression in blood and spleen huT cells of healthy humans (n = 3, HS 05, 06, 07) and non-intentionally immunized THX mice (n = 3, THX mice 369, 370, 371) depicted as stacked columns (left). In these, different colors denote different huVα or huJα gene families; color gradients denote individual family members. Heat maps of expressed individual huVα and huJα genes (right). b, huVβ and huJβ (huTCRb) genomic representation and gene expression in huT cells of HS and THX mice as in a, depicted as stacked columns (left). In these, different colors denote different huVβ or huJβ gene families; color gradients denote individual family members. Heat maps of individual huVβ and huJβ genes (right). c, Associated expression of huVβ and huJβ genes in HS and THX mouse huT cell repertoires as in a, depicted by Circos plots. d, CDR3 length distribution (top) and frequency (bottom) in huT cell recombined huVαJα-Cα (huTCRa) and huVβDJβ-Cβ (huTCRb) transcripts of HS and THX mice as in a. Each dot depicts CDR3 length in an individual cell. e, huT cell clones in HS and THX mice as in a, as identified by unique huVβDJβ-Cβ (including CDR3 as translated amino acid sequence) transcripts and depicted by TreeMaps. Individual rectangle or square (unique color) area reflects huT cell clone size. In THX mice, huVβDJβ-Cβ transcripts identified 5,531, 3,981 and 8,142 discrete huT cell clones in the same order of magnitude as in HS huVβDJβ-Cβ transcripts, which identified 3,437, 11,305 and 4,266 discrete huT cell clones.
Fig. 4
Fig. 4. THX mice mount specific T cell-dependent and T cell-independent class-switched, hypermutated and clonal antibody responses.
af, THX (n = 7), huNBSGW (n = 7) and JAX NSG huCD34 (n = 4) mice were injected i.p. with NP16-CGG (100 μg in 100 μl alum) on day 0, boosted (100 μg in 100 μl PBS) on day 14 and euthanized on day 28. a, Total serum human immunoglobulin and NP4-specific human antibodies measured by ELISAs. Total human immunoglobulin concentrations expressed as μg eq ml−1 and NP4-specific human antibodies expressed as relative units (RUs). Fewer than seven data points were derived for human immunoglobulins other than NP4-specific huIgM, huIgG and huIgG1. b, Left, spleen huIgM+, huIgG+ and huIgA+ B cells, class-switched memory huCD27+IgD B cells and huCD27+CD38+ PBs/PCs. Right, NP-specific huCD19+ B cells and memory huCD19+CD27+IgG+ B cells (identified by binding of PE-labeled NP16), and MZ huCD19+IgM+IgD+CD27+ B cells in THX mouse spleen. c, Spleen huB cell intracellular AID and BLIMP-1 expression in THX and huNBSGW mice. d, Left, point mutation frequencies (change/base) in spleen huB cell huVHDJH-CH transcripts of THX 406, 407, 408 and 409 mice depicted as scatterplots. Each dot represents a single sequence and the bar depicts the mean with s.e.m. Right, means of total, S and R huV3 mutation frequencies in FR1, CDR1, FR2, CDR2 and FR3 of huVHDJH-CH transcripts depicted as histograms. e, In the SHM pie charts, slices depict proportions of huVHDJH-CH transcripts carrying given numbers of point mutations; slice gray gradients depict increasing numbers of point mutations; the overall mutation frequency is listed below each pie chart. Spectrum of point mutations depicted as donut charts (same mice as in d). f, huV1DJH-Cγ1 B cell clones and intraclonal diversification in THX mice (same mice as in d) depicted by TreeMaps and phylogenetic trees. Individual rectangle or square (unique color) area reflects huB cell clone size. In THX 406, 407, 408 and 409 mice, the three largest huV1DJH-Cγ1 clones accounted for 42.9%, 26.6%, 32.0% and 23.4% of huV1DJH-Cγ1 B cells. gp, THX (n = 7), huNBSGW (n = 7) and JAX NSG huCD34 (n = 4) mice were injected i.p. with DNP-CpG (50 μg in 100 μl PBS) on day 0, boosted (50 μg in 100 μl PBS) on day 14 and euthanized on day 28. g, Total serum immunoglobulin concentration (μg eq ml−1) and DNP5-specific human antibodies (RUs) measured by specific ELISAs. Fewer than seven data points were derived for DNP-specific huIgE. h, Spleen huB cells, huMBCs and huPBs/PCs as in b. i, huCD45+ huCD19+ B cells, huCD3+ T cells, huCD11c+ DCs, huCD14+ monocytes, memory huCD19+CD27+ B cells, huCD27+CD38+ PBs/PCs as well as huIgM+, huIgD+, huIgG+ and huIgA+ B cells in THX mouse mesenteric LNs and spleen. j, Blood and spleen MZ huCD19+IgM+IgD+CD27+ B cells (8.1% ± 0.3% and 12.9% ± 0.2% huB cells, respectively) in THX (n = 6) and huNBSGW (n = 6) mice. FACS plots are from one THX and one huNBSGW mouse, each representative of six mice. k, Total and DNP5-specific huIgM, huIgG and huIgA ASCs in THX mouse spleen and BM, as analyzed by specific ELISPOTs. l, Spleen huB cell intracellular AID and BLIMP-1 expression in THX and huNBSGW mice. m, Total human immunoglobulin (μg eq ml−1) in the BALF of THX (n = 5) and huNBSGW (n = 5) mice. n, huCD45+ cells, huCD19+ B cells, huCD3+ T cells, and huIgM-, huIgD- and huIgA-producing cells in THX mouse lamina propria (immunofluorescence; scale bar, 100 μm). Different pseudocolors denote different cells. o,p, Free and bacteria-bound huIgD and huIgA in feces of THX (n = 5) and huNBSGW (n = 5) mice measured by specific ELISA (μg eq/g, THX versus huNBSGW mice: huIgD, P < 0.0001; huIgA, P = 0.007, two-sided Student’s unpaired t-test) and identified by flow cytometry (% total bacterial cells). Flow cytometry plots (b, c, h, i and l) are from one THX, one huNBSGW or one JAX NSG huCD34 mouse, each representative of three mice. huCD45+ cells were pre-gated in all FACS analyses. ELISPOT images (k) and micrographs (n) are from one THX mouse representative of five mice. In the histograms (a, g, j, m and o), each dot represents an individual mouse and the bar depicts the mean with s.e.m. Statistical significance (a, g, j and m) was assessed by two-sided Student’s unpaired t-test (NS, not significant; *P < 0.05, **P < 0.01, ***P < 0.001). Source data
Fig. 5
Fig. 5. THX mice develop thymic huTECs and huB cells, differentiate huTFH cells, form GCs and generate class-switched huMBCs.
ak, THX (n = 5), huNBSGW (n = 7) and JAX NSG huCD34 (n = 3) mice of the n = 7, 7 and 4 mice, respectively, of Fig. 4, were injected i.p. with NP16-CGG on day 0, boosted on day 14 and euthanized on day 28, unless otherwise specified. a, Spleen and LNs (cervical, mesenteric, mediastinal and axillary) of NP16-CGG-immunized THX, huNBSGW and JAX NSG huCD34 mice and non-immunized NSG and C57BL/6 mice (scale bar, 1 cm). b, Spleen huB cells, huT cells, huNK cells, huDCs and human monocytes in THX versus huNBSGW and JAX NSG huCD34 mice (39.5 ± 6.6 × 106 versus 26.0 ± 4.4 × 106 and 11.9 ± 1.5 × 106 mononuclear cells). c, Blood and spleen huCD19+CD5+ (B1) cells in THX, huNBSGW and JAX NSG huCD34 mice on days 0 and 28. d,e, Mesenteric LN GC huCD27CD20+CD38+ B cells (d, day 14) and blood class-switched memory huCD19+CD27+IgD B cells (e, day 90) in THX and huNBSGW mice. f, Spleen sections from THX, huNBSGW and JAX NSG huCD34 mice (day 14, hematoxylin and eosin (H&E) and immunohistochemical huCD20, huCD3, huKi67, huBCL6, huAID and huBLIMP-1; scale bars, 1.0 mm and 100 μm). g,h, huCD4+, huCD8+, huCD4+CD8+ T cells (g) and huCD4+CXCR5+PD-1+ TFH cells (h) in spleens and mesenteric LNs of THX, huNBSGW and JAX NSG huCD34 mice. i, Thymus sections of THX and huNBSGW mice (whole organ, H&E, human and mouse EpCAM+ TECs immunofluorescence; scale bars, 100 μm, 400 µm and 5 mm). j,k, Human and mouse EpCAM+ TECs, huT cells, huB cells, huDCs, human monocytes (j) and cells expressing huMHC class I and huMHC class II (k) in THX mouse thymus. Images (a), micrographs (f and i) and FACS plots (ce, g, h, j and k) are from one mouse per group, each representative of three mice. huCD45+ cells were pre-gated in all FACS analyses. In the histograms (b, g and h), each dot represents an individual mouse and bars depict the mean with s.e.m. Statistical significance (b, g and h) was assessed by two-sided Student’s unpaired t-test (NS, not significant; *P < 0.05, **P < 0.01, ***P < 0.001). Source data
Fig. 6
Fig. 6. THX mice vaccinated with flagellin mount a mature neutralizing antibody response to S. Typhimurium.
ai, THX mice were injected i.p. with S. Typhimurium flagellin (50 μg in 100 μl alum) or nil (100 μl alum) on day 0, boosted (50 μg in 100 μl PBS or 100 μl PBS) on day 14 and euthanized on day 28. a, Total serum immunoglobulin concentration (μg eq ml−1) and flagellin-specific human antibodies (RUs) in flagellin-vaccinated (n = 5) and non-vaccinated (nil, n = 5) THX mice measured by specific ELISAs (NS, not significant; ***P < 0.001, two-sided Student’s unpaired t-test). b,c, Dose-dependent antibody S. Typhimurium neutralizing activity of sera from flagellin-vaccinated THX mice (n = 5), non-vaccinated THX mice (n = 5) and healthy humans (n = 5); representative Luria-Bertoni (LB)-agar plates showing (residual) S. Typhimurium colony-forming units (CFUs) at each serum dilution. d, Survival of flagellin-vaccinated (n = 5) and non-vaccinated (n = 5) THX mice infected orally with S. Typhimurium (1 × 105 CFUs, day 21; Kaplan–Meier curves, P = 0.0026, log-rank Mantel–Cox test). e, Flagellin-specific huCD19+ B cells, huIgG+ B cells, huIgA+ B cells and class-switched memory huCD19+CD27+ B cells in flagellin-vaccinated THX mouse spleen and healthy human blood, as identified by binding of Andy Fluor 647 (AF647)-labeled flagellin (AF647 alone as negative control); identification of huCD19+CD138+ PBs and huCD19CD138+ PCs among pre-gated huCD27+CD38+ cells. f, Blood and spleen MZ huCD19+IgM+IgD+CD27+ B cells (41.9% ± 1.9% and 20.7% ± 3.0% huB cells, respectively) in flagellin-vaccinated THX mice (n = 4). g, Point mutation frequencies (changes per base) in sorted spleen huB cell huVHDJH-Cγ (V1: 4.0 ± 1.4 × 10−3, V2: 8.6 ± 0.9 × 10−3, V3: 1.3 ± 0.2 × 10−2) and huVHDJH-Cα1 (V1: 4.5 ± 0.9 × 10−3, V3: 9.3 ± 2.3 × 10−3, V4: 1.1 ± 0.4 × 10−2) transcripts of additional flagellin-vaccinated THX mice (n = 3, THX 450, 451, 452) depicted as scatterplots and pie charts. Each dot represents a single sequence and bars depict the mean with s.e.m. h, huVHDJH-Cγ and huVHDJH-Cα1 huB cell clones and intraclonal diversification in THX mice as in g, depicted by TreeMaps and phylogenetic trees. Individual rectangle or square (unique color) area reflects huB cell clone size. In THX 450, 451 and 452 mice, the three largest huVHDJH-Cγ and huVHDJH-Cα1 clones accounted for 18.6%, 9.2% and 18.4% of huVHDJH-Cγ huB cells and 19.6%, 33.4% and 57.9% of huVHDJH-Cα1 huB cells. i, Evolutive lineage of a huB cell clone that underwent SHM and CSR in a flagellin-vaccinated THX mouse (THX 450). huCD45+ cells were pre-gated in all FACS analyses. In the histograms (a and f), each dot represents an individual mouse and bars depict the mean with s.e.m. Source data
Fig. 7
Fig. 7. THX mice vaccinated with Pfizer COVID-19 mRNA mount a mature neutralizing antibody response to SARS-CoV-2 Spike S1 RBD.
ag, THX mice were injected i.m. with Pfizer-BioNTech 162b2 COVID-19 mRNA vaccine (5 μg in 50 μl PBS) or nil (50 μl PBS) on day 0, boosted (5 μg in 50 μl PBS or 50 μl PBS) on day 21 and euthanized on day 28. a, Serum RBD-specific human antibodies in COVID-19 mRNA-vaccinated (n = 8) and non-vaccinated (nil, n = 8) THX mice by specific ELISA (titers expressed as optical density (OD) readings at different dilutions). b, Total and RBD-specific spleen huCD45+ cells, huB cells, huMBCs and huPBs/PCs in COVID-19 mRNA-vaccinated THX mice, as identified by binding of labeled SARS-CoV-2 Spike S1 RBD. c, Total and RBD-specific huIgM, huIgG and huIgA ASCs in spleen and BM of COVID-19 mRNA-vaccinated THX mice, as analyzed by specific ELISPOTs. Data in b and c are from one THX mouse representative of three THX mice. d, Dose-dependent neutralizing antibody activity of sera from COVID-19 mRNA-vaccinated THX mice (n = 4), as analyzed by EpigenTek and Cayman SARS-CoV-2-neutralizing antibody detection platforms. SARS-CoV-2-neutralizing humAb4 and humAb15 were provided as positive control by EpigenTek and Cayman. e, Point mutation frequencies (changes per base) in spleen huB cell huVHDJH-CH (huVHDJH-Cμ: 0.8 ± 0.01 × 10−2, huVHDJH-Cγ: 1.5 ± 0.2 × 10−2, huVHDJH-Cα1: 1.2 ± 0.1 × 10−2) transcripts of COVID-19 mRNA-vaccinated THX mice (n = 3, THX 477, 478, 479) depicted as scatterplots and pie charts. Each dot represents a single sequence and bars depict the mean with s.e.m. f, huVHDJH-CH B cell clones and intraclonal diversification in THX mice as in e, depicted by TreeMaps and phylogenetic trees. Individual rectangle or square (unique color) area reflects huB cell clone size. In THX 477, 478 and 479 mice, the three largest huVHDJH-Cμ, huVHDJH-Cγ and huVHDJH-Cα1 clones accounted for 4.7%, 3.9% and 2.8% of huVHDJH-Cμ huB cells, 22.0%, 16.1% and 36.9% of huVHDJH-Cγ huB cells and 42.8%, 40.7% and 22.5% of huVHDJH-Cα1 huB cells. g, Interplay of SHM and CSR shapes B cell stepwise intraclonal diversification in COVID-19 mRNA-vaccinated THX mice, as exemplified by genealogical trees outlining the evolution of two huB cell clones, one tracked from its huV3-53D1-26JH1-Cμ heavy-chain huB cell progenitor, the other from its huVκ3-11Jκ1-Cκ light-chain huB cell progenitor. Source data
Fig. 8
Fig. 8. THX mice can develop human autoantibodies and model SLE.
ag, Lupus THX mice were generated by injecting THX mice (n = 11) once i.p. with 500 μl pristane. THX mice (n = 12) injected with 500 μl PBS served as healthy controls. a, Left, malar rash in a (huNSGW41-derived) Lupus THX mouse (3 weeks after pristane injection). Middle, serum antinuclear IgGs (scale bar, 20 μm) and kidney immunopathology (H&E and anti-huIgG immunofluorescence; scale bar, 100 μm) in Lupus THX and THX mice (12 weeks after pristane or PBS injection). Micrographs are from one Lupus THX and one THX mouse, each representative of 3 mice. Right, survival of Lupus THX (n = 11) and THX (n = 12) mice through 12 weeks after pristane or PBS injection (Kaplan–Meier curves, P = 0.04, log-rank Mantel–Cox test). b, Total serum huIgM, huIgG and huIgA (µg eq ml−1) as well as anti-dsDNA, anti-histone, anti-RNP and anti-RNA huIgG (RUs) in Lupus THX (n = 7) and THX (n = 7) mice measured by specific ELISAs. c, Mesenteric LN huIgM+IgD+, huIgM+, huIgG+ and huIgA+ B cells as well as spleen and BM huCD27+CD38+ PBs/PCs in Lupus THX and THX mice. Data are from one Lupus THX and one THX mouse, each representative of three mice (3 Lupus THX mice were euthanized when showing obvious signs of disease; 3 euthanized healthy THX mice entered into the study in addition to the 12 followed in the survival study). d, Numbers of point mutations in recombined huVHDJH-Cγ and huVHDJH-Cα1 transcripts in Lupus THX mice (n = 3, Lupus THX 715, 716, 717) huB cells depicted as scatterplots. Each dot represents a single sequence and bars depict the mean with s.e.m. e, Spleen huB cell intracellular AID and BLIMP-1 expression in Lupus THX (n = 3) and THX (n = 3) mice. f,g, huV3DJH-Cγ and huV3DJH-Cα1 huB cell clones and intraclonal diversification (f) as well as huVβDJβ-Cβ huT cell clones (g) in Lupus THX mice (n = 2, Lupus THX 715, 717), as depicted by TreeMaps and phylogenetic trees. Individual rectangle or square (unique color) area reflects huB or huT cell clone size. Analyses in bg were performed at 6 weeks after pristane or PBS injection. huCD45+ cells were pre-gated in all FACS analyses. In the histograms (b and e), each dot represents an individual mouse and bars depict the mean with s.e.m. Statistical significance (b and e) was assessed by two-sided Student’s unpaired t-test (NS, not significant; **P < 0.01, ***P < 0.001). Source data
Extended Data Fig. 1
Extended Data Fig. 1. Serum 17β-estradiol concentrations in humanized mice.
Serum estradiol concentrations (pg ml−1) in non-intentionally immunized female (n = 12) and male (n = 12) THX mice and non-intentionally immunized (non-E2-treated) female (n = 12) and male (n = 12) huNBSGW mice measured by specific ELISA (Cayman Chemical estradiol platform). Each dot in histograms depicts E2 concentration from an individual mouse and the bar depicts the mean with s.e.m. Estradiol concentrations in female and male THX mice were comparable and significantly greater than in huNBSGW mice (P < 0.0001, two-sided Student’s unpaired t-test). The normal blood estradiol concentration in mice can vary depending on factors such as age, sex and stage of the estrous cycle in females. In female C57BL/6 mice, blood estradiol concentration range is as follows: Proestrus (the stage just before estrus), 5–60 pg ml−1; Estrus (the stage when ovulation occurs), 15–200 pg ml−1; Metestrus (the stage just after estrus), 5–50 pg ml−1; Diestrus (the stage between metestrus and proestrus), 5–40 pg ml−1. In male mice, blood estradiol concentrations are lower ( < 5.0 pg ml−1). In women, blood estradiol concentration range is as follows: Follicular phase (days 1–14 of the menstrual cycle), 35–400 pg ml−1; Mid-cycle (around day 14 of the menstrual cycle), 100–500 pg ml−1; Luteal phase (days 14–28 of the menstrual cycle), 35–400 pg ml−1; Postmenopausal women, less than 10–30 pg ml−1. In pregnant women, blood estradiol concentration range is as follows: First trimester, 300–3,000 pg ml−1; Second trimester, 1,900–10,000 pg ml−1; Third trimester, 2,000–14,000 pg ml−1. In men, blood estradiol concentration range is 10–30 pg ml−1. It is important to note that estradiol concentration ranges may vary depending on the laboratory that performs the test and the assay used for measurement. Blood estradiol concentration ranges reported here were derived from multiple sources. Source data
Extended Data Fig. 2
Extended Data Fig. 2. THX mice huCD45+ cell reconstitution and THX mice but not huNBSGW mice develop Peyer’s patches, containing huB cells, huMZ B cells, huGC B cells, huMBCs, huPBs/PCs and huT cells.
a, Identification of circulating huCD45+ PBMCs in non-intentionally immunized THX mice (n = 7) by flow cytometry. huCD45+ cells account for 92−96% of total (human plus mouse) CD45+ cells in blood of THX mice. b, THX (n = 6 of the 7 as in Fig. 4g) and huNBSGW (n = 6 of the 7 as in Fig. 4g) mice were injected i.p. with DNP-CpG (50 μg in 100 µl PBS) at day 0, boosted on day 14 and euthanized on day 28. (Top left row) Peyer’s patches in THX mice and lack thereof in huNBSGW mice. (Top right row) huCD3+CD4CD8, huCD3+CD4+, huCD3+CD8+, huCD3+CD4+CD8+ T cells and huCD3+CD4+CXCR5+PD-1+ TFH cells. (Middle row) MZ huCD19+IgM+IgD+CD27+ B cells (20.4% ± 0.7% huB cells), huIgM+ and huIgG+ B cells, GC huCD19+CD38+CD27IgG+ and GC huCD19+CD38+CD27IgA+ B cells, class-switched memory huCD27+huIgD B cells, huCD19+CD27+CD38+CD138+ PBs and huCD19CD27+CD38+CD138+ PCs in Peyer’s patches of DNP-CpG-immunized THX and huNBSGW mice. Due to the extreme paucity of cells in barely detectable Peyer’s patches of huNBSGW mice, not enough events could be collected for a meaningful analysis. Flow cytometry plots are from one THX and one huNBSGW mouse, each representative of 6 mice. huCD45+ cells were pre-gated in all FACS analyses. Captions on top of FACS plots indicate pre-gating markers. (Bottom row) Quantification of huMZ B cells, class-switched huB cells, huGC B cells, huMBCs and huPBs/PCs in Peyer’s patches of THX and huNBSGW mice. Each dot represents an individual mouse, the bar depicts the mean with s.e.m. Statistical significance was assessed by two-sided Student’s unpaired t-test (NS, not significant; ***P < 0.001). Source data
Extended Data Fig. 3
Extended Data Fig. 3. Gut microbiome composition in NBSGW, huNBSGW and THX mice.
Left, bacterial families identified in gut microbiome of non-intentionally immunized (non-huHSC-grafted, non-E2-conditioned) NBSGW (n = 6), (huHSC-grafted, non-E2-conditioned) huNBSGW (n = 6) and (huHSC-grafted, E2-conditioned) THX mice (n = 6 including the 3 mice as in Fig. 2a–f) by high-throughput 16 s rRNA gene MiSeq amplicon sequencing. In histograms, different colors denote different bacterial families, depicted as stacked columns. Each column depicts microbiome composition in an individual mouse. THX, huNBSGW and NBSGW mice developed distinct gut bacterial microbiomes (THX, 8; huNBSGW, 7-8; NBSGW, 6 families). THX mice gut was colonized by Lactobacillaceae, Lachnospiraceae, Erysipelotrichaceae and Clostridiaceae bacterial families (phylum: Firmicutes), Muribaculaceae (Bacteroidetes), Akkermansiaceae (Verrucomicrobia) and Enterobacteriaceae (Pseudomonadota). NBSGW mice gut harbored predominately (up to virtually 80%) Rikenellaceae (Bacteroidetes), which are characteristic of mouse gut microbiome and were not found in THX mice. Rikenellaceae contributed moderately to gut microbiome of 3 out of 6 huNBSGW mice, suggesting a human pseudo-normalization of the mouse microbiome by human immune system elements’ development and differentiation. Disappearance of Rikenellaceae in THX mice suggested an important impact of E2 conditioning on further ‘humanization’ of these mice gut microbiome. Right, principal component analysis (PCA) of gut bacterial composition in the same non-intentionally immunized NBSGW (blue), huNBSGW (green) and THX (red) mice. Each dot depicts an individual mouse; colors denote NBSGW, huNBSGW and THX mice. THX and huNBSGW mice, both hosting bacterial families contributing to gut microbiota in healthy humans, fully segregate from NBSGW mice, which host predominately ‘murine’ Rikenellaceae. Source data
Extended Data Fig. 4
Extended Data Fig. 4. NP16-CGG-immunized THX mice mount a T-dependent class-switched antibody response to NP entailing select B cell oligoclonal expansion and SHM-mediated intraclonal diversification.
a, b, Spleen huB cell huV3DJH-Cγ and huV3DJH-Cα1 transcripts in NP16-CGG-immunized THX mice (n = 3, same mice as in Fig. 4d–f) were analyzed for SHM, B cell clonal expansion and intraclonal diversification. (a) In the SHM pie charts, slices depict proportions of transcripts carrying given numbers of point-mutations; slice gray gradients depict increasing numbers of point-mutations; the overall mutation frequency (change/base) is listed below each pie chart. Spectrum of point-mutations depicted as donut charts. Means of total, S and R huV3 mutation frequencies in FR1, CDR1, FR2, CDR2 and FR3 of recombined huV3DJH-Cγ and huV3DJH-Cα1 transcripts depicted as histograms. (b) huV3DJH-Cγ1 and huV3DJH-Cα1 huB cell clones and intraclonal diversification, as depicted by TreeMaps and phylogenetic trees. Individual rectangle or square (unique color) area reflects huB cell clone size. In THX 406, 407, 408 and 409 mice, the 3 largest huV3DJH-Cγ1 huB cell clones accounted for 3.5%, 6.9%, 8.3% and 4.6% of huV3DJH-Cγ1 huB cells, while the 3 largest huV3DJH-Cα1 huB cell clones accounted for 22.6%, 31.2% and 12.5% of huV3DJH-Cα1 huB cells in THX 406, 407 and 408 mice. Select huIgG+B cell clones expressed V3 with V3-30 overutilization (over 24% of V3DJH-Cγ1 transcripts). Intraclonal diversification is depicted for each of the three largest clones as a genealogical tree constructed based on shared and unique point-mutations in recombined huV3DJH-Cγ1 and huV3DJH-Cα1 transcripts.
Extended Data Fig. 5
Extended Data Fig. 5. DNP-CpG-immunized THX mice mount a T-independent class-switched antibody response to DNP entailing select B cell oligoclonal expansion and SHM-mediated intraclonal diversification.
a, Spleen huB cell huVHDJH-Cγ transcripts in a DNP-CpG-immunized THX mouse (n = 1, THX 425 as in Fig. 4g) were analyzed for SHM. Left, huVH mutation frequency (change/base) in recombined huVHDJH-Cγ transcripts, as depicted by scatter plots. Each dot depicts a single sequence and bar depicts mean with s.e.m. Middle, in the SHM pie charts, slices depict proportions of transcripts carrying given numbers of point-mutations; slice gray gradients depict increasing numbers of point-mutations; the overall mutation frequency (change/base) is listed below each pie chart. Spectrum of point-mutations depicted as donut charts. Right, means of total, S and R huVH, huV1, huV3, huV4 mutation frequencies in FR1, CDR1, FR2, CDR2 and FR3 of recombined huVHDJH-Cγ transcripts depicted as histograms. b, huVHDJH-Cμ and huVHDJH-Cγ huB cell clones and intraclonal diversification in a non-intentionally immunized THX mouse (n = 1, THX 437) and DNP-CpG-immunized THX mouse 425 as in (a), as depicted by TreeMaps and phylogenetic trees. Individual rectangle or square (unique color) area reflects huB cell clone size. In the DNP-CpG-immunized mouse (THX 425), the 3 largest huV1DJH-Cμ, huV3DJH-Cμ and huV4DJH-Cμ huB cell clones accounted for 7.2%, 7.7% and 4.5% of huV1DJH-Cμ, huV3DJH-Cμ and huV4DJH-Cμ huB cells, while only accounting for 2.1%, 1.4% and 1.4% of similar huB cells in the non-intentionally immunized THX mouse (THX 437). In the same DNP-CpG-immunized THX mouse, the 3 largest huV1DJH-Cγ, huV3DJH-Cγ and huV4DJH-Cγ huB cell clones accounted for 22.3%, 16.8% and 29.4% of huV1DJH-Cγ, huV3DJH-Cγ and huV4DJH-Cγ huB cells.
Extended Data Fig. 6
Extended Data Fig. 6. THX mice huB cells undergo CSR and differentiation as efficiently as huB cells from adult humans.
ac, Naïve huIgM+IgD+ B cells isolated from blood of healthy humans (n = 3, HS 14, 15, 16) and spleens of non-intentionally immunized THX mice (n = 3, THX 442, 443, 444) were cultured for 120 h upon stimulation with: (a) CD154 (3 U/ml), huIL-2 (100 ng/ml), huIL-4 (20 ng/ml) and huIL-21 (50 ng/ml), (b) CpG ODN2395 (2.5 mg/ml), huIL-2, huIL-21, TGF-β (4 ng/ml) and retinoic acid (4 ng/ml), or (c) CpG ODN2395, huIL-2, huIL-4 and huIL-21. Identification of huIgM+, huIgD+, huIgG+, huIgA+ or huIgE+ B cells, huCD27+IgD class-switched memory-like B cells (huMB) and huCD27+CD38+ PBs by flow cytometry. huCD45+CD19+ cells were pre-gated in all FACS analyses. d, AICDA, PRDM1, VHDJH-Cμ, VHDJH-Cγ1, VHDJH-Cα1 and VHDJH-Cε transcript expression in HS and THX mice huB cell microcultures (n = 3 biological replicates for each different microculture), as measured by qPCR and normalized to HPRT1 expression (2−ΔCt method). In histograms, each dot represents transcript expression from one human or one THX mouse huB cell microculture and the bar depicts the mean with s.e.m. Statistical significance (d) was assessed by two-sided Student’s unpaired t-test (NS, not significant). Source data
Extended Data Fig. 7
Extended Data Fig. 7. Flagellin-vaccinated THX mice mount a class-switched antibody response to S. Typhimurium entailing select B cell oligoclonal expansion and SHM-mediated intraclonal diversification.
ae, THX mice (n = 3, THX 450, 451, 452, same mice as in Fig. 6g, h) were injected i.p. with S. Typhimurium flagellin on day 0 (50 μg in 100 μl alum), boosted on day 14 (50 μg in 100 μl PBS) and euthanized on day 28. (a) Flagellin-specific huCD19+ B cells, huIgG+ B cells, huIgA+ B cells and class-switched memory huCD19+huCD27+ B cells in flagellin-vaccinated THX mice spleen and blood of a healthy human, as identified by binding of AF647-labeled flagellin (AF647 alone as negative control); identification of huCD19+CD138+ PBs and huCD19CD138+ PCs among pre-gated huCD27+CD38+ cells. huCD45+ cells were pre-gated in all FACS analyses. be, Spleen huB cell huVHDJH-CH transcripts analyzed for CDR3 length, R:S mutations, huB cell clonal size and diversity, mutation frequency and evolution of a huB cell clone. (b) CDR3 length distribution in huIgM+, huIgG+ and huIgA+ B cells. Colors denote different antibody isotypes; color gradients denote different THX mice. (c) Means of total, S and R huVH mutation frequencies in FR1, CDR1, FR2, CDR2 and FR3 of recombined huVHDJH-CH transcripts depicted as histograms. Data are from one THX mouse representative of 3 THX mice. (d) huVHDJH-Cμ, huVHDJH-Cγ and huVHDJH-Cα1 huB cell clonal size and diversity in flagellin-vaccinated THX mice (n = 3, THX 450, 451, 452) depicted as scatter plots. Bars depict the mean with s.e.m. (e) Left, point-mutation frequency (change/base) in huB cell huVHDJH-CH transcripts of flagellin-vaccinated THX mice (n = 2, THX 450, 451) depicted as scatter plots. Each dot depicts a single sequence and the bar depicts the mean with s.e.m. Right, evolutive lineage of a huB cell clone that underwent SHM and CSR in a flagellin-vaccinated THX mouse (n = 1, THX 450). The root represents the rearranged, unmutated and unswitched recombined huV3-33D3-10J4-Cμ gene sequence of the huB cell progenitor and the leaves represent somatically hypermutated or class-switched and somatically hypermutated huB cell sub-mutants. Nodes represent huB cell sub-mutants that emerged during the clonal evolutionary process.
Extended Data Fig. 8
Extended Data Fig. 8. Serum human cytokine concentrations in flagellin- and COVID-19 mRNA-vaccinated THX mice.
Serum huAPRIL, huBAFF, huTGF-β1, huIFN-γ, huIL-2, huIL-4, huIL-6, huIL-10 and huIL-21 (pg ml−1) in flagellin-vaccinated (n = 16) and Pfizer COVID-19 mRNA-vaccinated (n = 24) THX mice measured by Luminex Human Discovery Assay 8-plex or TGF-β Premixed Magnetic Luminex Performance Assay (R&D Systems Luminex Platform). In the histograms, each dot represents human cytokine concentration from an individual mouse and the bar depicts the mean with s.e.m. No significant difference was found in huAPRIL, huTGF-β1, huIFN-γ, huIL-2, huIL-6, huIL-10 and huIL-21 concentrations between flagellin-vaccinated and COVID-19 mRNA-vaccinated THX mice. huBAFF and huIL-4 concentrations were significantly greater in flagellin-vaccinated than in COVID-19 mRNA-vaccinated THX mice (P = 0.0134 and P = 0.0229, two-sided Student’s unpaired t-test). Flagellin-vaccinated THX mice showed blood incretion of huAPRIL, huBAFF, huTGF-β, huIFN-γ, huIL-2, huIL-4, huIL-6, huIL-10 and huIL-21 (205 ± 15.20, 231 ± 16.50, 7351 ± 794, 5.03 ± 1.94, 0.91 ± 0.16, 6.29 ± 0.45, 3.11 ± 1.30, 1.85 ± 0.30 and < 0.1 pg ml−1) at human physiological concentrations. COVID-19 mRNA-vaccinated THX mice also showed blood incretion of huAPRIL, huBAFF, huTGF-β, huIFN-γ, huIL-2, huIL-4, huIL-6, huIL-10 and huIL-21 (164 ± 14.45, 172 ± 14.86, 7627 ± 610, 18.00 ± 7.66, 0.84 ± 0.12, 4.43 ± 0.60, 3.06 ± 1.31, 1.89 ± 0.45 and < 0.1 pg ml−1, mean ± s.e.m.) at human physiological concentrations. In healthy adult humans, the approximate concentrations (range) of circulating cytokines are as follows: huAPRIL, 100–400 pg ml−1; huBAFF, 50–400 pg ml−1; huTGF-β1, 1000–10,000 pg ml−1; huIFN-γ, 0.1–4.2 pg ml−1; huIL-2, 0.1–2.0 pg ml−1; huIL-4, 0.5–4.0 pg ml−1; huIL-6, 0.1–5.0 pg ml−1; huIL-10, 0.1–2.8 pg ml−1; huIL-21, < 0.1 pg ml−1. In healthy humans, circulating huIL-21 is below 100 fg ml−1, a concentration below the detection limit of Luminex Human Discovery Assay 8-plex. It is important to note that human cytokine concentration ranges may vary depending on the type of assay used for measurement. The human cytokine concentration ranges reported here were derived from multiple sources. Source data
Extended Data Fig. 9
Extended Data Fig. 9. THX mice vaccinated with Pfizer-BioNTech 162b2 COVID-19 mRNA mount a class-switched and somatically hypermutated antibody response to SARS-CoV-2 Spike S1 RBD.
a, Spleen huB cell huVHDJH-Cμ, huVHDJH-Cγ and huVHDJH-Cα1 transcripts in COVID-19 mRNA-vaccinated THX mice (n=3, same mice as in Fig. 7e, f) were analyzed for CDR3 length, R:S mutations and huB cell clonal size. Left, CDR3 length distribution in recombined huVHDJH-CH transcripts. Colors denote different antibody isotypes; color gradients denote different THX mice. Middle, huVHDJH-Cμ, huVHDJH-Cγ and huVHDJH-Cα1 huB cell clonal size depicted as scatter plots. Bars depict the mean with s.e.m. Right, means of total, S and R VH mutation frequencies in FR1, CDR1, FR2, CDR2 and FR3 depicted as histograms. R:S data are from one THX mouse representative of 3 THX mice. b–c, Spleen RBD-specific huB cell huVHDJH-CH, huVκJκ and huVλJλ transcripts in 3 additional COVID-19 mRNA-vaccinated THX mice were reverse transcribed and amplified by RT-PCR. Paired huVHDJH and huVκJκ or huVλJλ gene segments from 100 single cells were used to make recombinant human monoclonal antibodies. (b) Left, huVH, huVκ or huVλ gene family member expression in 100 recombinant human monoclonal antibodies, as depicted by pie charts. Colors depict different huVH, huVκ or huVλ gene families; color gradients denote individual gene family members. The 100 human monoclonal antibodies showed predominant utilization of V3, V4 and V1, together with Vκ3, Vκ1 and Vκ2 as well as Vλ1 and Vλ2 genes. Middle, mutation frequency (change/base) of recombined huIgH VHDJH and huIg VκJκ or VλJλ regions in recombinant human monoclonal antibodies, as depicted by scatter plots. Each dot represents a single sequence and the bar depicts the mean with s.e.m. Right, CDR3 length distribution in paired VHDJH and human immunoglobulin VκJκ or VλJλ human monoclonal antibodies. huIgH CDR3 lengths varied between 5 and 25 amino acids, peaking at 12, 13 and 15 amino acids; those of huVκ and huVλ varied between 5 and 13 amino acids, peaking at 9 amino acids. c, Forty-five expressed recombinant human monoclonal antibodies were selected for analysis of paired huIgH and huIgL genes based on their highest RBD-binding activity (> 1.0 OD by specific ELISA). Shown are 27 huIgM (blue), 5 huIgG (red) and 13 huIgA (green) monoclonal antibodies. Consistent with the higher haploid representation of V3, V4 and V1 gene families, V3 genes were the most frequently utilized (35 human monoclonal antibodies), particularly V3-23 (10 human monoclonal antibodies), V3-30 (8), V3-9 (4) and V3-7 (3), followed by V4 (7) and V1 (3) genes. Twenty-two human monoclonal antibodies utilized JH4, 9 JH6 and 6 JH3, with JH1, JH5 and JH2 accounting for the remaining 8 human monoclonal antibodies. Thirty-five human monoclonal antibodies utilized Vκ genes, with Vκ3-11 as the most frequently utilized (8 human monoclonal antibodies) followed by Vκ1-44 (4) and Vκ4-1 (4). Ten human monoclonal antibodies utilized Vλ genes, with Vλ1-44 and Vλ2-14 (2 and 2 human monoclonal antibodies) as the most frequently utilized. Source data
Extended Data Fig. 10
Extended Data Fig. 10. RBD-KLH-vaccinated THX mice mount a class-switched and somatically hypermutated antibody response to SARS-CoV-2 Spike S1 RBD.
a, b, THX mice were injected i.p. with RBD-KLH (100 μg in 100 μl alum) or nil (100 μl alum) on day 0, boosted (100 μg in 100 µl PBS or 100 μl PBS alone) on day 21 and euthanized on day 28. Total serum human immunoglobulin and RBD-specific huIgM, huIgG and huIgA antibodies in RBD-KLH-immunized (n=6) and non-immunized (n=6) THX mice measured by specific ELISAs (total human immunoglobulin concentrations expressed as μg eq ml−1 and RBD-specific human antibody titers as OD readings at different dilutions or RUs). In the histograms, each dot represents an individual mouse and the bar depicts the mean with s.e.m. Statistical significance was assessed by two-sided Student’s unpaired t-test (NS, not significant; **P<0.01, ***P<0.001). c–f, Spleen huB cell huVHDJH-CH transcripts in RBD-KLH-immunized THX mice (n=3 of the 6 as in a–b, THX 488, 490, 492) were analyzed for CDR3 length, clonal expansion and intraclonal diversification. (c) CDR3 length distribution in huVHDJH-CH transcripts. Colors denote different antibody isotypes; color gradients denote different THX mice. (d) huVH mutation frequency (change/base) in huVHDJH-Cγ (2.7+0.08x10⁻², mean+s.e.m.) transcripts depicted as scatter plots (left) and pie charts (middle). Each dot represents a single sequence and the bar depicts the mean with s.e.m. Right, means of total, S and R huVH mutation frequencies in FR1, CDR1, FR2, CDR2 and FR3 of huVHDJH-Cμ and huVHDJH-Cγ transcripts depicted as histograms. R:S data are from one THX mouse representative of 3 THX mice. (e) huVHDJH-Cμ and huVHDJH-Cγ huB cell clonal size and diversity in RBD-KLH-immunized THX mice (THX 488, 490, 492) depicted as scatter plots. Bars depict the mean with s.e.m. (f) huVHDJH-Cμ and huVHDJH-Cγ huB cell clones and intraclonal diversification, as depicted by TreeMaps and phylogenetic trees. Individual rectangle or square (unique color) area reflects huB cell clone size. In THX mice 488, 490 and 492, the 20 largest huVHDJH-Cμ and huVHDJH-Cγ huB cell clones accounted for about one-tenth of huVHDJH-Cμ huB cells and one-fourth of huVHDJH-Cγ huB cells. Source data

References

    1. Zschaler, J., Schlorke, D. & Arnhold, J. Differences in innate immune response between man and mouse. Crit. Rev. Immunol.34, 433–454 (2014). - PubMed
    1. Allen, T. M. et al. Humanized immune system mouse models: progress, challenges and opportunities. Nat. Immunol.20, 770–774 (2019). - PMC - PubMed
    1. Shultz, L. D. et al. Humanized mouse models of immunological diseases and precision medicine. Mamm. Genome30, 123–142 (2019). - PMC - PubMed
    1. Stripecke, R. et al. Innovations, challenges, and minimal information for standardization of humanized mice. EMBO Mol. Med.12, e8662 (2020). - PMC - PubMed
    1. Martinov, T. et al. Building the next generation of humanized hemato-lymphoid system mice. Front. Immunol.12, 643852 (2021). - PMC - PubMed