. 2024 Aug;30(8):2265-2276.
doi: 10.1038/s41591-024-03067-7. Epub 2024 Jun 25.

Strain-specific gut microbial signatures in type 2 diabetes identified in a cross-cohort analysis of 8,117 metagenomes

Affiliations

Strain-specific gut microbial signatures in type 2 diabetes identified in a cross-cohort analysis of 8,117 metagenomes

Zhendong Mei et al. Nat Med. 2024 Aug.

Abstract

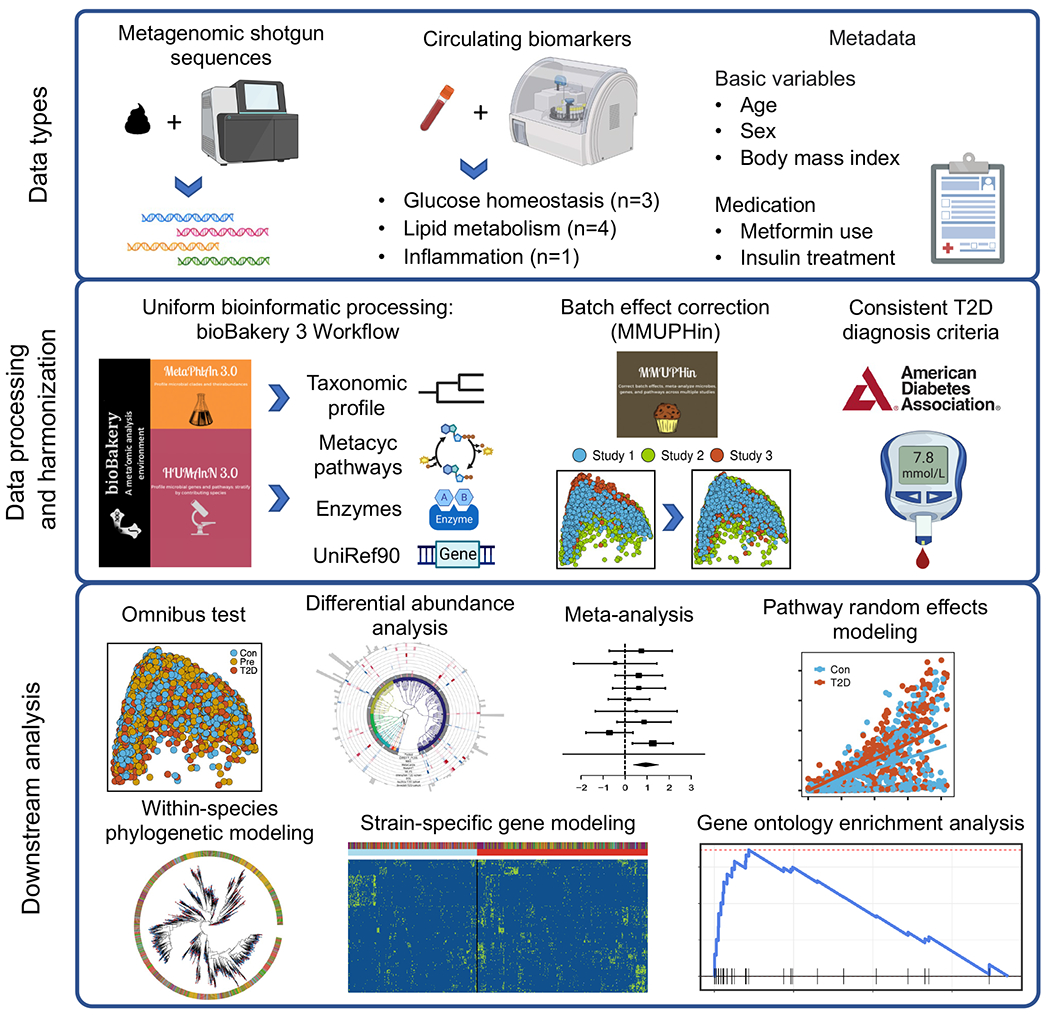
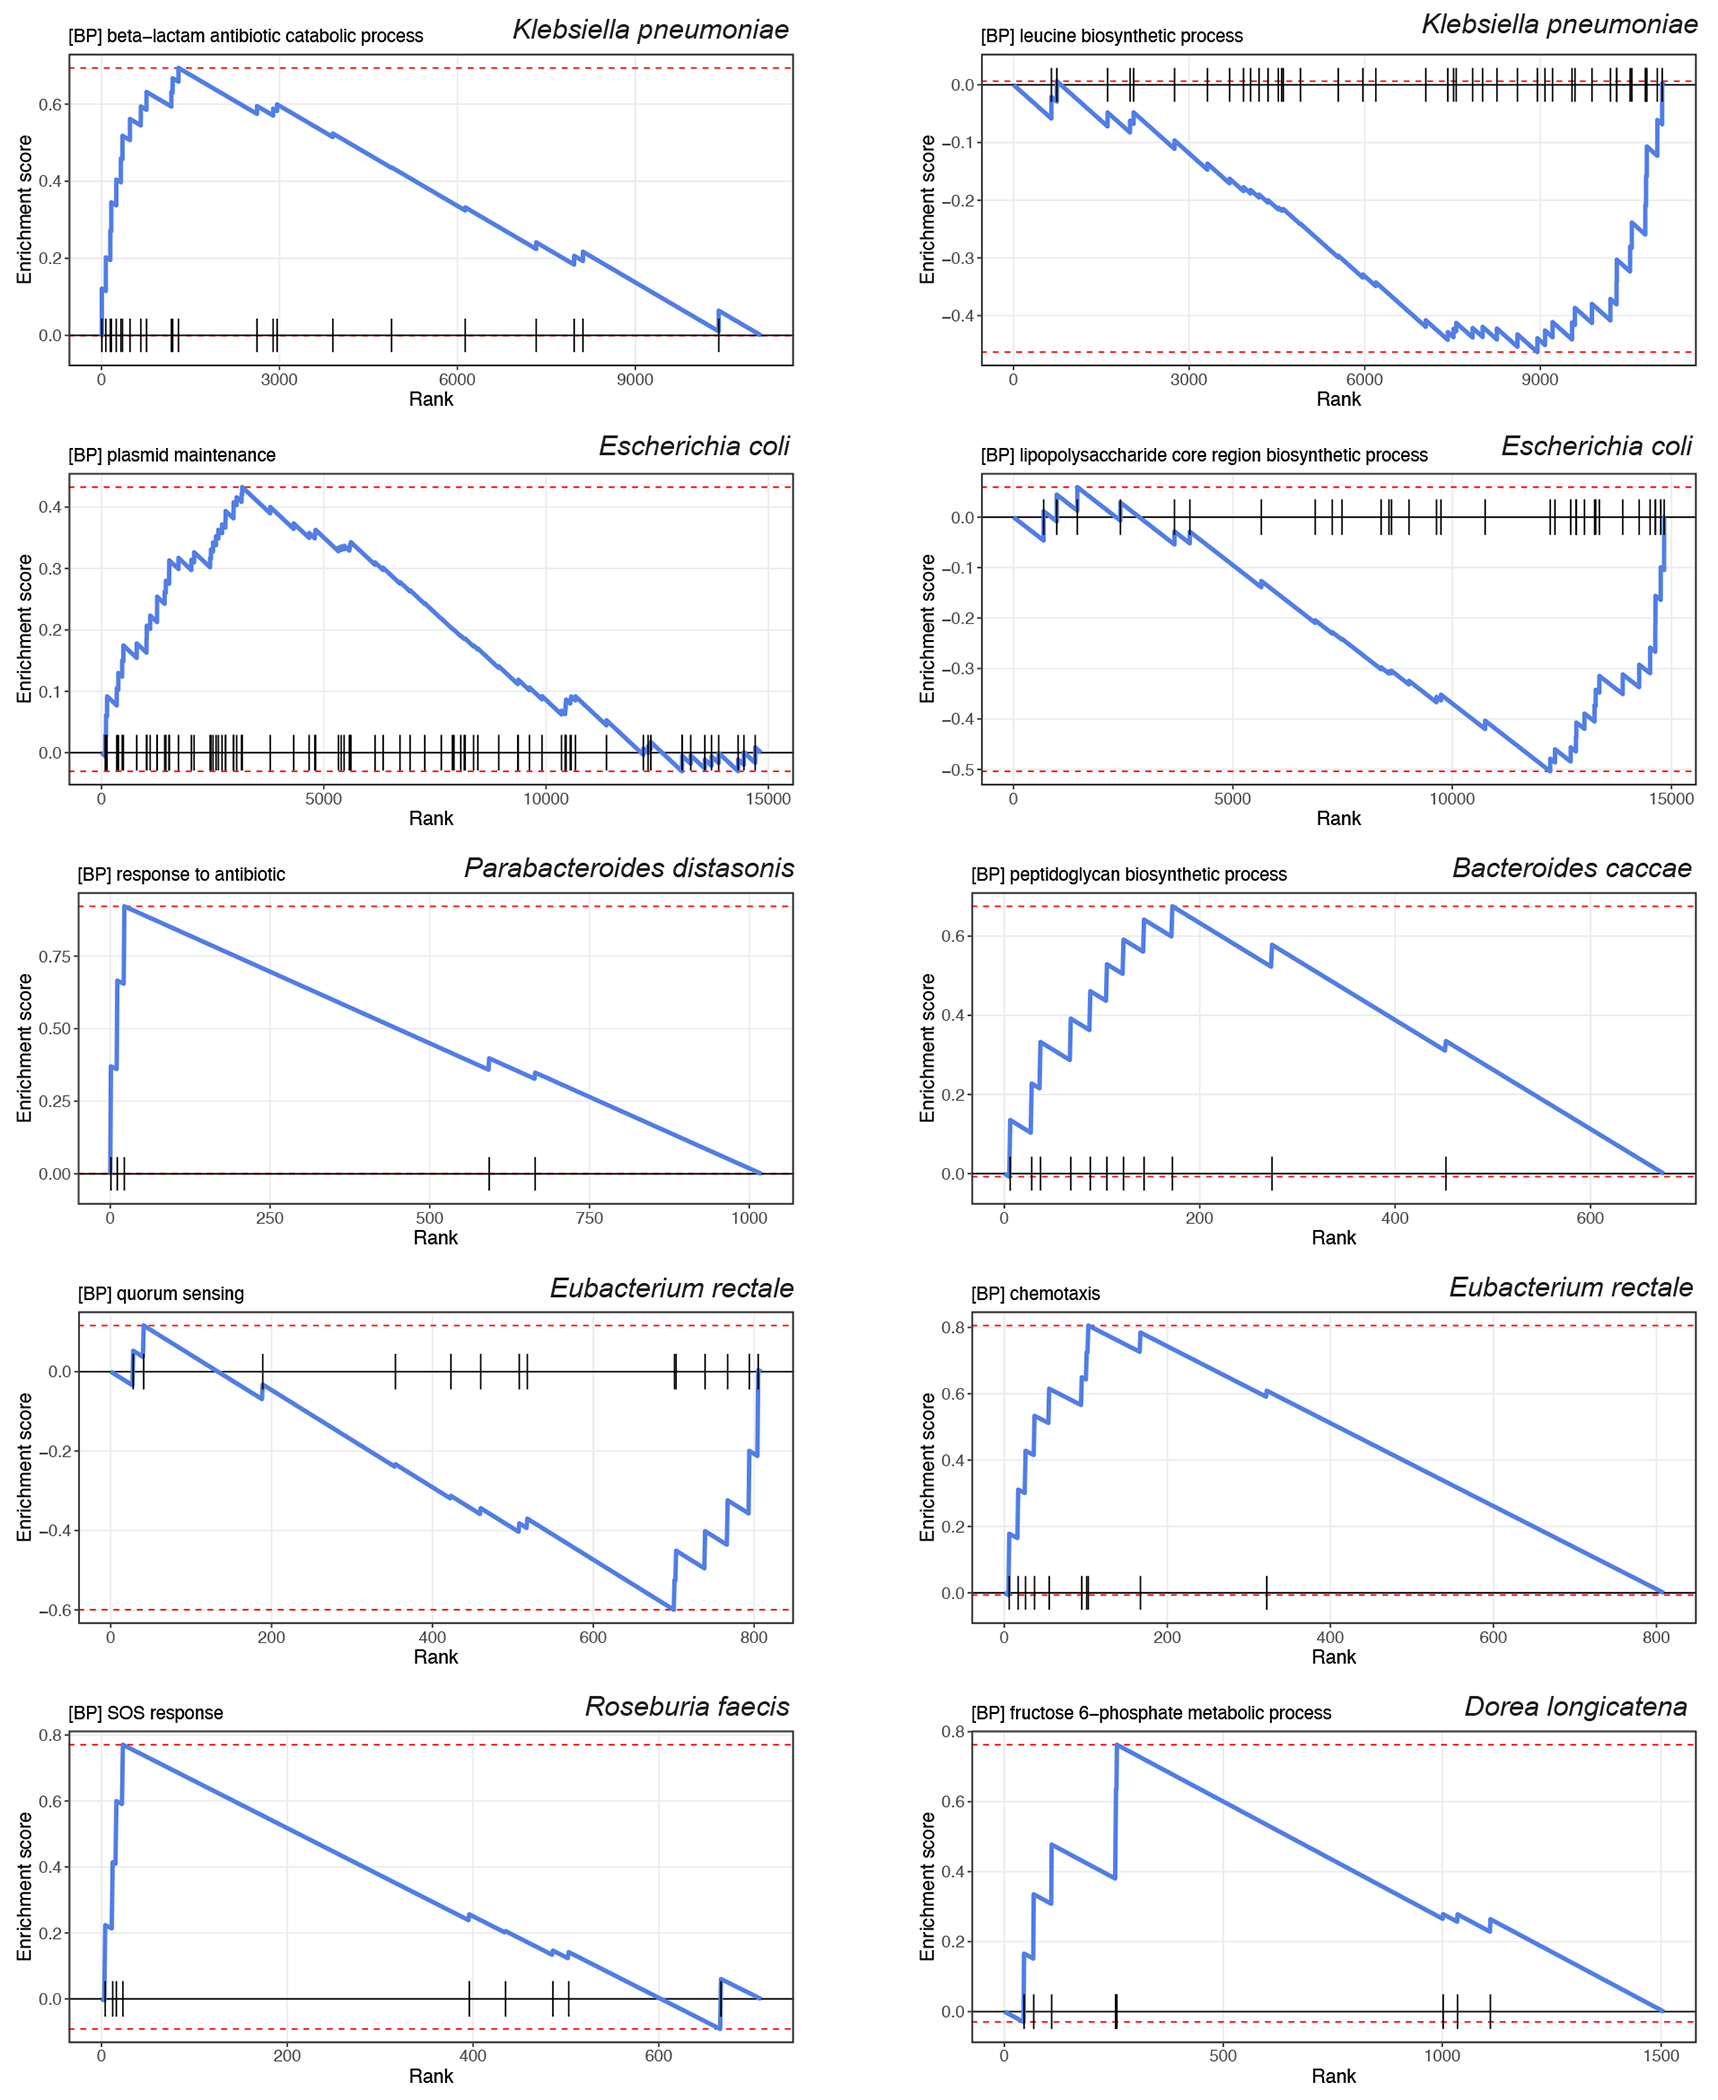
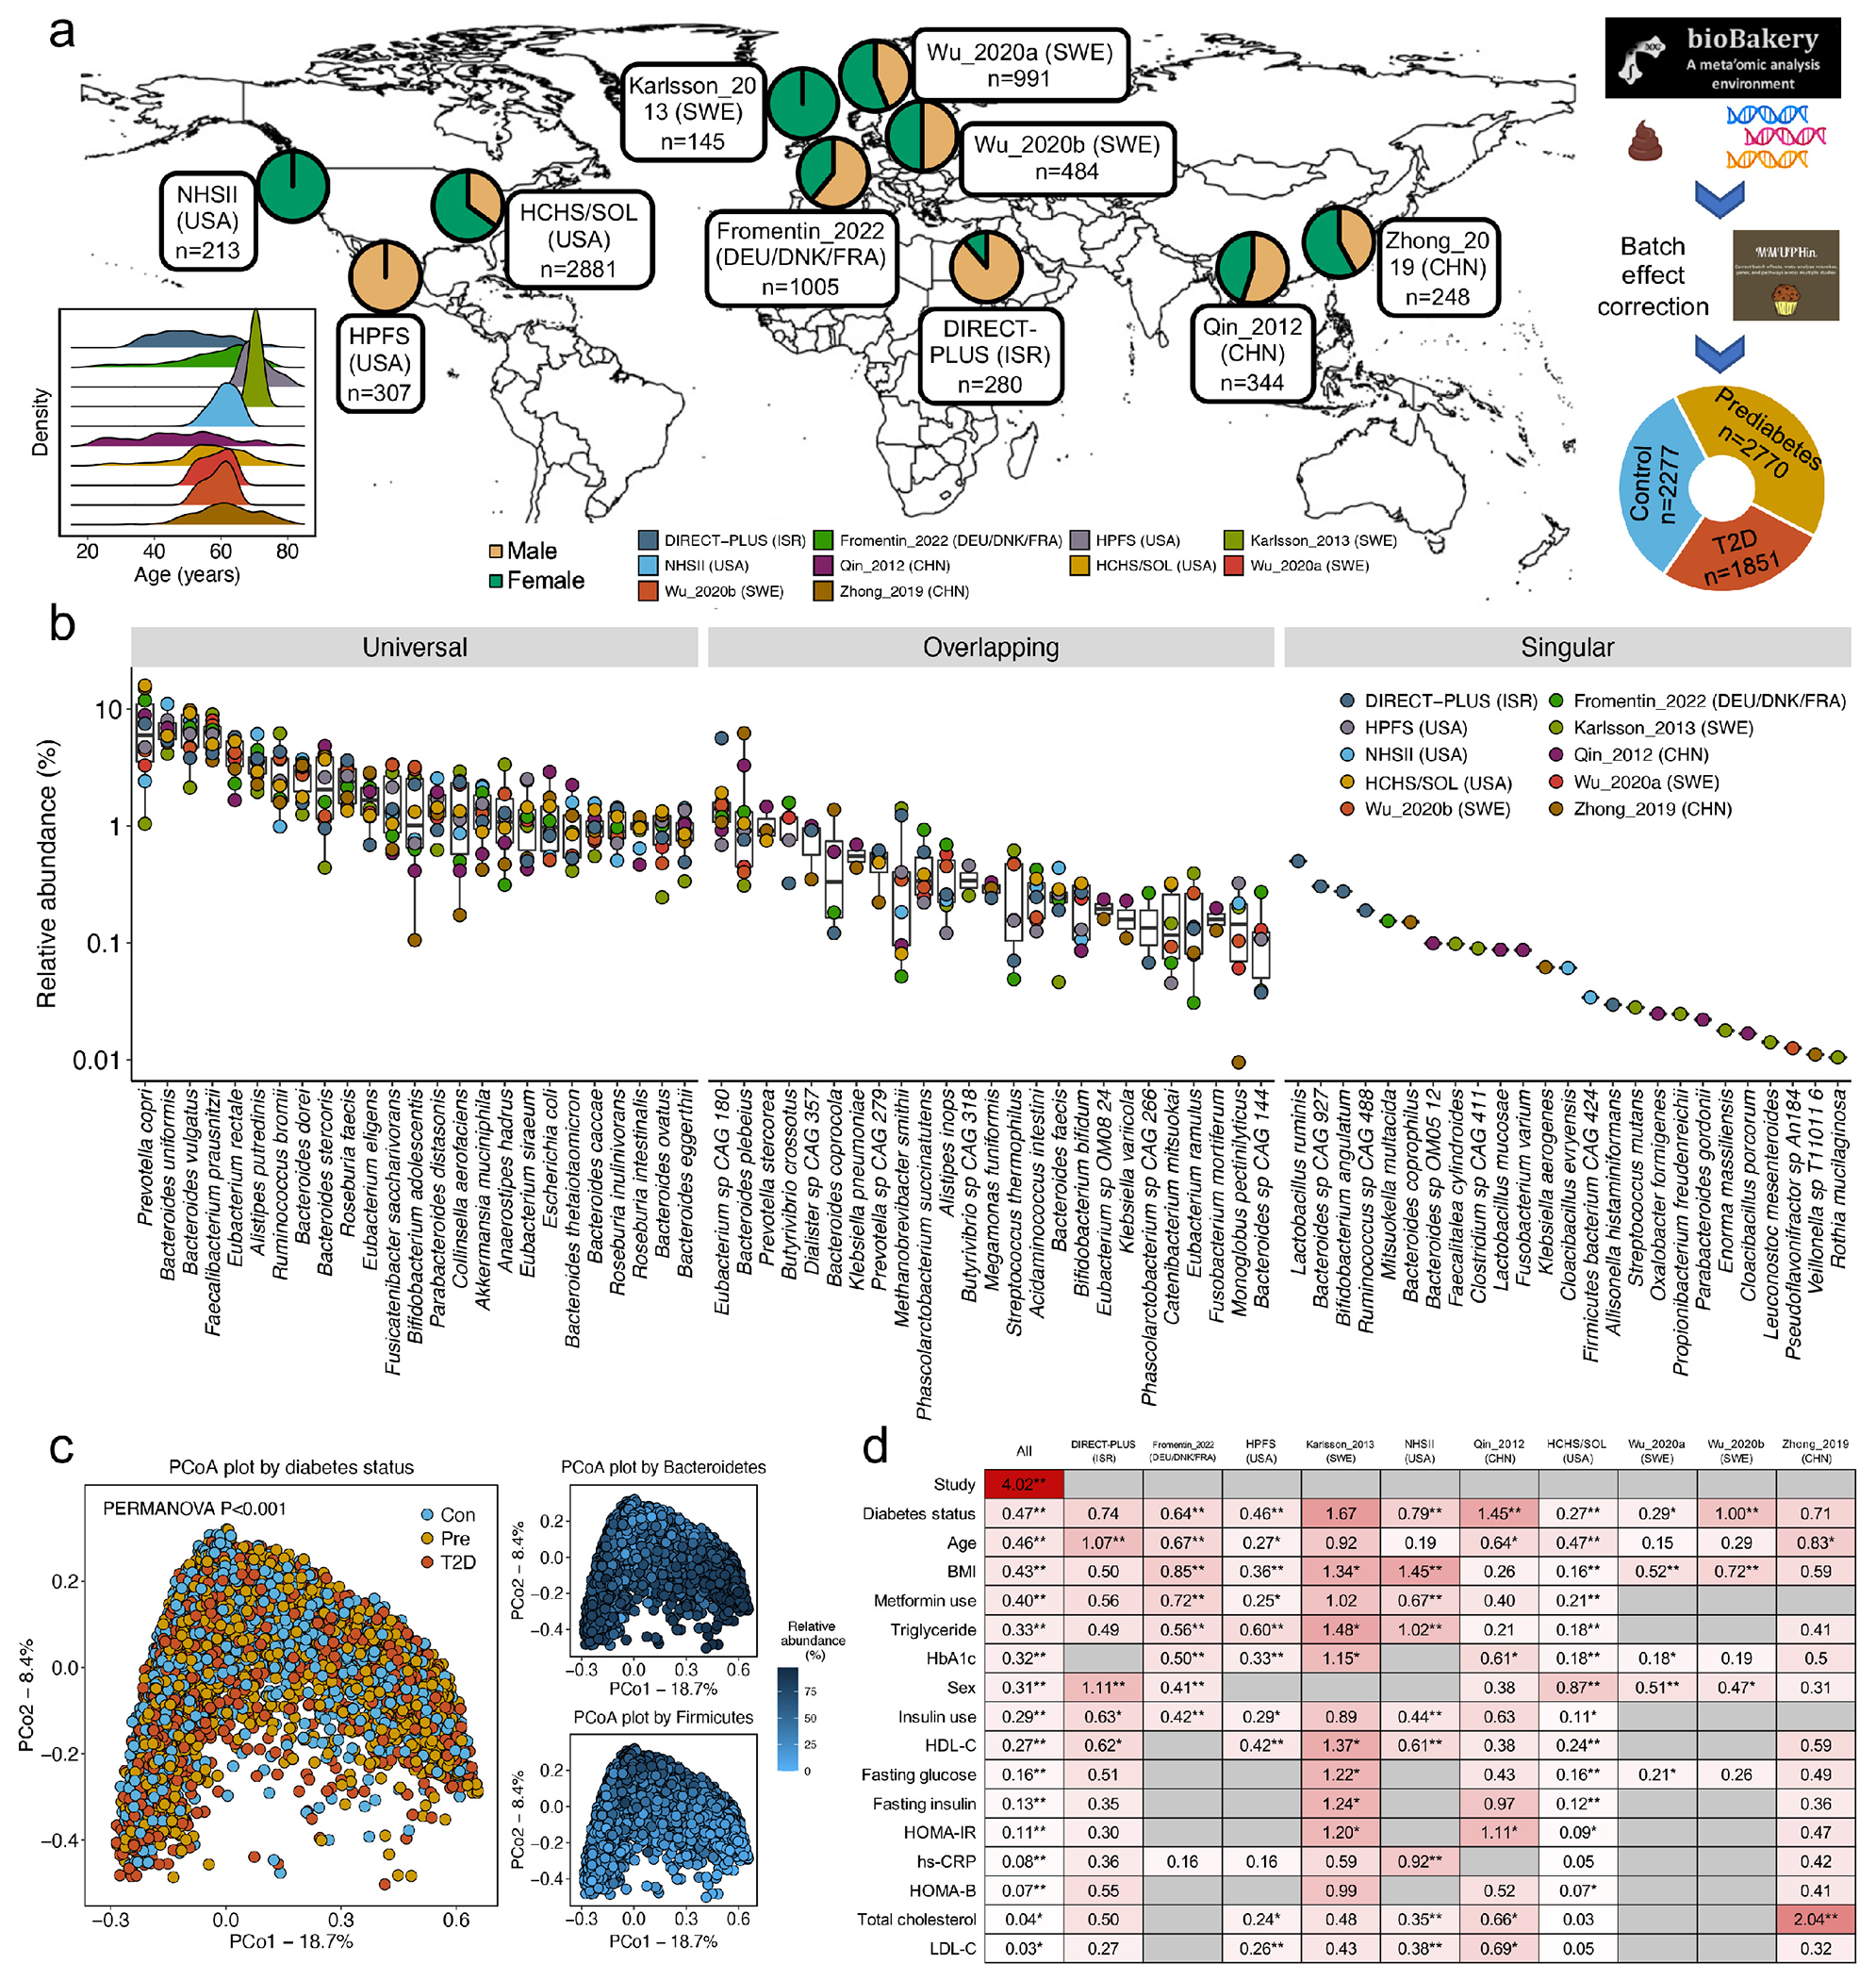
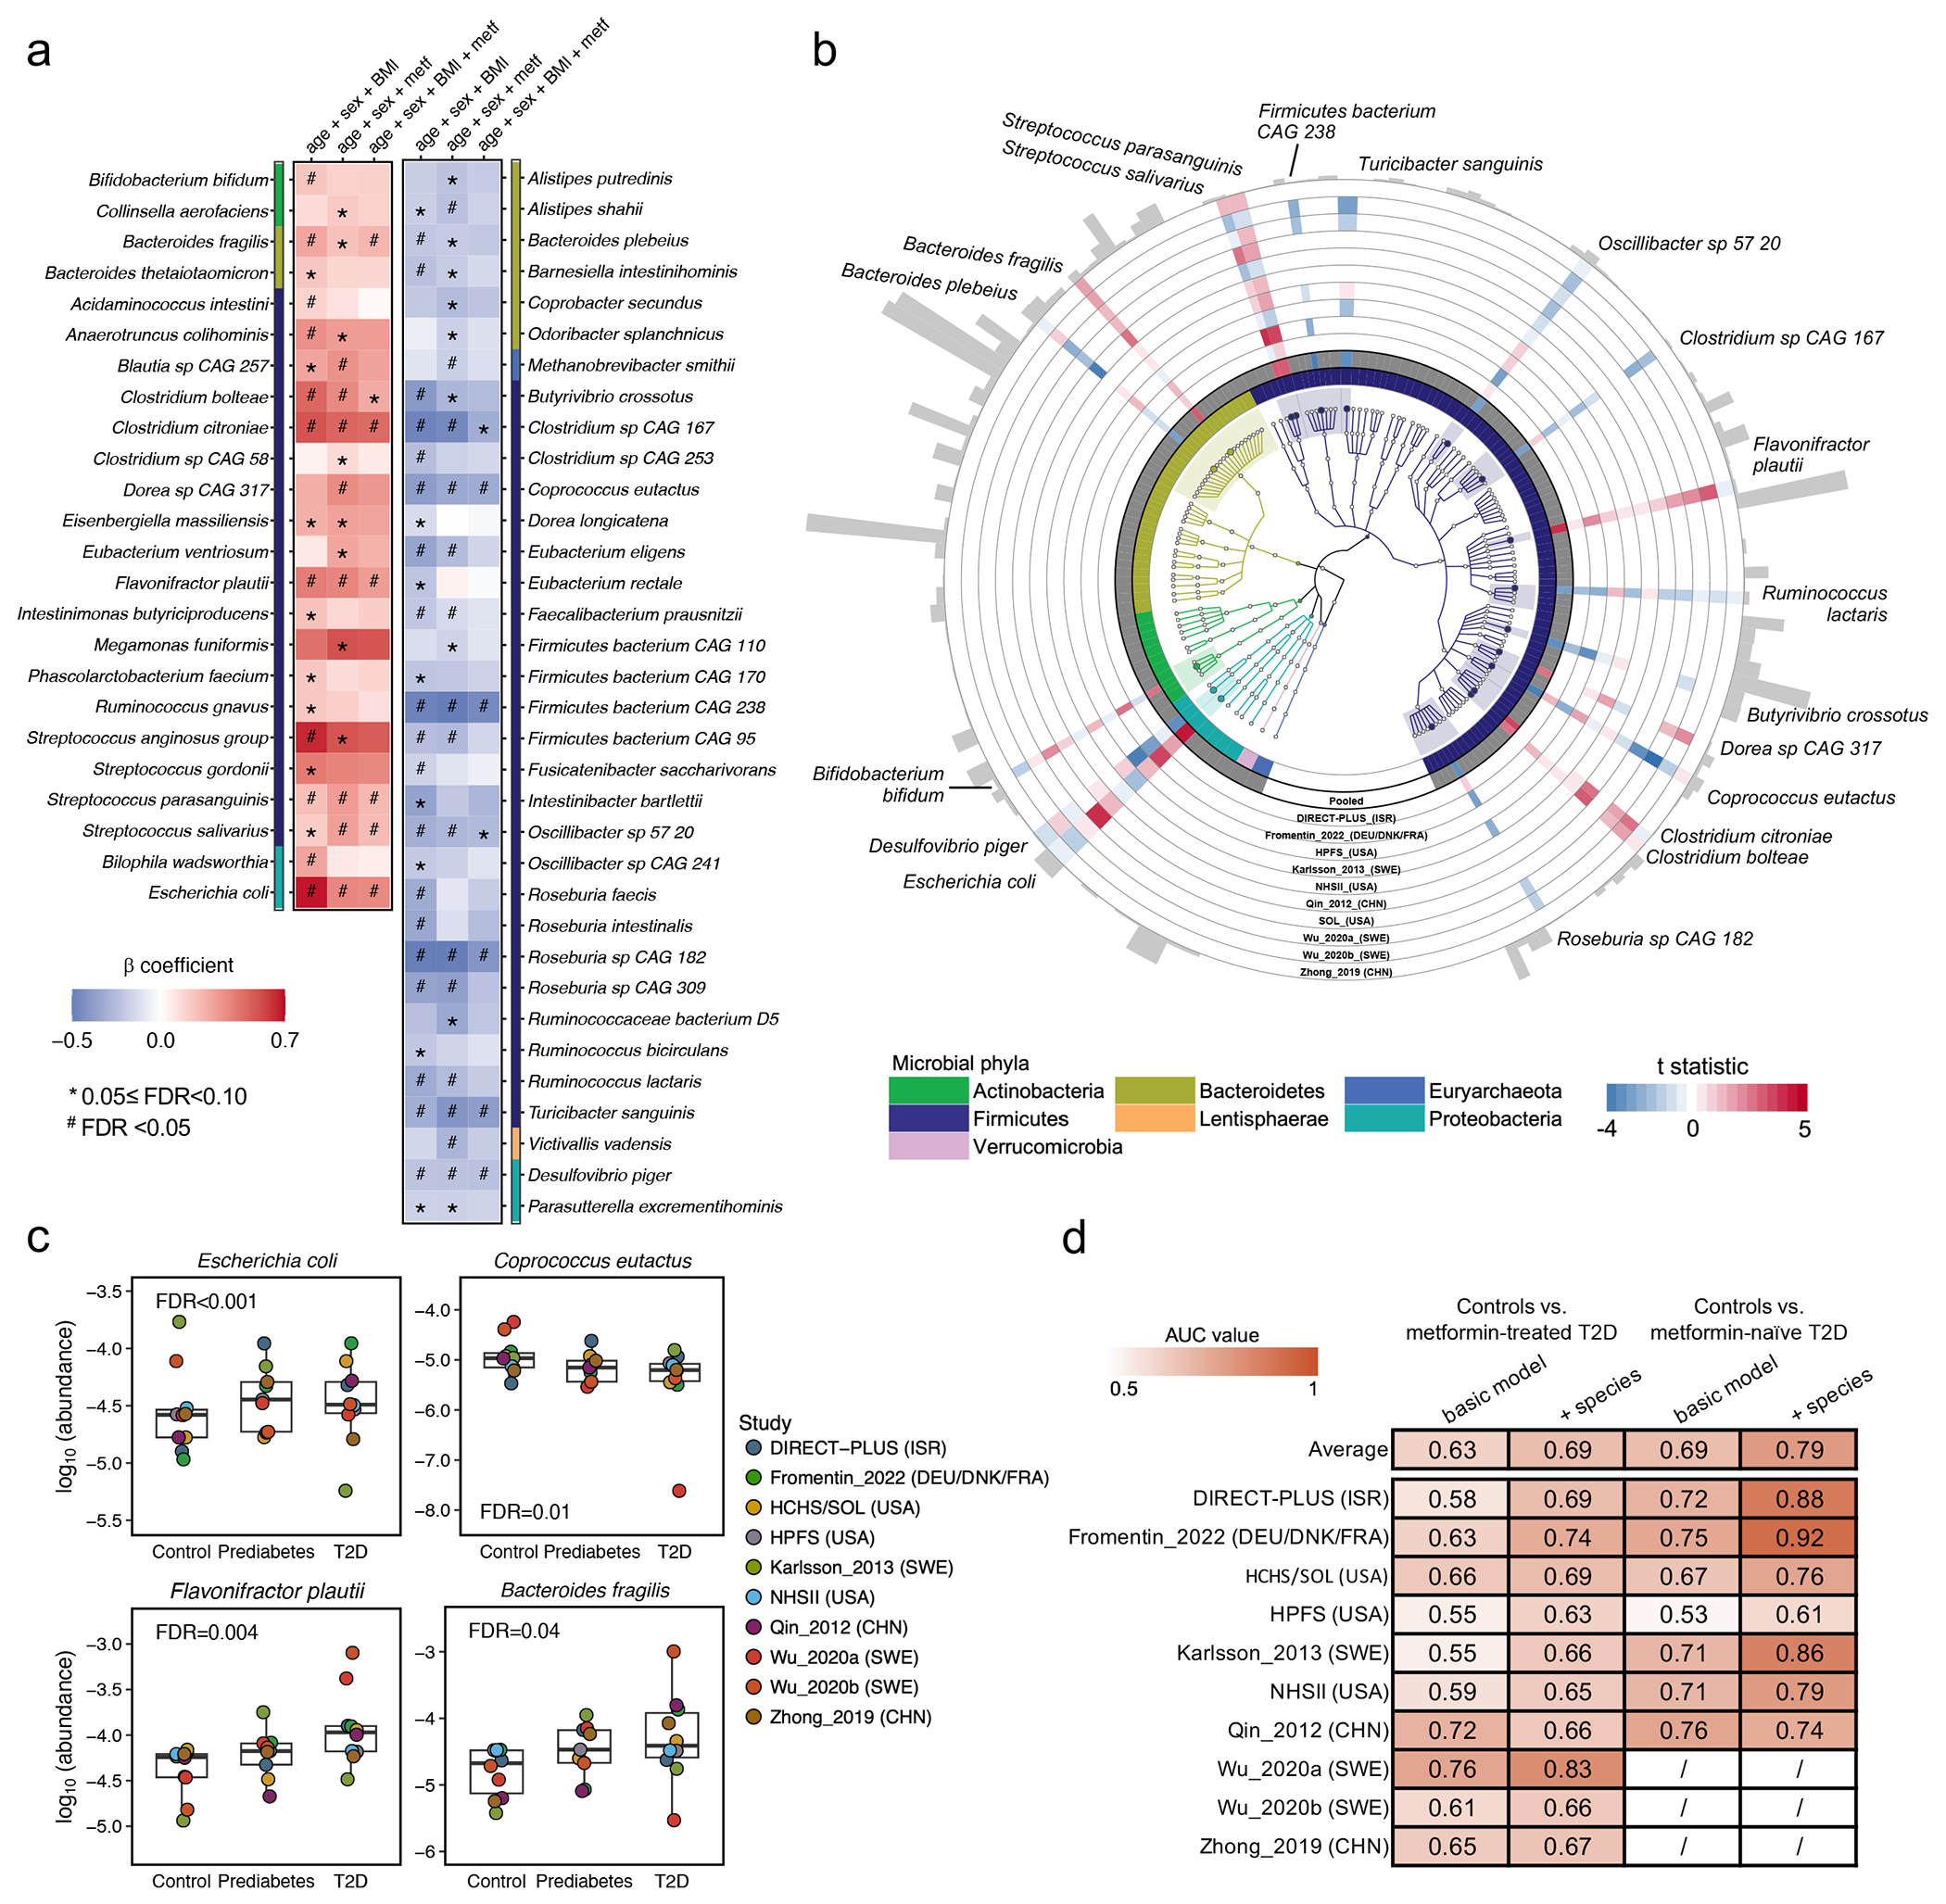
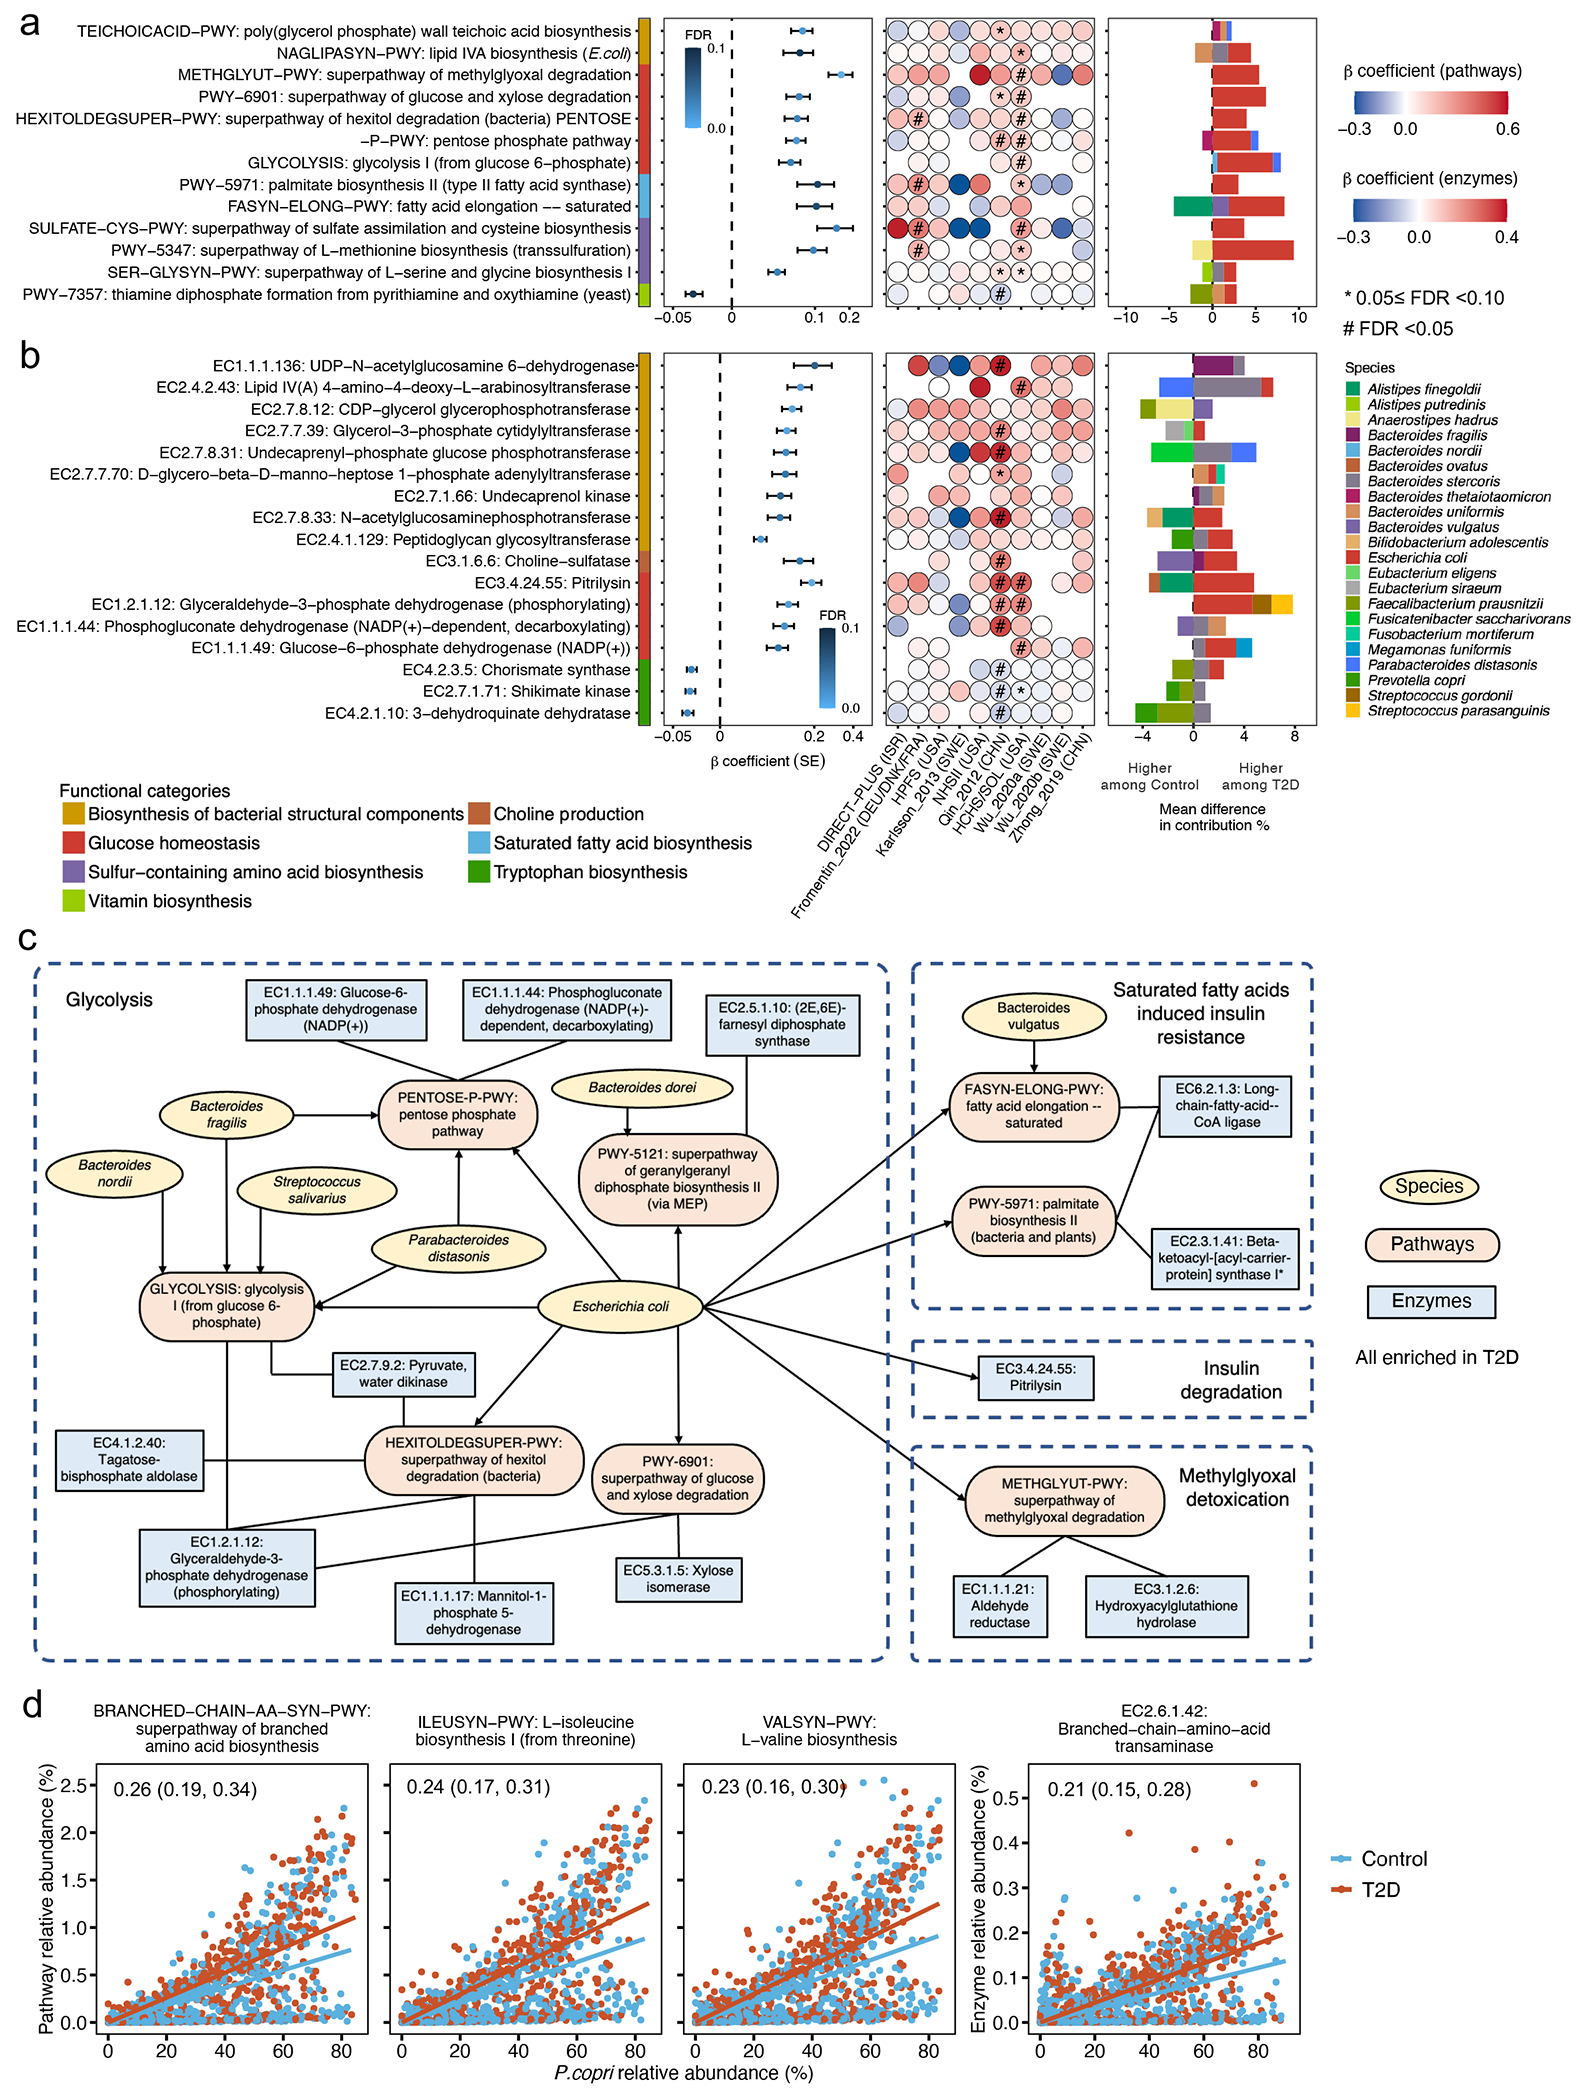
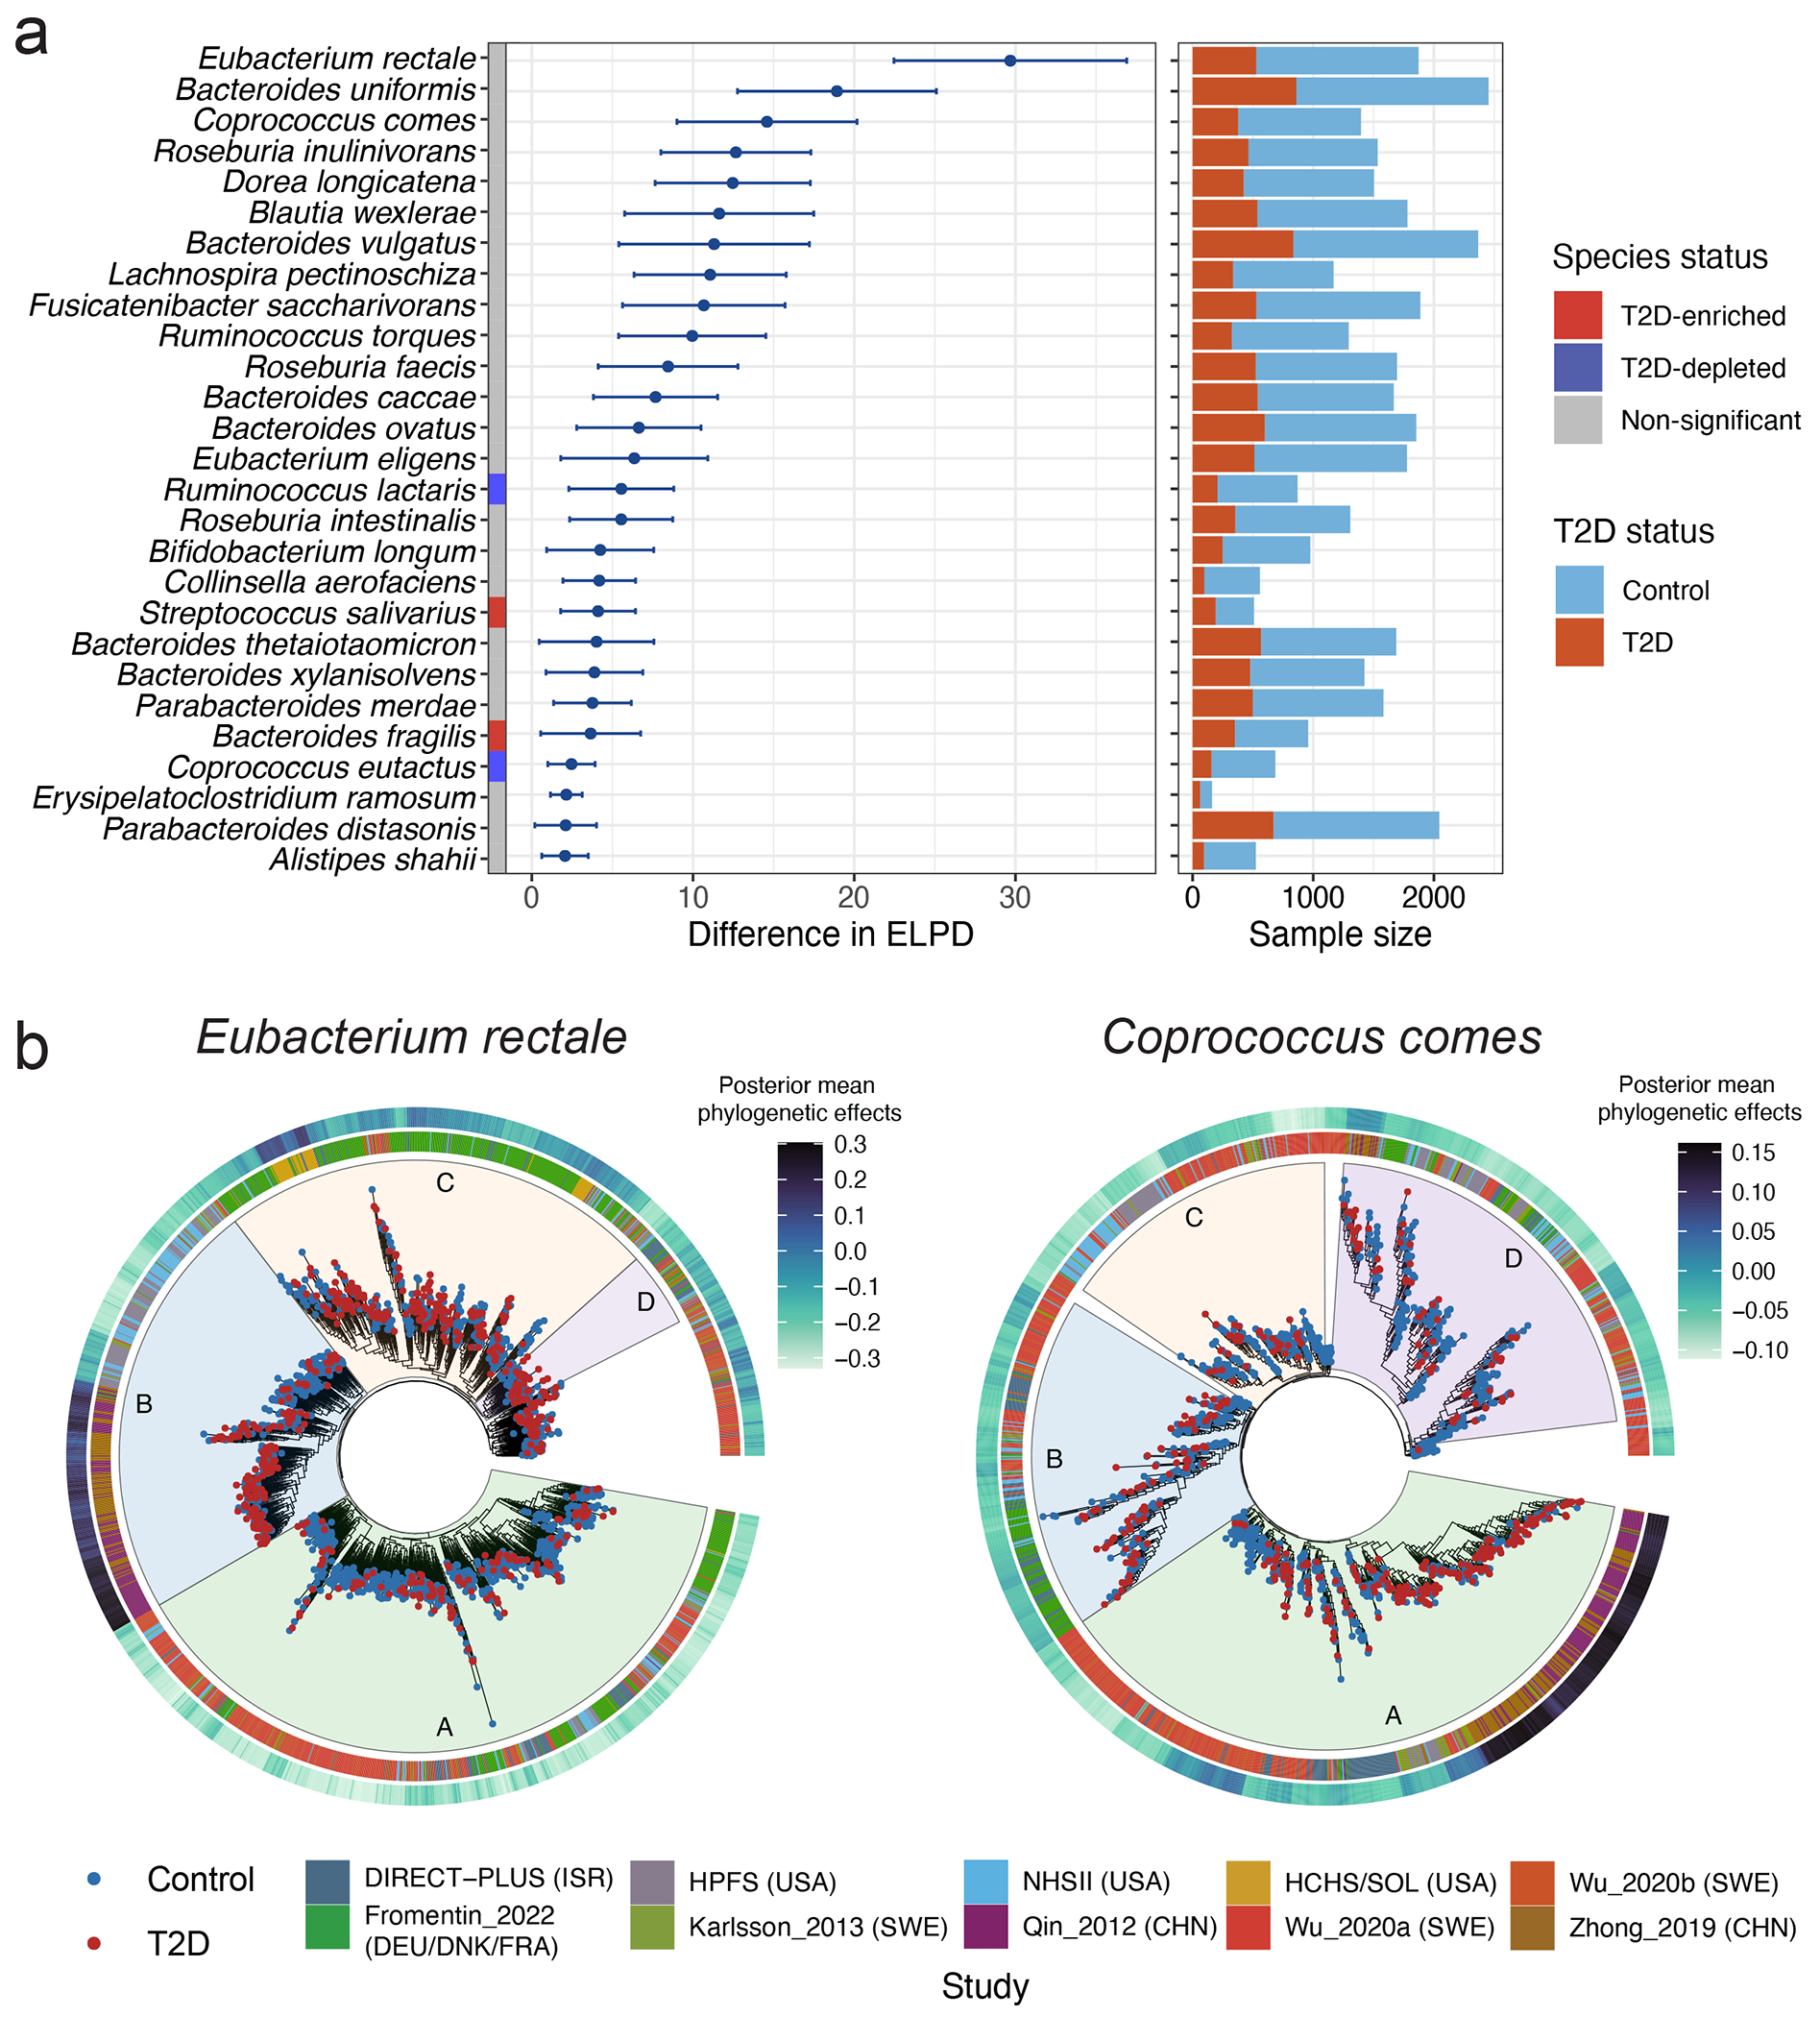
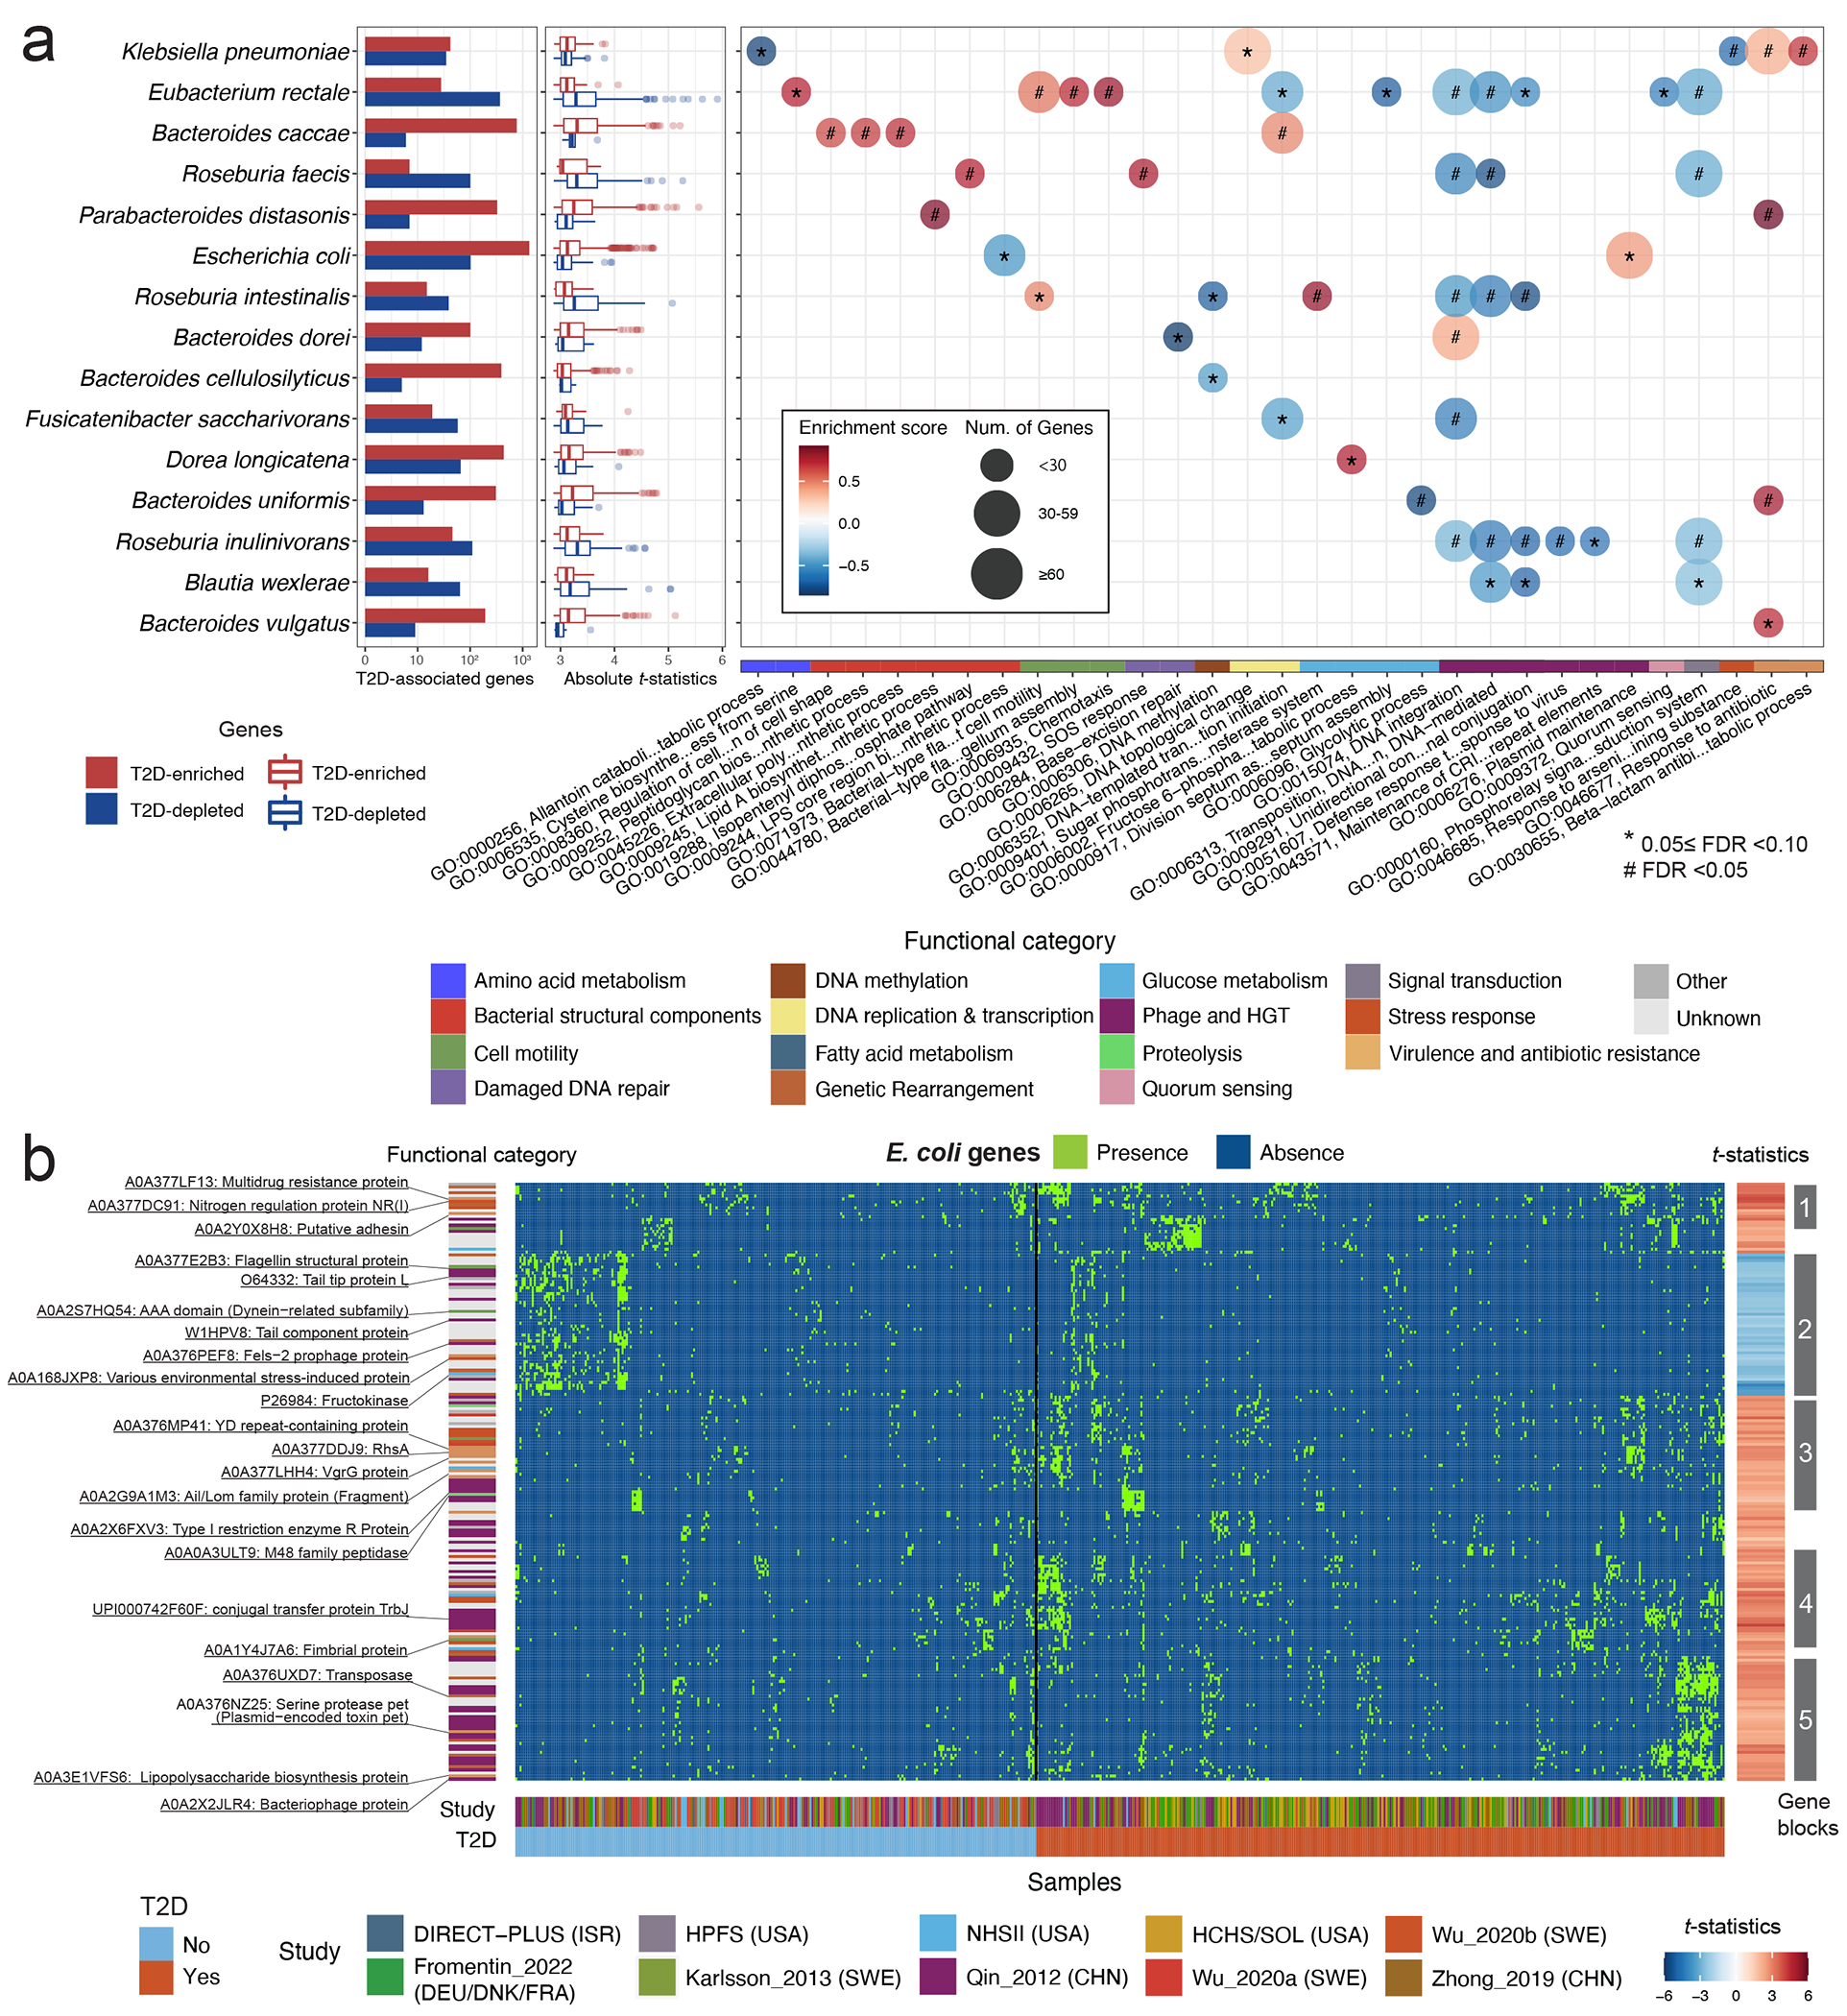
The association of gut microbial features with type 2 diabetes (T2D) has been inconsistent due in part to the complexity of this disease and variation in study design. Even in cases in which individual microbial species have been associated with T2D, mechanisms have been unable to be attributed to these associations based on specific microbial strains. We conducted a comprehensive study of the T2D microbiome, analyzing 8,117 shotgun metagenomes from 10 cohorts of individuals with T2D, prediabetes, and normoglycemic status in the United States, Europe, Israel and China. Dysbiosis in 19 phylogenetically diverse species was associated with T2D (false discovery rate < 0.10), for example, enriched Clostridium bolteae and depleted Butyrivibrio crossotus. These microorganisms also contributed to community-level functional changes potentially underlying T2D pathogenesis, for example, perturbations in glucose metabolism. Our study identifies within-species phylogenetic diversity for strains of 27 species that explain inter-individual differences in T2D risk, such as Eubacterium rectale. In some cases, these were explained by strain-specific gene carriage, including loci involved in various mechanisms of horizontal gene transfer and novel biological processes underlying metabolic risk, for example, quorum sensing. In summary, our study provides robust cross-cohort microbial signatures in a strain-resolved manner and offers new mechanistic insights into T2D.


Conflict of interest statement

Competing interests

C.H. is a member of the scientific advisory board for Zoe Nutrition, Empress Therapeutics, and Seres Therapeutics. The other authors declare no competing interests.

Figures

Extended Data Fig. 1:
Extended Data Fig. 1:. Workflow.
We adjusted for the study effect by adopting a conservative meta-analysis approach in the downstream analyses. Our analyses examined the overall microbial community structure, specific microbial taxonomic and functional features, strain-specific biochemical pathways, and within-species phylogeny and gene families in a cross-cohort meta-analysis framework. This figure was created with BioRender.com.
Extended Data Fig. 2:
Extended Data Fig. 2:. Principal coordinate analysis of all samples using species-level Bray-Curtis dissimilarity colored by cohorts before and after correcting batch and study effects.
R2 values are calculated from permutational multivariate analysis of variance (PERMANOVA, n = 999 permutations) and indicate the variance attributable to study and batch effects.
Extended Data Fig. 3:
Extended Data Fig. 3:. Comparisons in associations between microbial species and type 2 diabetes (T2D) across different statistical models.
Meta-analyzed associations of individual microbial species with T2D phenotype from the ordinal (a) and binary (b) models. The ordinal model modeled the disease status as an ordinal variable (T2D, prediabetes, or controls) and used data from all the participants. The binary model modeled the disease status as a binary variable (T2D or controls) and used data from T2D patients and normoglycemic controls. The blue-to-red and purple-to-orange gradients represent the magnitude and direction of the associations as quantified by meta-analyzed beta coefficients from linear mixed models adjusted for age, sex, and body mass index (BMI) and further adjusted for metformin use in MaAsLin2. All the results were corrected for multiple hypothesis testing by controlling the false discovery rate (FDR) using the Benjamini-Hochberg method with a target rate of 0.10. All models included each participant’s identifier as random effects and simultaneously adjusted for covariables. (c) Comparisons in associations between microbial species and T2D between multivariate MaAsLin2 models with and without further adjustment for BMI and metformin use from the ordinal model. (d) Comparisons in associations between microbial species and T2D between multivariate MaAsLin2 models with and without further adjustment for BMI and metformin use from the binary model. Dots in the scatter plots in (c) and (d) represent meta-analyzed beta coefficients from linear mixed models adjusted for covariables in MaAsLin2. All the statistical tests were two-sided. A total of 8,117 metagenomes from 1,851 T2D patients, 2,770 individuals with prediabetes, and 2,277 normoglycemic controls were included in the analyses in (a), (b), and (c). Abbreviations: BMI, body mass index; Con, control; metf, metformin use; insul, insulin use; T2D, type 2 diabetes.
Extended Data Fig. 4:
Extended Data Fig. 4:. Metformin has a direct impact on the gut microbiome composition and confounds the associations between microbial species and type 2 diabetes.
(a) Distance-based redundancy analysis (dbRDA) based on species-level Bray-Curtis dissimilarity colored by type 2 diabetes (T2D) and metformin use. The centers of the boxplot show medians with boxes indicating their inter-quartile ranges (IQRs) and upper and lower whiskers indicating 1.5 times the IQR from above the upper quartile and below the lower quartile, respectively. (b) Meta-analyzed and cohort-specific associations of microbial species with metformin use among T2D patients. We defined microbial signatures of metformin as those significantly associated with metformin use in T2D cases only but not associated with T2D after further adjusting for metformin use in all participants. We also identified 7 species associated with both metformin use and T2D. The centers of the error bars represent the β coefficients of the associations, and the error bars represent their standard errors. (c) Our modeling approach effectively accounted for the potential confounding effect of metformin use, as evidenced by the high correlation between the beta coefficients of species-T2D associations obtained in the primary analysis and those calculated in a sensitivity analysis excluding T2D patients treated with metformin. The beta coefficients in (b) and (c) represent the associations quantified by linear mixed models, adjusting for age, sex, body mass index, and metformin use where appropriate, in MaAsLin2. All the results were corrected for multiple hypothesis testing by controlling the false discovery rate (FDR) using the Benjamini-Hochberg method with a target rate of 0.10. All the analyses in (a), (b), and (c) were based on 5,114 metagenomes from 1,851 T2D patients and 2,277 normoglycemic controls. The statistical tests in (a) and (b) were two-sided. Abbreviations: Con, control; metf, metformin use; T2D, type 2 diabetes.
Extended Data Fig. 5:
Extended Data Fig. 5:. Sensitivity analyses demonstrate that identified microbial features of type 2 diabetes are unlikely to reflect the duration or comorbidities of this disease.
(a) Comparisons in associations between microbial species and T2D in one analysis that includes all study participants and the other that excludes individuals with prevalent T2D in the Hispanic Community Health Study/Study of Latinos. (b) Comparisons in associations between microbial species and T2D in one analysis that includes all study participants and the other analysis that excludes insulin-treated T2D patients. The dots represent the associations quantified by linear mixed models, adjusting for age, sex, body mass index, and metformin use in MaAsLin2. Abbreviation: T2D, type 2 diabetes.
Extended Data Fig. 6:
Extended Data Fig. 6:. Associations of microbial features with circulating metabolic and inflammation biomarkers.
(a) Meta-analyzed associations of individual MetaCyc pathways with circulating biomarkers of metabolic risk. (b) Meta-analyzed associations of individual microbial enzymes with circulating biomarkers of metabolic risk. Only pathways and enzymes listed in Figure 3 were analyzed and presented in this figure. The blue-to-red gradients represent the magnitude and direction of the associations as quantified by meta-analyzed beta coefficients from linear mixed models adjusted for age, sex, body mass index, and metformin use in MaAsLin2. All the results were corrected for multiple hypothesis testing by controlling the false discovery rate (FDR) using the Benjamini-Hochberg method with a target rate of 0.10. Abbreviations: BMI, body mass index; HbA1c, hemoglobin A1c; HDL-C, high-density lipoprotein cholesterol; hs-CRP, high-sensitivity C-reactive protein; HOMA-B, homeostasis model assessment of β-cell function; HOMA-IR, homeostasis model assessment of insulin resistance; LDL-C, low-density lipoprotein cholesterol; TG, triglyceride.
Extended Data Fig. 7:
Extended Data Fig. 7:. Prevotella copri’s differential carriage of branched-chain amino acid biosynthesis function is explained by its discrete subclade structure.
(a) Distribution of different P. copri subclades across geographic regions and studies. We applied MetaPhlAn taxonomic profiling based on P. copri subclade-specific marker genes to detect the presence of a subclade in metagenomes. (b) Comparisons in adjusted relative abundance of branched-chain amino acid (BCAA) biosynthesis pathways and enzyme encoded by P. copri subclades dominated by Clade A vs. other clades. The adjusted relative abundance of pathways and enzymes is estimated by Anpan (ANalysis of microbial Phylogenies And geNes)’s pathway random effects models (Methods) with simultaneous adjustment for age, sex, study, body mass index, metformin use, and the abundance of P. copri subclades. The centers of the boxplot show medians of adjusted relative abundance with boxes indicating their inter-quartile ranges (IQRs) and upper and lower whiskers indicating 1.5 times the IQR from above the upper quartile and below the lower quartile, respectively. P-values were generated from two-sided t-tests based on the adjusted relative abundance. (c) Clade A-dominant P. copri strains in T2D patients were more likely to retain pathways and enzymes of branched-chain amino acid biosynthesis compared to Clade A-dominant non-T2D controls. The blue and red lines, fitted by linear regression in participants with T2D and control participants separately, represent the associations between the log-transformed relative abundance of P. copri subclade and the log-transformed relative abundance of a given pathway or enzyme encoded by P. copri. The numeric values in the top left corner are posterior differences and 98% posterior intervals of differences in log-transformed pathway abundance between case-control status, as determined by mixed effects models Anpan (Methods). This model allows us to identify microbial functions encoded by a P. copri subclade that are differentially abundant between T2D cases vs. controls while controlling for its subclade-level abundance and covariables. All the analyses in (a), (b), and (c) were based on 5,114 metagenomes from 1,851 T2D patients and 2,277 normoglycemic controls.
Extended Data Fig. 8:
Extended Data Fig. 8:. Phylogenetic trees of select species show divergent associations between subclades and T2D within each species.
The annotation bars represent metformin use, study, BMI, sex, age, and T2D status, respectively. The boxplots in the bottom represent the posterior mean of the phylogenetic effect of each phylogenetic tree leaf (metagenome) estimated by the phylogenetic generalized linear mixed models (PGLMMs) in Anpan (ANalysis of microbial Phylogenies And geNes, see Methods) with whiskers representing the 95% credible intervals of the posterior means. By applying PGLMMs, we compared two generalized linear mixed models with and without incorporating within-species phylogeny as a random effect (Methods). Both models were adjusted for age, sex, body mass index, metformin use, and study membership as fixed effects. We generated within-species phylogenetic trees by randomly splitting the edges based on the Euclidean similarity matrix derived from clustered sets of protein sequences (UniRef90 gene families) after dimension reduction by principal components analysis.
Extended Data Fig. 9:
Extended Data Fig. 9:. Gene set enrichment analysis of gene ontology terms for biological process.
The line plots show the running enrichment score for the gene ontology (GO) term as the analysis “walks down” the ranked list. The vertical black lines on the X-axis show where members of the GO term appear in the ranked list of UniRef90 gene families.
Fig 1:
Fig 1:. Overview of microbial community structure as associated with type 2 diabetes.
(a) To study the gut microbiome in type 2 diabetes (T2D), we assembled a shotgun metagenomic dataset from ten cohorts spanning eight countries. The dataset comprised 8,117 metagenomes from 1,851 T2D patients, 2,770 individuals with prediabetes, and 2,277 normoglycemic controls from our newly established Microbiome and Cardiometabolic Disease Consortium (MicroCardio). The study population included females and males (females: 54.4%) spanning a wide range of ages (mean =57.9 years) and body mass index (mean =28.6 kg/m2), and diverse racial/ethnic subgroups such as Asians, Whites, and Latin American-born US Hispanic immigrants. We applied the bioBakery 3.0 workflows to process sequencing data for uniform taxonomic and functional profiling and the MMUPHin framework to correct batch effects. This panel was created with BioRender.com. (b) Mean relative abundance for top 25 universal (present in all ten cohorts), overlapping (present in at least two cohorts), and singular (found in only one cohort) species by cohort. The centers of the boxplot show medians with boxes indicating their interquartile ranges (IQRs) and upper and lower whiskers indicating 1.5 times the IQR from above the upper quartile and below the lower quartile, respectively. (c) Principal coordinate analysis (PCoA) revealed a significant association between the configuration of the microbiome and T2D and an expected trade-off between Bacteroidetes and Firmicutes phyla. PCoA was based on species-level Bray-Curtis dissimilarity. (d) Proportions of variation in taxonomy explained by the study effects, T2D status, covariables, and circulating biomarkers as quantified by permutational multivariate analysis of variance (PERMANOVA with 999 permutations) based on species-level Bray-Curtis dissimilarity. Data on metformin use were unavailable in the three studies (Wu_2020a, Wu_2020b, and Zhong_2019) because they only enrolled newly-diagnosed, treatment-naïve participants with T2D and prediabetes. All the statistical tests were two-sided. An asterisk sign indicates P <0.05, and two asterisk signs indicate P <0.01. Abbreviations: BMI, body mass index; Con, control; HbA1c, hemoglobin A1c; HDL-C, high-density lipoprotein cholesterol; hs-CRP, high-sensitivity C-reactive protein; HOMA-B, homeostasis model assessment of β-cell function; HOMA-IR, homeostasis model assessment of insulin resistance; LDL-C, low-density lipoprotein cholesterol; Pre, prediabetes; T2D, type 2 diabetes.
Fig. 2:
Fig. 2:. Cross-cohort microbial signatures of type 2 diabetes.
(a) Meta-analyzed associations of microbial species with type 2 diabetes (T2D) based on 8,117 metagenomes from 1,851 T2D patients, 2,770 individuals with prediabetes, and 2,277 normoglycemic controls. The blue-to-red gradient represents the magnitude and direction of the associations quantified by linear mixed models that include disease status as an ordinal variable (normoglycemic controls, prediabetes, or T2D) and adjust for age, sex, body mass index (BMI), and metformin use (metf). For multiple comparison correction, we controlled the false discovery rate (FDR) with a target rate of 0.10. Asterisk signs indicate 0.05 ≤ FDR <0.10, and octothorpe signs indicate FDR <0.05. (b) Phylogenetically diverse microbial species significantly associated with T2D. The blue-to-red gradient represents the associations between microbial species and T2D phenotype. The colors of the innermost ring and phylogenetic trees differentiate major phyla. The heights of the outermost bars are in proportion to the mean relative abundance of microbial species. We presented significant results from both the ordinal and binary models adjusting for the aforementioned covariables (FDR <0.10, Methods). (c) Select dose-response associations between microbial species and T2D status. The centers of the boxplots show medians of cohort-specific mean relative abundance with boxes indicating their inter-quartile ranges (IQRs) and upper and lower whiskers indicating 1.5 times the IQR from above the upper quartile and below the lower quartile, respectively. The statistical models, the approach for multiple comparison correction, and the sample size were the same as those in (a). All the statistical tests in (a), (b), and (c) were two-sided. (d) The inclusion of microbial species improved the performance of random forest models in classifying metformin-treated or -naïve T2D vs. controls. The values are the area under the receiver operating characteristic curve (AUC) obtained by applying the model trained on all but the cohort of the corresponding row and validated in the cohort of that row. The basic model included age, sex, and BMI, while the other further included microbial species. The AUC values in metformin users are unavailable in Wu_2020a, Wu_2020b, and Zhong_2019 because they only enrolled treatment-naïve participants.
Fig. 3:
Fig. 3:. Diverse microbial processes involved in the pathogenesis of type 2 diabetes.
Meta-analyzed associations comparing diabetes versus normoglycemic controls of (a) microbial functions (as MetaCyc pathways) and (b) enzymes (as Enzyme Commission numbers) involved in glucose homeostasis, sulfur metabolism, and the biosynthesis of bacterial structural components, B vitamins, and essential amino acids with type 2 diabetes (T2D). A total of 8,117 metagenomes from 1,851 T2D patients, 2,770 individuals with prediabetes, and 2,277 normoglycemic controls were included in the analyses. Beta coefficients were derived from multivariable-adjusted linear mixed models (Methods) that included the T2D status as the independent variable and the microbial pathway or enzyme abundance as the dependent variable. Missing circles indicate features not measured in that cohort. All the results were corrected for multiple hypothesis testing by controlling the false discovery rate (FDR) using the Benjamini-Hochberg method with a target rate of 0.10. Asterisk signs indicate 0.05 ≤ FDR <0.10, and octothorpe signs indicate FDR <0.05. (c) A network of microbial features depicts intertwined relationships among insulin resistance, glycolysis, and glucose uptake in T2D. The network included curated MetaCyc pathways and enzymes significantly associated with T2D (FDR <0.10) and the species that encoded these microbial functions. (d) Prevotella copri strains in T2D patients are more likely to carry pathways and enzymes for branched-chain amino acid biosynthesis. The blue and red lines, fitted by linear regression in participants with T2D and control participants separately, represent the associations between the relative abundance of P. copri and the relative abundance of a given pathway or enzyme encoded by P. copri. The numeric values in the top left corner are posterior differences and 98% posterior intervals of differences in log-transformed pathway abundance between case-control status, as determined by mixed effects models in Anpan (ANalysis of microbial Phylogenies And geNes, see Methods). This model allows us to identify microbial functions encoded by P. copri that are differentially abundant between T2D cases vs. controls while controlling for its species-level abundance and covariables.
Fig. 4:
Fig. 4:. Within-species phylogenetic divergence explains subpopulation-specific and individualized associations between microbial species and type 2 diabetes risk.
(a) Within each of the 27 species, the phylogenetic generalized linear mixed model (PGLMM) in Anpan (ANalysis of microbial Phylogenies And geNes, see Methods) identifies subclades with varying associations with type 2 diabetes (T2D). The left-hand side summarizes the associations between within-species phylogeny and T2D. The centers of the error bars represent the differences in expected log point-wise predictive density (ΔELPD) between two generalized linear mixed models with and without incorporating within-species phylogeny as a random effect (Methods), and the error bars represent the standard errors of ΔEPLD. Species included in this figure are those with a ΔEPLD greater than 2. Both models are adjusted for age, sex, body mass index, metformin use, and cohort membership as fixed effects. Anpan generates within-species phylogenetic trees by randomly splitting the edges based on the Euclidean similarity matrix derived from clustered sets of protein sequences (UniRef90 gene families). The right-hand side presents the sample sizes of T2D patients and normoglycemic controls after adaptive filtering to remove metagenomes where the species of interest was absent or insufficiently covered by sequencing (Supplementary Table 8 and Methods). (b) Phylogenetic trees of two select species show divergent associations between subclades and T2D within each species. The inner rings denote the cohort membership of each metagenome. The outer rings present the posterior mean of the phylogenetic effect of each phylogenetic tree leaf (metagenome) estimated by PGLMMs, with darker colors indicating a higher likelihood of subclade effects on the risk of T2D (Methods). We annotate different subclades using sectors with different colors and letters. The sample sizes in this analysis vary across species after the adaptive filtering in Anpan (Methods) and are available in Supplementary Table 8.
Fig. 5:
Fig. 5:. Strain-specific gene carriage and biochemistry contribute to the pathogenesis of type 2 diabetes.
(a) Many differentially distributed UniRef90 gene families (clustered sets of protein sequences) provide functional explanations for the varying associations of subspecies with type 2 diabetes (T2D). The bar plots show the number of UniRef90 gene families significantly associated with T2D post-adaptive filtering. The boxplot presents the distributions of effect sizes (t-statistics) of UniRef90 gene families positively (red) and inversely (blue) associated with T2D within each species. The centers of boxes show medians of t-statistics with boxes indicating their inter-quartile ranges (IQRs), and upper and lower whiskers The right panel shows the results of gene-set enrichment analyses based on gene ontology (GO) terms and t-statistics from the gene association model in Anpan using 1,000 permutations. The bubble plot presents the enrichment scores and size of GO terms. GO terms with a positive normalized enrichment score (NES) contained UniRef90 gene families upregulated in T2D patients. GO terms with a negative NES contained UniRef90 gene families downregulated in T2D patients. All the results were corrected for multiple hypothesis testing by controlling the false discovery rate (FDR) using the Benjamini-Hochberg method with a target rate of 0.10. Asterisk signs indicate 0.05 ≤ FDR <0.10, and octothorpe signs indicate FDR <0.05. (b) UniRef90 gene family profiles indicate metagenomically detected strains for E. coli. The heatmap shows the genes significantly associated with T2D, with each column representing a metagenome and each row representing a UniRef90 gene family. The colors indicate the presence (green) or absence (blue) of a UniRef90 gene family in a metagenome. The heatmap on the right-hand side presents the t-statistics of an association between a UniRef90 gene family and T2D derived from the gene association model in Anpan. The red color signifies gene families enriched in T2D, while the blue color indicates gene families that are depleted in T2D. The sample sizes in the gene association model vary across species after the adaptive filtering in Anpan (Methods) and are available in Supplementary Table 8.

References

    1. IDF Diabetes Atlas 2021. (https://diabetesatlas.org/atlas/tenth-edition/).
    1. American Diabetes Association Professional Practice, C. 2. Classification and Diagnosis of Diabetes: Standards of Medical Care in Diabetes-2022. Diabetes Care 45, S17–S38 (2022). - PubMed
    1. Canfora EE, Meex RCR, Venema K & Blaak EE Gut microbial metabolites in obesity, NAFLD and T2DM. Nat Rev Endocrinol 15, 261–273 (2019). - PubMed
    1. Forslund K, et al. Disentangling type 2 diabetes and metformin treatment signatures in the human gut microbiota. Nature 528, 262–266 (2015). - PMC - PubMed
    1. Karlsson FH, et al. Gut metagenome in European women with normal, impaired and diabetic glucose control. Nature 498, 99–103 (2013). - PubMed

Grants and funding