. 2024 Jun 25;21(1):163.
doi: 10.1186/s12974-024-03157-w.

Maternal SARS-CoV-2 impacts fetal placental macrophage programs and placenta-derived microglial models of neurodevelopment

Affiliations

Maternal SARS-CoV-2 impacts fetal placental macrophage programs and placenta-derived microglial models of neurodevelopment

Lydia L Shook et al. J Neuroinflammation. .

Abstract

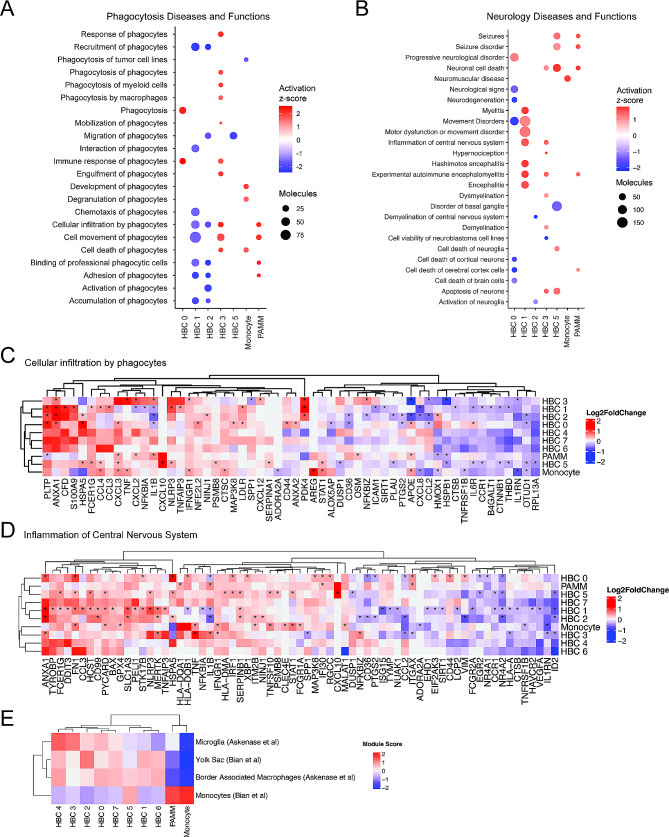
Background: The SARS-CoV-2 virus activates maternal and placental immune responses. Such activation in the setting of other infections during pregnancy is known to impact fetal brain development. The effects of maternal immune activation on neurodevelopment are mediated at least in part by fetal brain microglia. However, microglia are inaccessible for direct analysis, and there are no validated non-invasive surrogate models to evaluate in utero microglial priming and function. We have previously demonstrated shared transcriptional programs between microglia and Hofbauer cells (HBCs, or fetal placental macrophages) in mouse models.

Methods and results: We assessed the impact of maternal SARS-CoV-2 on HBCs isolated from 24 term placentas (N = 10 SARS-CoV-2 positive cases, 14 negative controls). Using single-cell RNA-sequencing, we demonstrated that HBC subpopulations exhibit distinct cellular programs, with specific subpopulations differentially impacted by SARS-CoV-2. Assessment of differentially expressed genes implied impaired phagocytosis, a key function of both HBCs and microglia, in some subclusters. Leveraging previously validated models of microglial synaptic pruning, we showed that HBCs isolated from placentas of SARS-CoV-2 positive pregnancies can be transdifferentiated into microglia-like cells (HBC-iMGs), with impaired synaptic pruning behavior compared to HBC models from negative controls.

Conclusion: These findings suggest that HBCs isolated at birth can be used to create personalized cellular models of offspring microglial programming.

Keywords: COVID-19; Fetal brain; Hofbauer cells; Microglia; Neurodevelopment; Neuroimmune; Placenta; SARS-CoV-2; Single-cell RNA sequencing.


Conflict of interest statement

R.H.P. has received fees for service as a scientific advisor to Belle Artificial Intelligence, Burrage Capital, Circular Genomics, Genomind, Swan Artificial Intelligence Studios, and Vault Health. A.G.E. serves as a consultant for Mirvie, Inc. and receives research funding from Merck Pharmaceuticals outside of this work. The other authors have no disclosures to report.

Figures

Fig. 1
Fig. 1
Transcriptomic profiles of fetal and maternal macrophages and monocytes isolated from term placentas with and without SARS-CoV-2 infection during pregnancy. (A) Uniform Manifold Approximation and Projection (UMAP) visualization of 31,719 high-quality placental macrophage and monocyte cells enriched from placentas of pregnancies with (N = 4) and without (N = 8) SARS-CoV-2 infection shows 10 clusters. HBC: Hofbauer cell; PAMM: placenta-associated maternal monocyte/macrophage. (B) Cluster-specific expression of DDX3Y, expressed only in fetal cells, and XIST, expressed only in maternal cells, in placentas from individuals carrying a male fetus (N = 10). (C) Correlation of cluster-average gene expression with annotated cell types identified by Suryawanshi et al., Sci Adv, 2018. Each heatmap shows Spearman correlation coefficients. Highest correlation coefficient per cluster is indicated by black dots. HBC clusters were most highly correlated with Suryawanshi HBC clusters, PAMM cluster most correlated with decidual macrophages. (D) Heatmap displaying expression (log2 fold change) of the top 5 marker genes per cluster. (E) Gene Ontology (GO) Biological Process enrichment analysis for cluster marker genes. GO terms displayed were curated from the top significant GO terms in each cluster, selecting the processes most relevant to macrophage function, and reducing redundancy. Gene Count gives the number of genes in the query set that are annotated by the relevant GO category. GO terms with an adjusted p-value < 0.05 were considered significantly enriched
Fig. 2
Fig. 2
Impact of maternal SARS-CoV-2 infection on Hofbauer cell subclusters. DEG: differentially expressed genes. (A) Barplot demonstrating proportion of cells per cluster from SARS-CoV-2 positive cases (red) and negative controls (gray), top panel. Number of DEG upregulated (dark blue) and downregulated (light blue) by SARS-CoV-2 exposure per cluster, bottom panel. (B) Gene Ontology (GO) Biological Process enrichment analysis for DEG. Gene Count gives the number of genes in the query set that are annotated by the relevant GO category. GO terms with an adjusted p-value < 0.05 were considered significantly enriched. (C) Heatmap and table of the top 3 upregulated and downregulated DEG by SARS-CoV-2 by cluster. Color represents gene expression level (log2 fold change), *adjusted P-value < 0.05. (D) Ingenuity Pathway Analysis (IPA) of DEG for HBC clusters 0 (left) and 1 (right). Canonical pathways with absolute Z-score ≥ 1 and adjusted p-value < 0.05 are shown. IPA analysis for remaining HBC clusters depicted in Supplement
Fig. 3
Fig. 3
Impact of maternal SARS-CoV-2 on HBC gene programs associated with phagocytosis and neurologic disease. (A-B) Ingenuity Pathway Analysis (IPA) phagocytosis diseases and functions pathways (A), and neurologic diseases or functions (B), enriched for ≥ 3 DEGs, with absolute Z-score ≥ 1 and adjusted P-value < 0.05. Activation Z-score represented by color and number of DEGs by circle size, with red color indicating pathway activation and blue color indicating suppression. (C-D). Heatmap of gene expression in “Cellular Infiltration by Phagocytes” IPA Pathway (C) and “Inflammation of Central Nervous System” (D) by cluster. Color represents gene expression level (log2 fold change), *adjusted P-value < 0.05. (E). Module score by subcluster in comparison to cluster-specific gene expression of single-cell datasets from human brain: Microglia and Border Associated Macrophages (Askenase et al., Sci Immunol, 2021) and Yolk Sac Macrophages and Monocytes (Bian et al., Nature, 2020). Color indicates module score
Fig. 4
Fig. 4
Phenotypic characterization of HBC-iMGs by direct cytokine reprogramming. HBC-iMGs: Hofbauer cells transdifferentiated toward microglia-like cells. (A) Representative images of HBC-iMGs, immunostained for microglial markers: IBA1, PU.1, P2RY12, TMEM119. Scale bar = 100 μm. (B) Morphology-smoothed density plots (solidity vs. eccentricity) for SARS-CoV-2 negative and positive samples as indicated. Representative confocal microscopy images of amoeboid, bipolar, and ramified HBC-iMGs. Scale bar = 50 μm. (C) Violin plots represent distribution of cell solidity (left) and eccentricity (right) measurements from SARS-CoV-2 negative controls (blue, n = 8965 cells from 9 participants) and positive cases (orange, n = 4754 cells from 10 participants). Solid lines represent median values and dashed lines interquartile range. Group differences assessed by linear mixed effects model. ns = not significant
Fig. 5
Fig. 5
Impact of maternal SARS-CoV-2 on HBC-iMG synaptosome engulfment. HBC-iMGs: Hofbauer cells transdifferentiated toward microglia-like cells (A) Representative image showing colocalization of pHrodo-red labeled synaptosomes (SYN) and IBA1 positive HBC-iMGs. Hoechst = nuclear stain. Scale bar = 100 μm. (B) Violin plots of phagocytic index of image fields from phagocytosis assays of HBC-iMGs from 9 SARS-CoV-2 negative controls (blue, n = 484 fields) and 10 SARS-CoV-2 positive cases (orange, n = 394 fields). Phagocytic index is calculated as synaptosome area in pixels divided by cell count per image field. Solid lines represent median values and dashed lines interquartile range. Group differences assessed by linear mixed effects model. *P < 0.05

Update of

References

    1. Mednick SA, Machon RA, Huttunen MO, Bonett D. Adult schizophrenia following prenatal exposure to an influenza epidemic. Arch Gen Psychiatry. 1988;45:189–92. doi: 10.1001/archpsyc.1988.01800260109013. - DOI - PubMed
    1. Barr CE, Mednick SA, Munk-Jorgensen P. Exposure to influenza epidemics during gestation and adult schizophrenia. A 40-year study. Arch Gen Psychiatry. 1990;47:869–74. doi: 10.1001/archpsyc.1990.01810210077012. - DOI - PubMed
    1. Cooper SJ. Schizophrenia after prenatal exposure to 1957 A2 influenza epidemic. Br J Psychiatry. 1992;161:394–6. doi: 10.1192/bjp.161.3.394. - DOI - PubMed
    1. Al-Haddad BJS, Jacobsson B, Chabra S, Modzelewska D, Olson EM, Bernier R, et al. Long-term risk of Neuropsychiatric Disease after exposure to infection in Utero. JAMA Psychiatry. 2019;76:594–602. doi: 10.1001/jamapsychiatry.2019.0029. - DOI - PMC - PubMed
    1. Atladóttir HO, Thorsen P, Østergaard L, Schendel DE, Lemcke S, Abdallah M, et al. Maternal infection requiring hospitalization during pregnancy and autism spectrum disorders. J Autism Dev Disord. 2010;40:1423–30. doi: 10.1007/s10803-010-1006-y. - DOI - PubMed