. 2024 Jun 25;26(1):104.
doi: 10.1186/s13058-024-01844-3.

Evaluating the immunologically "cold" tumor microenvironment after treatment with immune checkpoint inhibitors utilizing PET imaging of CD4 + and CD8 + T cells in breast cancer mouse models

Affiliations

Evaluating the immunologically "cold" tumor microenvironment after treatment with immune checkpoint inhibitors utilizing PET imaging of CD4 + and CD8 + T cells in breast cancer mouse models

Yun Lu et al. Breast Cancer Res. .

Abstract

Background: Immune-positron emission tomography (PET) imaging with tracers that target CD8 and granzyme B has shown promise in predicting the therapeutic response following immune checkpoint blockade (ICB) in immunologically "hot" tumors. However, immune dynamics in the low T-cell infiltrating "cold" tumor immune microenvironment during ICB remain poorly understood. This study uses molecular imaging to evaluate changes in CD4 + T cells and CD8 + T cells during ICB in breast cancer models and examines biomarkers of response.

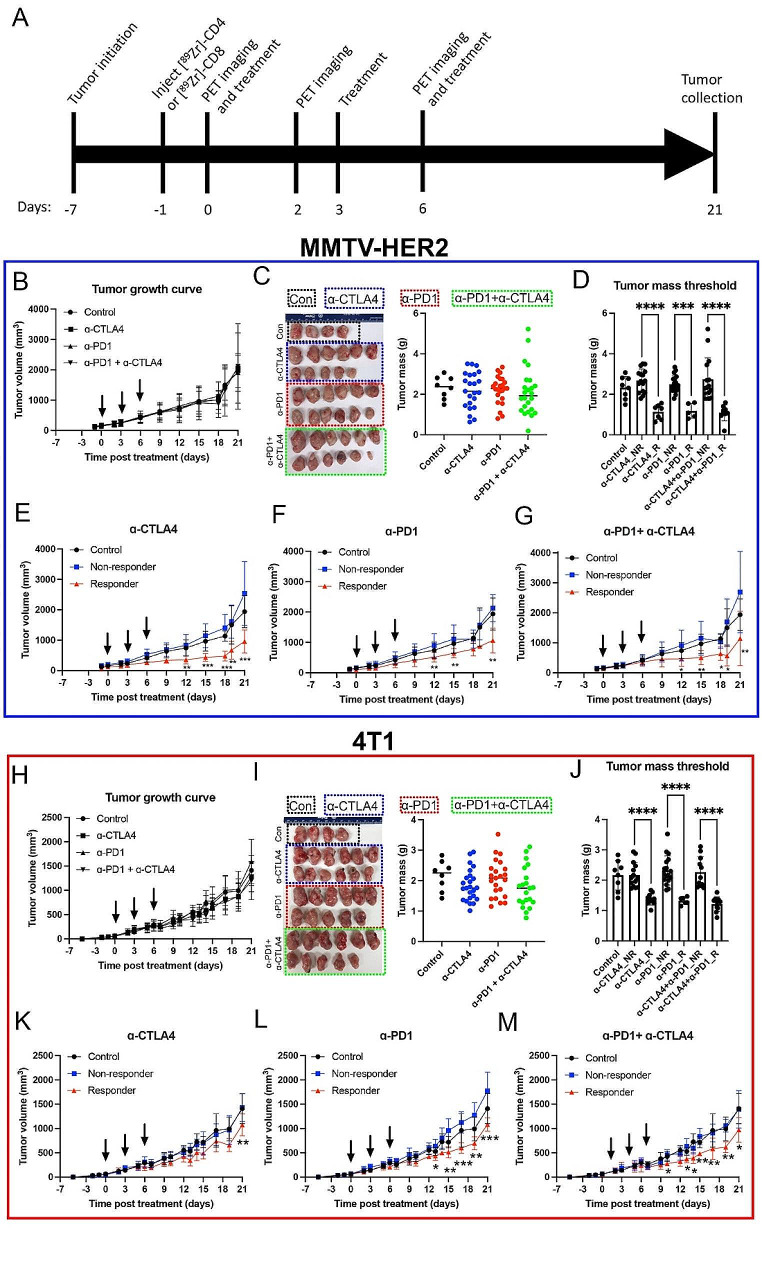
Methods: [89Zr]Zr-DFO-CD4 and [89Zr]Zr-DFO-CD8 radiotracers were used to quantify changes in intratumoral and splenic CD4 T cells and CD8 T cells in response to ICB treatment in 4T1 and MMTV-HER2 mouse models, which represent immunologically "cold" tumors. A correlation between PET quantification metrics and long-term anti-tumor response was observed. Further biological validation was obtained by autoradiography and immunofluorescence.

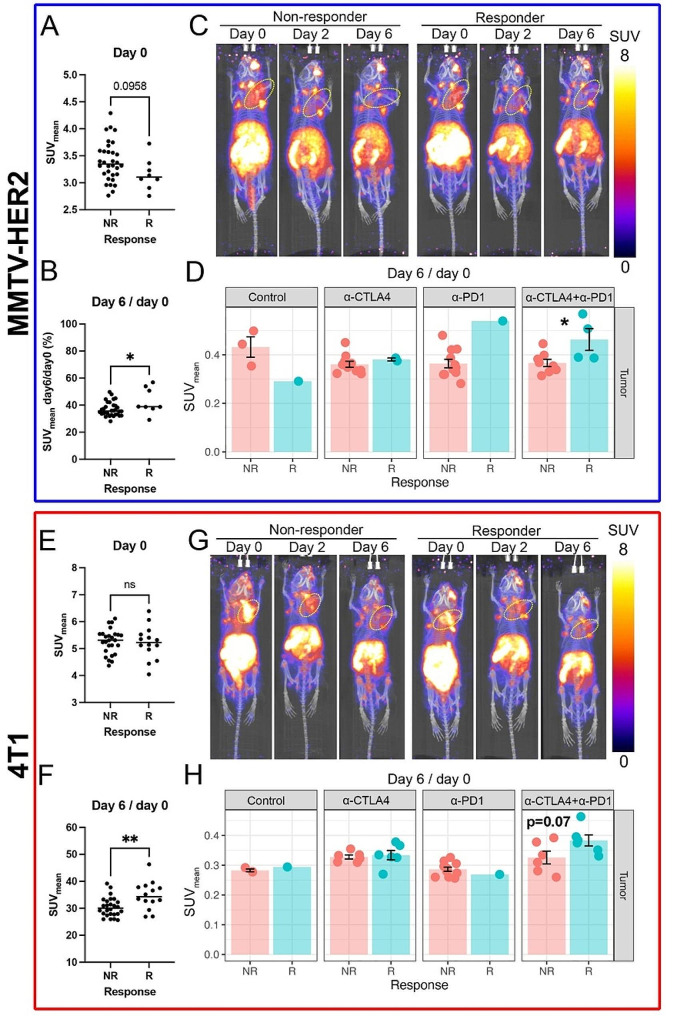
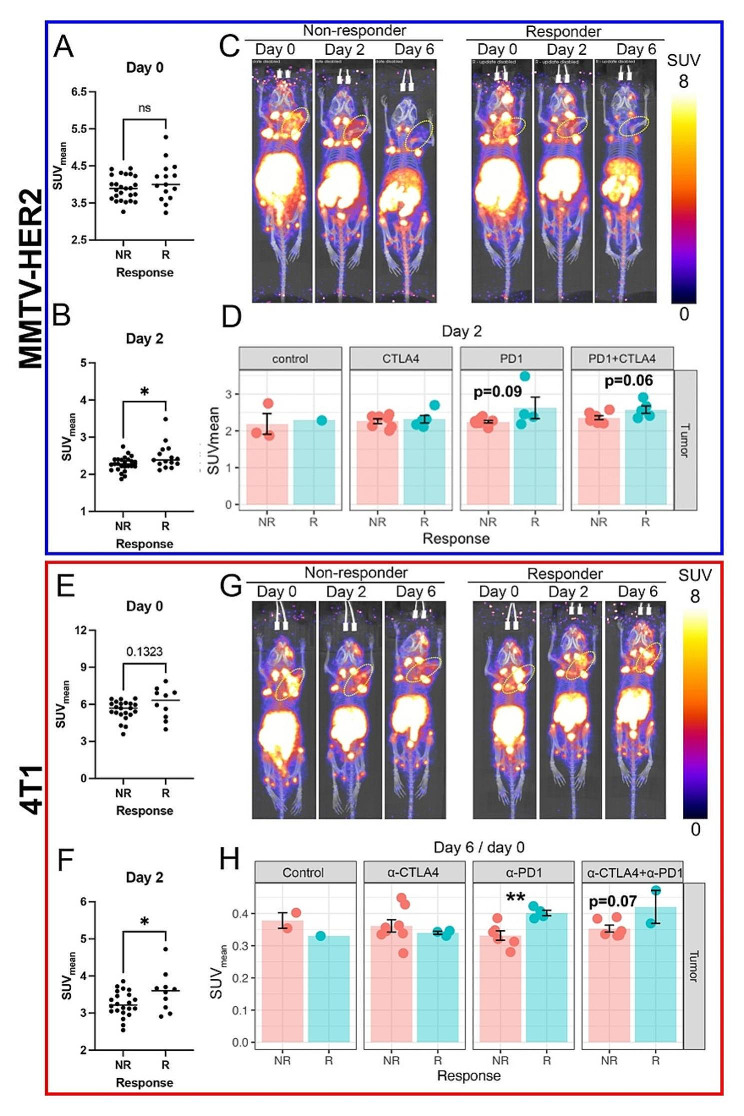
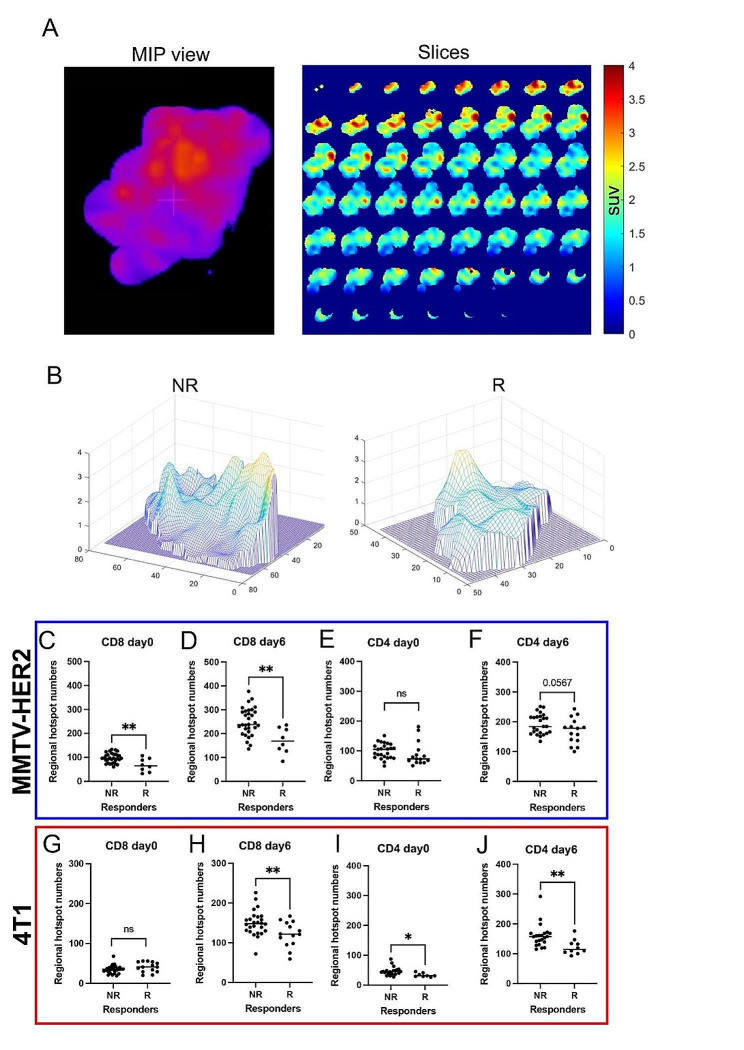
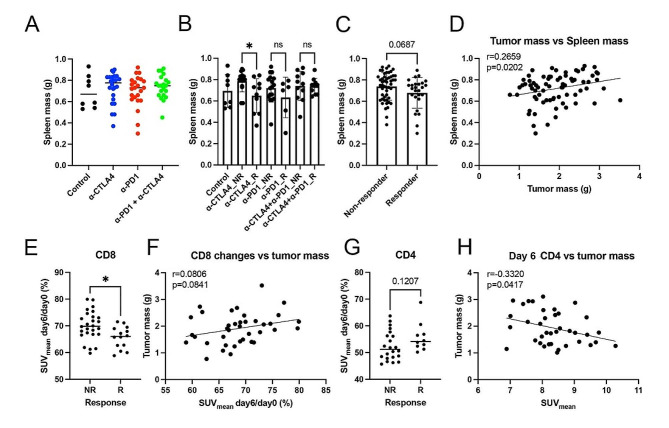
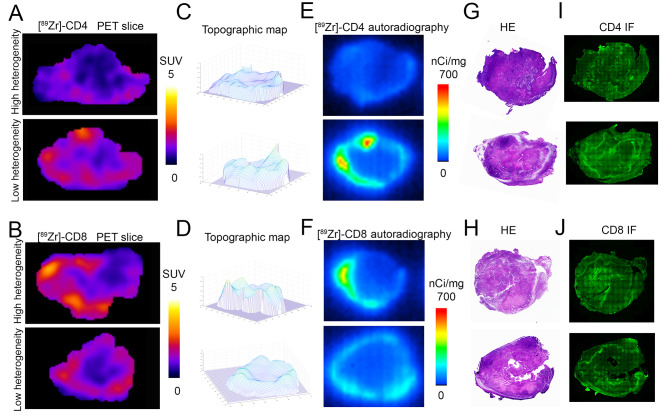
Results: Following ICB treatment, an increase in the CD8-specific PET signal was observed within 6 days, and an increase in the CD4-specific PET signal was observed within 2 days in tumors that eventually responded to immunotherapy, while no significant differences in CD4 or CD8 were found at the baseline of treatment that differentiated responders from nonresponders. Furthermore, mice whose tumors responded to ICB had a lower CD8 PET signal in the spleen and a higher CD4 PET signal in the spleen compared to non-responders. Intratumoral spatial heterogeneity of the CD8 and CD4-specific PET signals was lower in responders compared to non-responders. Finally, PET imaging, autoradiography, and immunofluorescence signals were correlated when comparing in vivo imaging to ex vivo validations.

Conclusions: CD4- and CD8-specific immuno-PET imaging can be used to characterize the in vivo distribution of CD4 + and CD8 + T cells in response to immune checkpoint blockade. Imaging metrics that describe the overall levels and distribution of CD8 + T cells and CD4 + T cells can provide insight into immunological alterations, predict biomarkers of response to immunotherapy, and guide clinical decision-making in those tumors where the kinetics of the response differ.

Keywords: 89Zr; 4T1; CTLA4; ImmunoPET; MMTV-HER2; PD-1; Positron emission tomography; Spatial heterogeneity; Spleen.


Conflict of interest statement

The authors declare no conflicts of interest.

Figures

Fig. 1
Fig. 1
ICB treatment response varies in MMTV-HER2 and 4T1 mouse models. A) Experimental timeline. B) Tumor growth curve of MMTV-HER2 model. C) Image of tumors at the end of the experiment in the MMTV-HER2 model. The combinational treatment group showed a trend of decrease in tumor mass, yet the decrease was not significant. D) Tumor mass of threshold method in MMTV-HER2 model. E-F) Tumor growth curve after thresholding in MMTV-HER2 model. Responders showed significantly decreased tumor volumes. H) Tumor growth curve of 4T1 model. I) Image of tumors at the end of the experiment in the 4T1 model. J) Tumor mass of threshold method in the 4T1 model. K-M) Tumor growth curve after thresholding in the 4T1 model. N = 80. R was for responders. NR was for non-responders
Fig. 2
Fig. 2
Intratumoral CD8-specific PET signals, [89Zr]Zr-DFO-CD8 SUVmean, increased in tumors that had an effective response to ICB. A) The mean of standard uptake value (SUVmean) of responders showed a decreasing trend in the MMTV-HER2 model at day 0. B) From day 0 to 6, changes in SUVmean of responders showed an increase compared to non-responders in the MMTV-HER2 model. Overall, CD8 + cells were retained/infiltrated from day 0 to day 6 in MMTV-HER2 tumors that responded to ICB. C) Representative images of [89Zr]Zr-DFO-CD8 PET from day 0 to day 6 in the combinational treatment group in the MMTV-HER2 model. Yellow circles indicated tumors. All the images are processed at the same setting and decay corrected to the imaging time. D) Day6/day0 intratumoral [89Zr]Zr-DFO-CD8 SUVmean of each treatment group in MMTV-HER2 model. In the combinational treatment group, responders had an increase of [89Zr]Zr-DFO-CD8 SUVmean from day 0 to day 6 compared to non-responders. E) [89Zr]Zr-DFO-CD8 SUVmean at day 0 in 4T1 model. No significance was found. F) The ratio of day6/day0 of [89Zr]Zr-DFO-CD8 SUVmean in 4T1 model. Overall, CD8 + cells were retained/infiltrated from day 0 to day 6 in 4T1 tumors that responded to ICB. G) Representative images of [89Zr]Zr-DFO-CD8 PET from day 0 to day 6 in the combinational treatment group in the 4T1 model. Yellow circles indicated tumors. All the images are processed at the same setting and decay corrected to the imaging time. H) Day6/day0 intratumoral [89Zr]Zr-DFO-CD8 SUVmean of each treatment group in the 4T1 model
Fig. 3
Fig. 3
Intratumoral CD4-specific PET signals, [89Zr]Zr-DFO-CD4 SUVmean, on day 2 increased in ICB responders. A-B) Mean of standard uptake value (SUVmean) at day 0 (A) and 2 (B) in MMTV-HER2 model. Overall, CD4 + cells were increased in the retained/infiltrated population in ICB responders in MMTV-HER2 model. C) Representative images of [89Zr]Zr-DFO-CD4 PET from day 0 to day 6 in the combinational treatment group in the MMTV-HER2 model. Yellow circles indicated tumors. The responders showed a slightly increased [89Zr]Zr-DFO-CD4 signal on day 2. All the images are processed at the same setting and decay corrected to the imaging time. D) Day 2 intratumoral [89Zr]Zr-DFO-CD4 SUVmean of each treatment group in MMTV-HER2 model. There was a trend of increase in α-PD-1 treated responders in the MMTV-HER2 model. E-F) [89Zr]Zr-DFO-CD4 SUVmean at day 0 (E) and 2 (F) in the 4T1 model. On day 2, retained/infiltrated CD4 + cells increased in ICB treatment responders relative to non-responders. E) Representative images of [89Zr]Zr-DFO-CD4 PET from day 0 to day 6 in the combinational treatment group in the 4T1 model. Yellow circles indicated tumors. The responder group showed a slightly increased [89Zr]Zr-DFO-CD4 signal on day 2. All the images are processed at the same setting and decay corrected to the imaging time. F) Day6/day0 intratumoral [89Zr]Zr-DFO-CD4 SUVmean of each treatment group in the 4T1 model. α-PD-1 treated responders showed a significant increase of [89Zr]Zr-DFO-CD4 SUVmeanG) Representative images of [89Zr]-CD4 PET from day 0 to day 6 in the combinational treatment group in the 4T1 model. The responder showed a slight increase in [89Zr]-CD4 signal on day 2. H) Day6/day0 intratumoral [89Zr]-CD4 SUVmean of each treatment group in 4T1 model. α-PD-1 treated responders showed a significant increase of [89Zr]-CD4 SUVmean
Fig. 4
Fig. 4
The spatial heterogeneity of intratumoral CD4 and CD8 PET signals was reduced in responders. A) Representative images of isolated 3D tumors and 2D slices of PET image. B) Representative topographic map of 2D slice PET images. In the MMTV-HER2 model, non-responders showed increased peak numbers of [89Zr]Zr-DFO-CD8 uptake compared to responders. C-J) Quantification of regional hotspot numbers in 3D tumors. In both MMTV-HER2 and 4T1 models, the responders showed decreased regional hotspot numbers of [89Zr]Zr-DFO-CD8 and [89Zr]Zr-DFO-CD4 uptake compared to non-responders after initiation of ICB (day 6)
Fig. 5
Fig. 5
The CD8-specific PET signal in the spleen was decreased in responders and the CD4-specific PET signal was positively correlated with the efficacy of ICB treatment in 4T1 models. A-C) Terminal spleen mass in different ICB treatment groups and responses. ICB (especially α-CTLA4) treatment responders showed decreased spleen mass. D) There was a significant correlation between terminal tumor mass and spleen mass (r = 0.2659, p = 0.0202). E) There was a significant decrease in splenic [89Zr]Zr-DFO-CD8 in ICB responders compared to non-responders. F) Dynamic changes from day 0 to day 6 of splenic [89Zr]Zr-DFO-CD8 SUVmean showed a weak trend of correlation with terminal tumor mass (r = 0.0806, p = 0.0841). The less retained splenic CD8 + cells indicated a smaller terminal tumor mass and a bigger terminal spleen mass. G) There was a trend of an increase in splenic [89Zr]Zr-DFO-CD4 in ICB responders compared to non-responders. H) There was a significant correlation between day 6 [89Zr]Zr-DFO-CD4 SUVmean and terminal tumor mass (r = 0.3320, p = 0.0417). The higher CD4 signal in the spleen on treatment day 6 favored a better treatment outcome
Fig. 6
Fig. 6
Autoradiography and immunofluorescence (IF) staining show that spatial heterogeneity and overall uptake are distinct measurements. A-B) Representative central slice of PET images showed high and low heterogeneity of [89Zr]Zr-DFO-CD4 and [89Zr]Zr-DFO-CD8 distribution, despite differences in total levels of uptake. C-D) Topographic map of [89Zr]Zr-DFO-CD4 and [89Zr]Zr-DFO-CD8 PET slices indicated regional hotspots. E-F) Corresponding autoradiography images immediately after PET imaging. G-H) Hematoxylin and eosin (H&E) staining of 4T1 tumor sections revealed that areas of high [89Zr]Zr-DFO-CD4 or [89Zr]Zr-DFO-CD8 uptake displayed a substantial concentration of densely packed tumor regions. I-J) IF staining for CD4 or CD8 in 4T1 tumor sections displayed a notable presence of CD4 + or CD8 + cells in proximity to high cellular tumor regions, a pattern consistent with the uptake pattern of the PET tracer

References

    1. Hanahan D. Hallmarks of Cancer: New dimensions. Cancer Discov. 2022;12:31–46. doi: 10.1158/2159-8290.CD-21-1059. - DOI - PubMed
    1. Semiglazov V, Tseluiko A, Kudaybergenova A, Artemyeva A, Krivorotko P, Donskih R. Immunology and immunotherapy in breast cancer. Cancer Biol Med. 2022;19:609–18. doi: 10.20892/j.issn.2095-3941.2021.0597. - DOI - PMC - PubMed
    1. Nathan MR, Schmid P. The emerging world of breast cancer immunotherapy. Breast (Edinburgh Scotland) 2018;37:200–6. doi: 10.1016/j.breast.2017.05.013. - DOI - PubMed
    1. Farhood B, Najafi M, Mortezaee K. CD8(+) cytotoxic T lymphocytes in cancer immunotherapy: a review. J Cell Physiol. 2019;234:8509–21. doi: 10.1002/jcp.27782. - DOI - PubMed
    1. Borst J, Ahrends T, Babala N, Melief CJM, Kastenmuller W. CD4(+) T cell help in cancer immunology and immunotherapy. Nat Rev Immunol. 2018;18:635–47. doi: 10.1038/s41577-018-0044-0. - DOI - PubMed

MeSH terms