

Cross-species transcriptomics identifies obesity associated genes between human and mouse studies
- PMID: 38918843
- PMCID: PMC11197204
- DOI: 10.1186/s12967-024-05414-1
Cross-species transcriptomics identifies obesity associated genes between human and mouse studies
Abstract
Background: Fundamentally defined by an imbalance in energy consumption and energy expenditure, obesity is a significant risk factor of several musculoskeletal conditions including osteoarthritis (OA). High-fat diets and sedentary lifestyle leads to increased adiposity resulting in systemic inflammation due to the endocrine properties of adipose tissue producing inflammatory cytokines and adipokines. We previously showed serum levels of specific adipokines are associated with biomarkers of bone remodelling and cartilage volume loss in knee OA patients. Whilst more recently we find the metabolic consequence of obesity drives the enrichment of pro-inflammatory fibroblast subsets within joint synovial tissues in obese individuals compared to those of BMI defined 'health weight'. As such this present study identifies obesity-associated genes in OA joint tissues which are conserved across species and conditions.
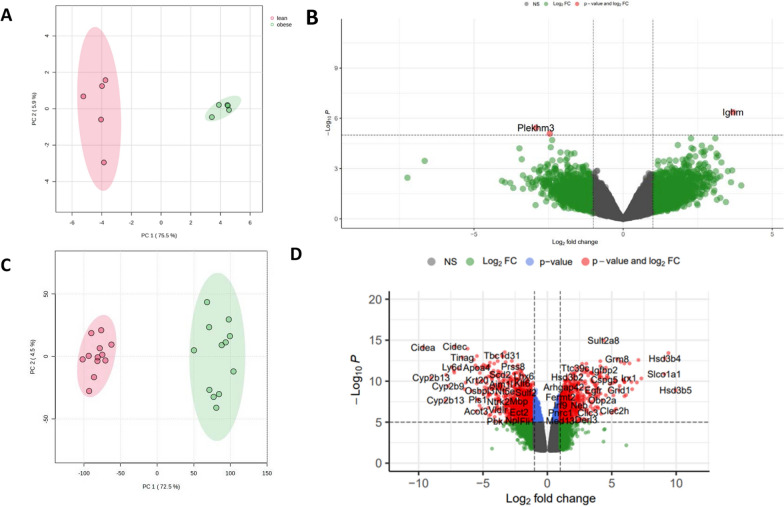
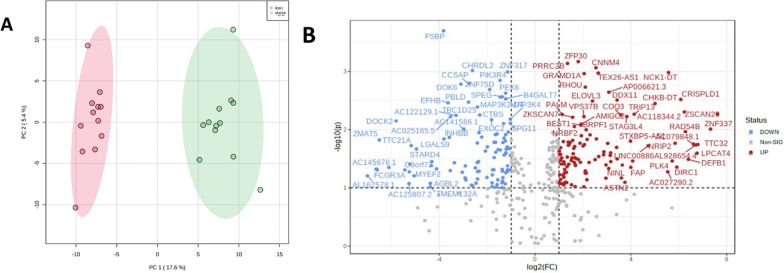
Methods: The study utilised 6 publicly available bulk and single-cell transcriptomic datasets from human and mice studies downloaded from Gene Expression Omnibus (GEO). Machine learning models were employed to model and statistically test datasets for conserved gene expression profiles. Identified genes were validated in OA tissues from obese and healthy weight individuals using quantitative PCR method (N = 38). Obese and healthy-weight patients were categorised by BMI > 30 and BMI between 18 and 24.9 respectively. Informed consent was obtained from all study participants who were scheduled to undergo elective arthroplasty.
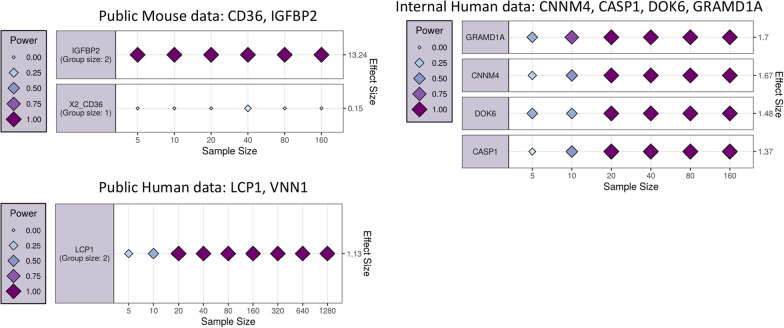
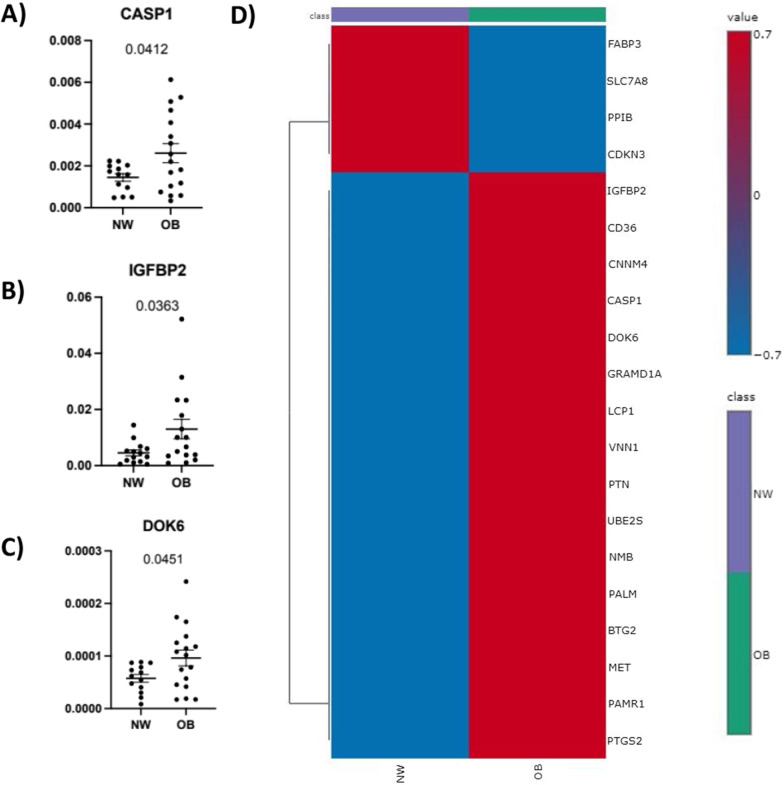
Results: Principal component analysis (PCA) was used to investigate the variations between classes of mouse and human data which confirmed variation between obese and healthy populations. Differential gene expression analysis filtered on adjusted p-values of p < 0.05, identified differentially expressed genes (DEGs) in mouse and human datasets. DEGs were analysed further using area under curve (AUC) which identified 12 genes. Pathway enrichment analysis suggests these genes were involved in the biosynthesis and elongation of fatty acids and the transport, oxidation, and catabolic processing of lipids. qPCR validation found the majority of genes showed a tendency to be upregulated in joint tissues from obese participants. Three validated genes, IGFBP2 (p = 0.0363), DOK6 (0.0451) and CASP1 (0.0412) were found to be significantly different in obese joint tissues compared to lean-weight joint tissues.
Conclusions: The present study has employed machine learning models across several published obesity datasets to identify obesity-associated genes which are validated in joint tissues from OA. These results suggest obesity-associated genes are conserved across conditions and may be fundamental in accelerating disease in obese individuals. Whilst further validations and additional conditions remain to be tested in this model, identifying obesity-associated genes in this way may serve as a global aid for patient stratification giving rise to the potential of targeted therapeutic interventions in such patient subpopulations.
Keywords: Multi omics; Obesity; Transcriptomics; Translational medicine.
© 2024. The Author(s).
Conflict of interest statement
The authors declare that they have no competing interests.
Figures


References
MeSH terms
Grants and funding
LinkOut - more resources
Full Text Sources
Medical
Research Materials
Miscellaneous
