Less spatial exploration is associated with poorer spatial memory in midlife adults
- PMID: 38919601
- PMCID: PMC11196421
- DOI: 10.3389/fnagi.2024.1382801
Less spatial exploration is associated with poorer spatial memory in midlife adults
Abstract
Introduction: Despite its importance for navigation, very little is known about how the normal aging process affects spatial exploration behavior. We aimed to investigate: (1) how spatial exploration behavior may be altered early in the aging process, (2) the relationship between exploration behavior and subsequent spatial memory, and (3) whether exploration behavior can classify participants according to age.
Methods: Fifty healthy young (aged 18-28) and 87 healthy midlife adults (aged 43-61) freely explored a desktop virtual maze, learning the locations of nine target objects. Various exploration behaviors (object visits, distance traveled, turns made, etc.) were measured. In the test phase, participants navigated from one target object to another without feedback, and their wayfinding success (% correct trials) was measured.
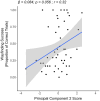
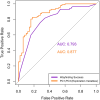
Results: In the exploration phase, midlife adults exhibited less exploration overall compared to young adults, and prioritized learning target object locations over maze layout. In the test phase, midlife adults exhibited less wayfinding success when compared to the young adults. Furthermore, following principal components analysis (PCA), regression analyses indicated that both exploration quantity and quality components were associated with wayfinding success in the midlife group, but not the young adults. Finally, we could classify participants according to age with similar accuracy using either their exploration behavior or wayfinding success scores.
Discussion: Our results aid in the understanding of how aging impacts spatial exploration, and encourages future investigations into how pathological aging may affect spatial exploration behavior.
Keywords: age; midlife; spatial exploration; spatial memory; spatial navigation; virtual reality.
Copyright © 2024 Puthusseryppady, Cossio, Yu, Rezwana, Hegarty, Jacobs and Chrastil.
Conflict of interest statement
The authors declare that the research was conducted in the absence of any commercial or financial relationships that could be construed as a potential conflict of interest. The author(s) declared that they were an editorial board member of Frontiers, at the time of submission. This had no impact on the peer review process and the final decision.
Figures


Similar articles
-
Divide (evenly) and conquer (quickly): Spatial exploration behaviors predict navigational learning and differ by sex.Cognition. 2025 Aug;261:106144. doi: 10.1016/j.cognition.2025.106144. Epub 2025 Apr 21. Cognition. 2025. PMID: 40262422
-
Hippocampus-dependent spatial learning is associated with higher global cognition among healthy older adults.Neuropsychologia. 2017 Nov;106:310-321. doi: 10.1016/j.neuropsychologia.2017.09.025. Epub 2017 Sep 28. Neuropsychologia. 2017. PMID: 28963056
-
Executive and memory correlates of age-related differences in wayfinding performances using a virtual reality application.Neuropsychol Dev Cogn B Aging Neuropsychol Cogn. 2013;20(3):298-319. doi: 10.1080/13825585.2012.706247. Epub 2012 Aug 17. Neuropsychol Dev Cogn B Aging Neuropsychol Cogn. 2013. PMID: 22901081 Review.
-
Wayfinding and acquisition of spatial knowledge with navigation assistance.J Exp Psychol Appl. 2020 Mar;26(1):73-88. doi: 10.1037/xap0000237. Epub 2019 Jun 27. J Exp Psychol Appl. 2020. PMID: 31246054
-
The Embodied Brain of SOVEREIGN2: From Space-Variant Conscious Percepts During Visual Search and Navigation to Learning Invariant Object Categories and Cognitive-Emotional Plans for Acquiring Valued Goals.Front Comput Neurosci. 2019 Jun 25;13:36. doi: 10.3389/fncom.2019.00036. eCollection 2019. Front Comput Neurosci. 2019. PMID: 31333437 Free PMC article. Review.
Cited by
-
Spatial navigation strategy in older adults: Preference or ability?Psychol Aging. 2025 Aug;40(5):462-478. doi: 10.1037/pag0000896. Epub 2025 Apr 21. Psychol Aging. 2025. PMID: 40257916
References
-
- Adelöf J., Ross J. M., Lazic S. E., Zetterberg M., Wiseman J., Hernebring M. (2019). Conclusions from a behavioral aging study on male and female F2 hybrid mice on age-related behavior, buoyancy in water-based tests, and an ethical method to assess lifespan. Aging 11, 7150–7168. 10.18632/aging.102242 - DOI - PMC - PubMed
-
- Bates D., Mächler M., Bolker B., Walker S. (2015). Fitting linear mixed-effects models using lme4. J. Stat. Softw. 67, 1–48. 10.18637/jss.v067.i01 - DOI
-
- Ben-Shachar M., Lüdecke D., Makowski D. (2020). Effectsize: estimation of effect size indices and standardized parameters. J. Open Source Softw. 5:2815. 10.21105/joss.02815 - DOI

