. 2024 Jun 10:15:1388272.
doi: 10.3389/fimmu.2024.1388272. eCollection 2024.

Partial hepatectomy accelerates colorectal metastasis by priming an inflammatory premetastatic niche in the liver

Affiliations

Partial hepatectomy accelerates colorectal metastasis by priming an inflammatory premetastatic niche in the liver

Jost Luenstedt et al. Front Immunol. .

Abstract

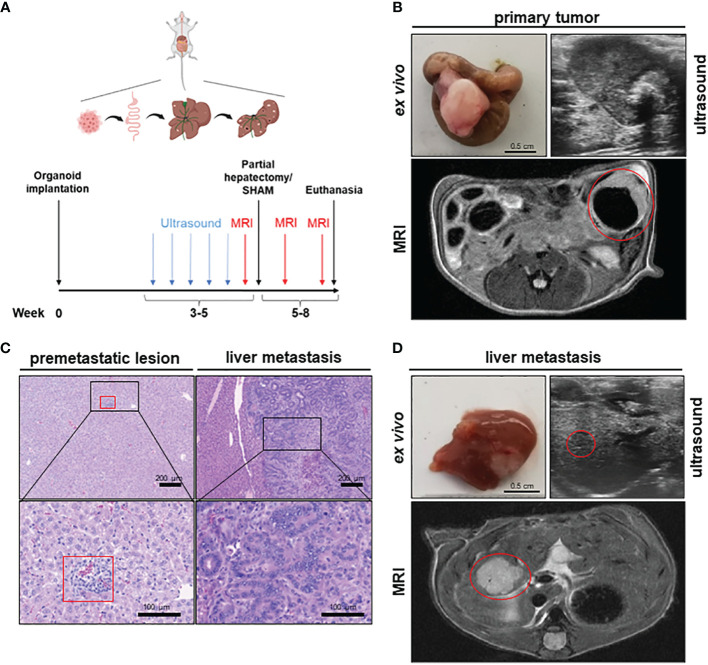
Background: Resection of colorectal liver metastasis is the standard of care for patients with Stage IV CRC. Despite undoubtedly improving the overall survival of patients, pHx for colorectal liver metastasis frequently leads to disease recurrence. The contribution of this procedure to metastatic colorectal cancer at a molecular level is poorly understood. We designed a mouse model of orthograde metastatic colorectal cancer (CRC) to investigate the effect of partial hepatectomy (pHx) on tumor progression.

Methods: CRC organoids were implanted into the cecal walls of wild type mice, and animals were screened for liver metastasis. At the time of metastasis, 1/3 partial hepatectomy was performed and the tumor burden was assessed longitudinally using MRI. After euthanasia, different tissues were analyzed for immunological and transcriptional changes using FACS, qPCR, RNA sequencing, and immunohistochemistry.

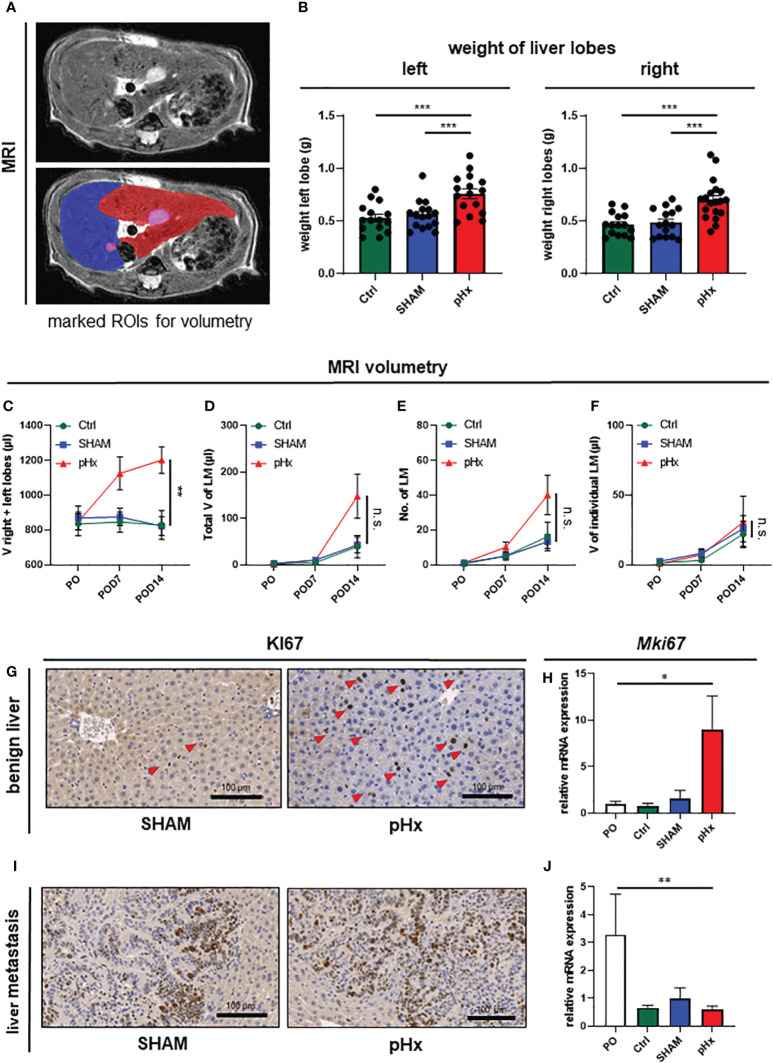
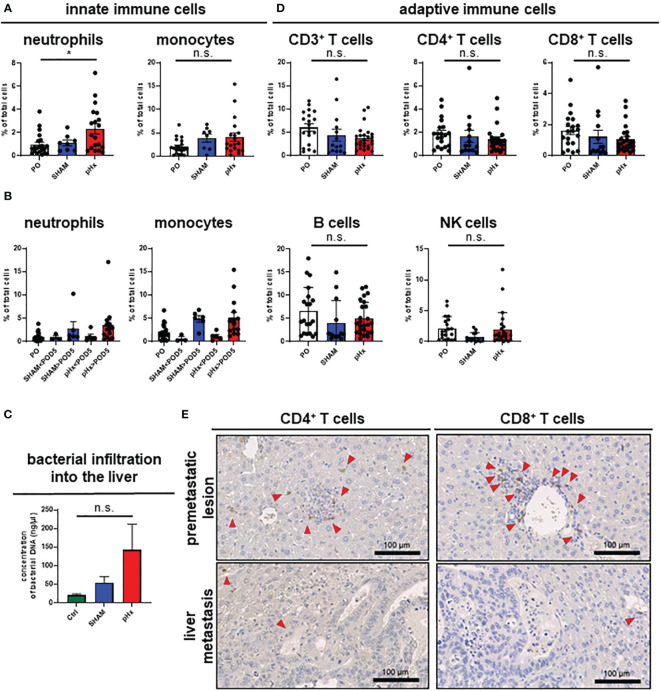
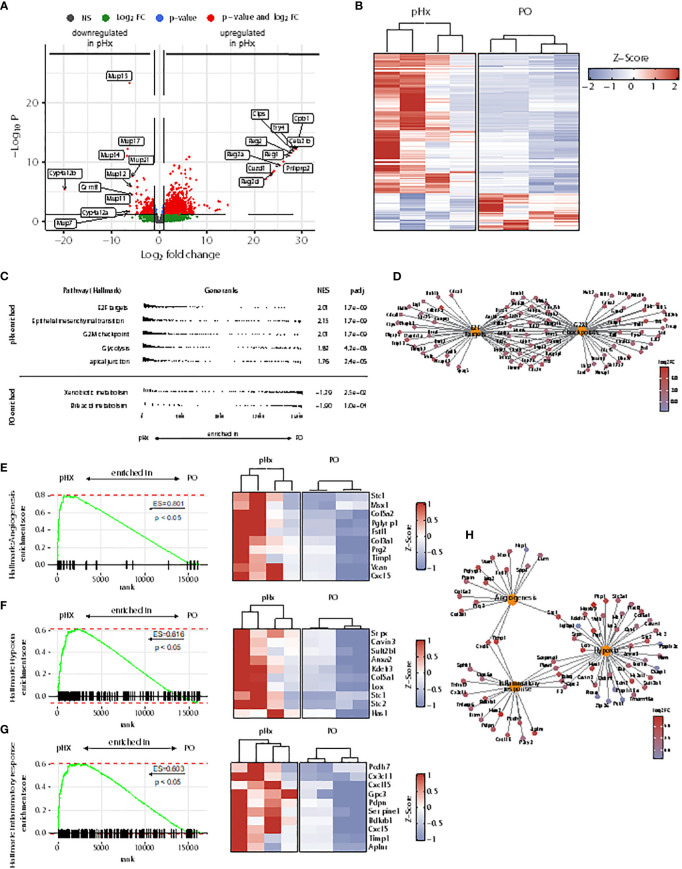
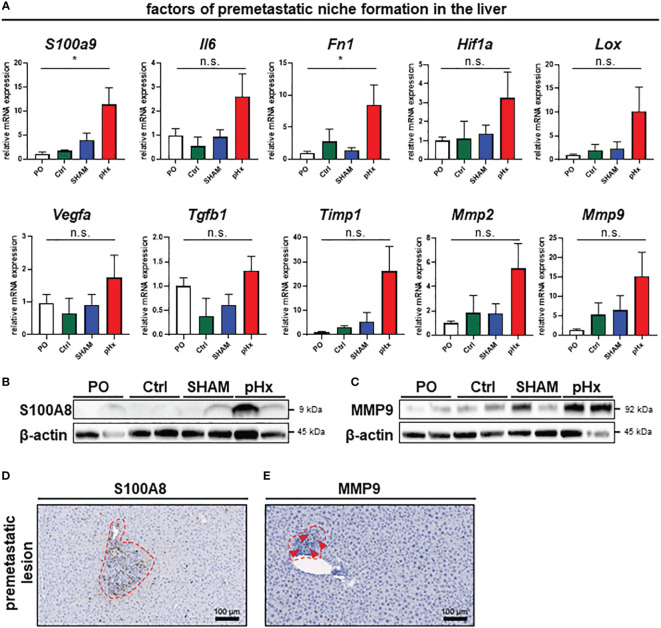
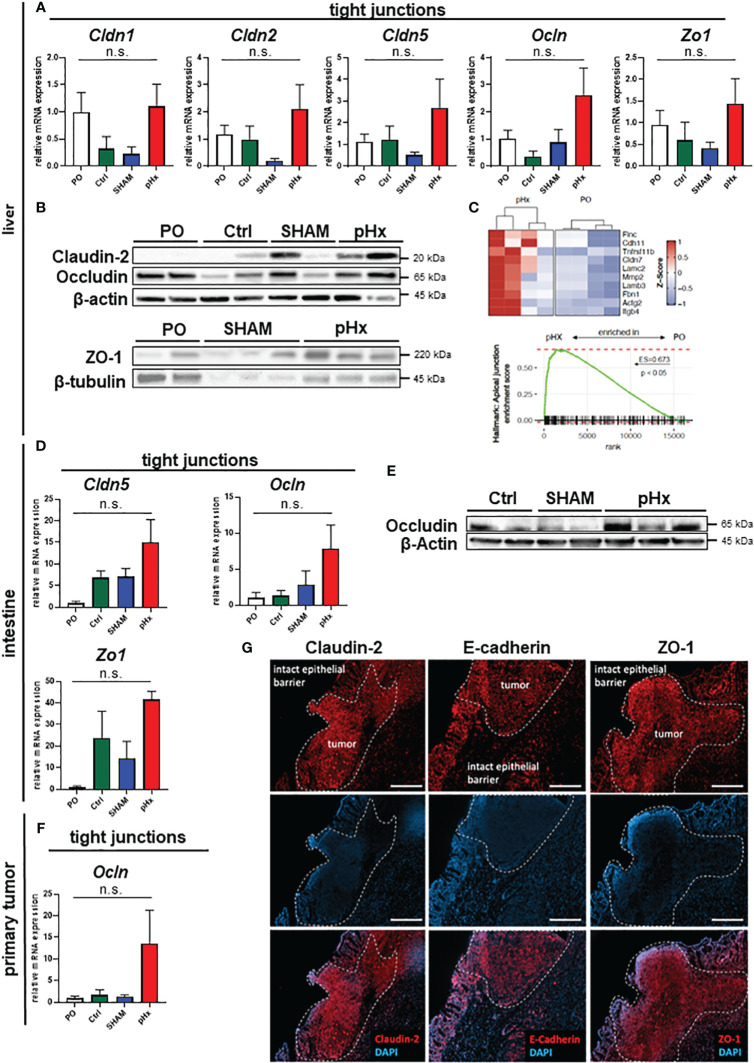
Results: Mice that underwent pHx presented significant liver hypertrophy and an increased overall metastatic load compared with SHAM operated mice in MRI. Elevation in the metastatic volume was defined by an increase in de novo liver metastasis without any effect on the growth of each metastasis. Concordantly, the livers of pHx mice were characterized by neutrophil and bacterial infiltration, inflammatory response, extracellular remodeling, and an increased abundance of tight junctions, resulting in the formation of a premetastatic niche, thus facilitating metastatic seeding.

Conclusions: Regenerative pathways following pHx accelerate colorectal metastasis to the liver by priming a premetastatic niche.

Keywords: colorectal cancer; liver metastasis; partial hepatectomy; premetastatic niche; tight junctions.


Conflict of interest statement

The authors declare that the research was conducted in the absence of any commercial or financial relationships that could be construed as a potential conflict of interest.

Figures

Figure 1
Figure 1
A novel mouse model to study the effects of partial hepatectomy in orthotopic metastasized colorectal carcinoma. (A) Overview of experimental layout (top) and timeline for procedures (bottom); (B) Representative images of primary tumor ex vivo (scale bar = 0.5 cm) and T2-weighted transversal MRI of early primary tumor (red circle) and locally advanced primary tumor in ultrasound; (C) Representative HE-staining of liver with premetastatic lesion (red square) and of advanced liver metastasis (LM) (scale bars in left panels = 200 µm and in right panels =100 µm); (D) Representative images of liver and LM ex vivo (scale bar = 0.5 cm) and of T2-hyperintense LM (red circle) in the medial hepatic lobe (max. diameter 7 mm) in transversal T2-weighted MRI and in ultrasound of the same liver metastasis (red circle).
Figure 2
Figure 2
Medial lobe hepatectomy induces hypertrophy of the residual liver and increases overall metastatic volume and number without affecting the individual growth of each metastasis. (A) Representative MRI of liver and LM following pHx (POD7) in native T2-weighted MRI (top) and with marked regions of interest (ROI) (bottom): blue: right upper hepatic lobe, red: left hepatic lobe, pink: LM; (B) Boxplots showing the weight in grams of left and right liver lobes after euthanasia of Ctrl group (n=15/15), SHAM group (n=16/15) and pHx group (n=16/19); (C) Time course analysis of the combined volume of healthy left and right lobes in µl measured in MRI of Ctrl (n=5), SHAM (n=6) and pHx (n=9) group; (D) Time course analysis of total volume of liver metastases in left and right lobes in µl measured in MRI for Ctrl (n=7), SHAM (n=15) and pHx (n=19) group; (E) Time course analysis of the number of LM in left and right lobes assessed in MRI for Ctrl (n=7)), SHAM (n=14) and pHx (n=15) group; (F) Time course analysis of the individual growth in volume of LM in MRI for Ctrl (n=7), SHAM (n=14) and pHx (n=12) group; (G) Representative immunohistochemistry of Ki67 of healthy liver following SHAM- and pHx-surgery. Nuclear counterstaining was performed with hematoxylin, red arrows point to Ki67+ cells; (H) Boxplot representing the relative expression of MKi67 in healthy liver tissue analyzed by qPCR in PO (n=14), Ctrl (n=4), SHAM (n=10) and pHx (n=12) group; (I) Immunohistochemistry of Ki67 of liver metastasis. Nuclear counterstaining was performed with hematoxylin; (J) Boxplot representing the relative expression of Mki67 in liver metastasis analyzed by qPCR for PO (n=5), Ctrl (n=3), SHAM (n=8) and pHx (n=14) group. (Scale bars = 100 µm, bar plots represent mean ± standard error of the mean (SEM), p-values calculated via one-way ANOVA Tukey test, * = p<0.05, **, p <= 0.01 *** = p<0.001).
Figure 3
Figure 3
pHx induces neutrophil accumulation and increases bacterial abundance in the residual liver. (A) Flow cytometric analysis with staining of different populations of innate immune cells in healthy liver tissue (neutrophils: CD45+/CD11b+/Ly6G+/CD64-, monocytes: CD45+/CD11b+/Ly6G-/CD64+) for PO (n=21), SHAM (n=8) and pHx (n=19) group, (B) Time course of infiltration of the liver with innate immune cells before POD5 (range POD3–5) and after POD5 (range POD7–14) for PO (n=21), SHAM<POD5 (n=3), SHAM>POD5 (n=6), pHx<POD5 (n=5) and pHx>POD5 (n=14) group; (C) Concentration (ng/µl) of bacterial DNA in healthy liver measured with qPCR for Ctrl (n=5), SHAM (n=5) and pHx (n=7) group; (D) FACS analysis of different populations of adaptive immune cells in healthy liver tissue following pHx (NK cells: CD45+/CD3-/NK1.1+, T cells: CD45+/CD3+/NK1.1-, B cells: CD45+/CD3-/B220+) for PO (n=20), SHAM (n=14) and pHx (n=25) group; (E) Representative immunohistochemistry of the distribution of CD4+ and CD8+ T cells in healthy liver and accumulation in premetastatic lesions (top) with absence in macroscopic metastasis (bottom). Red arrows point to the cells of interest. (Scale bars = 100 µm, bar plots represent mean ± SEM). n.s. non significant.
Figure 4
Figure 4
Partial hepatectomy is associated with upregulation of gene sets associated with metastasis in the liver. (A) Volcano plot of differently expressed genes (DEGs) in RNA sequencing from healthy liver tissue of 4 pHx and 4 PO samples. The 10 DEGs with the highest or lowest log2 fold change were labeled; (B) Heatmap from all DEGs with a base count mean of > 10 visualized by Z-scores; (C) Overview of 5 most enriched and 2 most depleted hallmark terms in gene set analysis (GSEA) following pHx; (D) Cnet plot visualizing all DEGs related to hallmarks E2F targets and G2M checkpoint and their overlap; (E-G) GSEA for hallmarks angiogenesis (E), hypoxia (F) and inflammatory response (G) and heatmap of the respective 10 leading edge genes (right) visualized by Z-scores; (H) Cnet plot of DEGs related to hallmarks angiogenesis, hypoxia, and inflammatory response.
Figure 5
Figure 5
Partial hepatectomy induces premetastatic niche (PMN) formation in the liver. (A) Relative mRNA levels (normalized on preoperative values) of the PMN-associated genes S100a9, Il6, Fn1, Hif1a, Lox, Vegfa, Tgfb1, Timp1, Mmp2 and Mmp9 in healthy liver tissue analyzed by qPCR for PO (n=26), Ctrl (n=4), SHAM (n=17) and pHx (n=26) groups; (B, C) Western Blot analyses of the expression of the premetastatic niche factors S100A8 and MMP9 from healthy liver (top). β-actin was used as loading control; (D, E) Representative IHC stainings of liver sections (bottom) of S100A8 and MMP9, red square marking perivascular premetastatic lesions (scale bars = 100 µm). (Bar plots represent mean ± SEM, p-values calculated via one-way ANOVA Tukey test, * = p<0.05, n.s. non significant.
Figure 6
Figure 6
pHx induces tight junction formation in the liver which may impact tumor cell seeding. (A) Relative expression of tight junction (TJ) genes Cldn1, Cldn2, Cldn5, Ocln and Zo1 in healthy liver analyzed with qPCR for PO (n=17), Ctrl (n=4), SHAM (n=12) and pHx (n=20) groups; (B) Western Blot of selected tight junction proteins Claudin2, Occludin and ZO-1 in the liver. β-actin and β-tubulin were used as loading control; (C) Gene Set Enrichment Analysis of bulk RNA sequencing from healthy livers for the hallmark apical junction with heatmap of the 10 leading genes involved according to Z-scores; (D) Relative gene expression of Cldn5, Ocln and Zo1 in healthy cecum analyzed with qPCR for PO (n=4), Ctrl (n=4), SHAM (n=4) and pHx (n=6) groups; (E) Representative Western Blot analysis of protein expression of Occludin in the cecum. β-actin was used as loading control; (F) Relative expression of Ocln in primary tumors analyzed with qPCR for PO (n=9), Ctrl (n=4), SHAM (n=7) and pHx (n=17) groups; (G) Immunofluorescence stainings of tight junction proteins (Claudin-2, E-cadherin, and ZO-1) in healthy epithelium and primary CRC (scale bar = 100 µm). Counterstaining of the nuclei was performed with DAPI. The white dashed lines mark the border between intact and benign epithelial cells and the primary tumors. (Bar plots represent mean ± SEM, n.s. non significant).

References

    1. Sung H, Ferlay J, Siegel RL, Laversanne M, Soerjomataram I, Jemal A, et al. . Global cancer statistics 2020: GLOBOCAN estimates of incidence and mortality worldwide for 36 cancers in 185 countries. CA Cancer J Clin. (2021) 71:209–49. doi: 10.3322/caac.21660 - DOI - PubMed
    1. Brenner H, Kloor M, Pox CP. Colorectal cancer. Lancet. (2014) 383:1490–502. doi: 10.1016/S0140-6736(13)61649-9 - DOI - PubMed
    1. Simmonds PC, Primrose JN, Colquitt JL, Garden OJ, Poston GJ, Rees M. Surgical resection of hepatic metastases from colorectal cancer: A systematic review of published studies. Br J Cancer. (2006) 94:982–99. doi: 10.1038/sj.bjc.6603033 - DOI - PMC - PubMed
    1. Brouquet A, Abdalla EK, Kopetz S, Garrett CR, Overman MJ, Eng C, et al. . High survival rate after two-stage resection of advanced colorectal liver metastases: Response-based selection and complete resection define outcome. J Clin Oncol. (2011) 29:1083–90. doi: 10.1200/JCO.2010.32.6132 - DOI - PMC - PubMed
    1. Petrowsky H, Linecker M, Raptis DA, Kuemmerli C, Fritsch R, Kirimker OE, et al. . First long-term oncologic results of the ALPPS procedure in a large cohort of patients with colorectal liver metastases. Ann Surg. (2020) 272:793–800. doi: 10.1097/SLA.0000000000004330 - DOI - PubMed