. 2024 Jun 11:15:1424752.
doi: 10.3389/fimmu.2024.1424752. eCollection 2024.

T cell-related ubiquitination genes as prognostic indicators in hepatocellular carcinoma

Affiliations

T cell-related ubiquitination genes as prognostic indicators in hepatocellular carcinoma

Chaobo Chen et al. Front Immunol. .

Abstract

Background: T lymphocytes, integral to the adaptive immune system, wield pivotal influence in bolstering anti-tumor responses, and are strictly regulated by ubiquitination modification. The objective of this investigation was to devise a novel prognostic and immunotherapeutic efficacy predictor for hepatocellular carcinoma patients utilizing T cell-related ubiquitination genes (TCRUG).

Method: The single-cell RNA sequencing (scRNA-seq) data and bulk RNA data of HCC patients are derived from the GEO database and TCGA database. Based on the processing of scRNA-seq, T cell marker genes are obtained and TCRUG is obtained. Further combined with WGCNA, differential analysis, univariate Cox regression analysis, LASSO analysis, and multivariate Cox regression analysis to filter and screen TCRUG. Finally construct a riskscore for predicting the prognosis of HCC patients, the predictive effect of which is validated in the GEO dataset. In addition, we also studied the correlation between riskscore and immunotherapy efficacy. Finally, the oncogenic role of UBE2E1 in HCC was explored through various in vitro experiments.

Result: Based on patients' scRNA-seq data, we finally obtained 3050 T cell marker genes. Combined with bulk RNA data and clinical data from the TCGA database, we constructed a riskscore that accurately predicts the prognosis of HCC patients. This riskscore is an independent prognostic factor for HCC and is used to construct a convenient column chart. In addition, we found that the high-risk group is more suitable for immunotherapy. Finally, the proliferation, migration, and invasion abilities of HCC cells significantly decreased after UBE2E1 expression reduction.

Conclusion: This study developed a riskscore based on TCRUG that can accurately and stably predict the prognosis of HCC patients. This riskscore is also effective in predicting the immune therapy response of HCC patients.

Keywords: HCC; T cell; UBE2E1; immunotherapy response; prognosis; ubiquitination modification.


Conflict of interest statement

The authors declare that the research was conducted in the absence of any commercial or financial relationships that could be construed as a potential conflict of interest.

Figures

Figure 1
Figure 1
Single-cell sequencing analysis for screening T cell-related genes. (A–C) The violin plots show the nFeature_RNA, nCount_RNA, and percent_MT of 10 HCC samples. (D) The volcano plot displays 1500 highly variable genes. (E) PCA and tSNE clustering divided cells into 28 clusters. (F) The heatmap displays the major differentially expressed genes in different clusters. (G) The singleR package annotated cells and categorized them into 8 major cell groups. (H) The bubble plot illustrates the major differentially expressed genes in different cell types. (I–P) The violin plots show the major differentially expressed genes in different cell types.
Figure 2
Figure 2
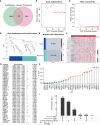
WGCNA combined with differential and prognosis analysis to identify key genes. (A) The Venn diagram illustrates the intersection of T cell marker genes and ubiquitin proteasome system genes. (B, C) The WGCNA algorithm demonstrates the optimal soft threshold. (D) The gene dendrogram displays genes are well clustered into 2 categories. (E) MEturquoise module genes are found to be closely associated with survival time. (F) The heatmap shows the differential genes of the MEturquoise module between cancer tissues and normal tissues. (G) COX analysis shows 41 genes with prognostic value. (H) KM analysis shows 32 genes with prognostic value. (I) The UpSet plot shows the intersection of differential analysis, KM analysis, and COX analysis with 28 genes.
Figure 3
Figure 3
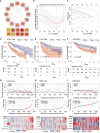
LASSO-COX algorithm constructs a risk prognosis model and validation. (A) The PPI network shows the correlation and importance of key genes. (B, C) Genes suitable for constructing the optimal model were selected using the LASSO-COX algorithm. (D–F) KM analysis revealed that patients in the high-risk group had a worse prognosis than those in the low-risk group in different datasets. (G–I) Survival analysis revealed a higher mortality rate in the high-risk group, and the heatmap demonstrated higher expression levels of UBE2E1, PSMD1, RNF10, and IVNS1ABP in the high-risk group, while FBXL5 exhibited higher expression levels in the low-risk group.
Figure 4
Figure 4
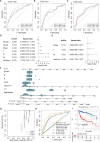
The efficacy validation of the riskscore model and the construction and validation of clinical predictive models. (A–C) ROC curves show the AUC values for patients in different datasets at 1, 3, and 5 years. (D, E) Univariate and multivariate COX analyses revealed that the riskscore is a valuable independent prognostic factor. (F) The nomogram was constructed by integrating the riskscore and clinical factors to predict patient survival at 1, 3, and 5 years. (G) The calibration curve illustrates that the model can reasonably predict patient survival. (H) ROC curves demonstrate that the AUC value of the nomogram score can reach 0.858. (I) KM analysis revealed that patients with high nomogram scores had a worse prognosis.
Figure 5
Figure 5
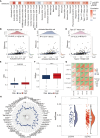
Analysis of Riskscore and Immune Landscape. (A) The correlation between riskscore and 28 immune cells was calculated using the ssGSEA algorithm. (B–D) Correlation analysis found that Activated CD4 T cell, Activated dendritic T cell, and Type 2 helper cell had the highest correlation with riskscore (P<0.001, R>0.3). (E) Differential analysis found that the MSI score was higher in the high-risk group. (F) Differential analysis found that the high-risk group had a higher tumor stemness score. (G) MMR genes were found to be closely associated with riskscore. (H) Radar plots showed the correlation between riskscore and multiple immune checkpoints. (I) Patients with higher riskscore were more likely to experience remission according to the IMvigor210 dataset. * represents p < 0.05, ** represents p < 0.01, and *** represents p < 0.001.
Figure 6
Figure 6
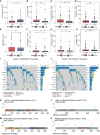
Analysis of Drug Sensitivity and Mutation in Riskscore. (A–H) The IC50 of 5_Fluorouracil and Vinblastine was lower in the low-risk group, while it was lower for Sorafenib, Camptothecin, Gemcitabine, and Irinotecan in the high-risk group. There was no significant difference in the IC50 between the two groups for Oxaliplatin and Cisplatin. (I, J) The waterfall plot revealed different mutated genes and mutation rates between the high and low-risk groups. (K–N) Mutation rates and mutation analysis of the four key genes in the model. ns represents p > 0.05, ** represents p < 0.01, and *** represents p < 0.001.
Figure 7
Figure 7
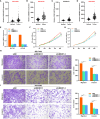
CCK8 and Transwell experiments revealed that UBE2E1 promotes proliferation and migration of HCC. (A–D) UBE2E1 was found to be expressed higher in tumor tissues than in normal tissues in both datasets. (E) RT-qPCR validation confirmed that UBE2E1 was stably knocked down in BEL7402 and HCCLM3 cell lines. (F, G) CCK8 experiments revealed that knocking down UBE2E1 could inhibit the proliferation of liver cancer cells. (H, I) Transwell experiments revealed that knocking down UBE2E1 could inhibit the migration ability of liver cancer cells. *** represents p < 0.001.

Similar articles

Cited by

References

    1. Sung H, Ferlay J, Siegel RL, Laversanne M, Soerjomataram I, Jemal A, et al. . Global cancer statistics 2020: GLOBOCAN estimates of incidence and mortality worldwide for 36 cancers in 185 countries. CA: Cancer J Clin. (2021) 71:209–49. doi: 10.3322/caac.21660 - DOI - PubMed
    1. Llovet JM, Kelley RK, Villanueva A, Singal AG, Pikarsky E, Roayaie S, et al. . Hepatocellular carcinoma. Nat Rev Dis Primers. (2021) 7:6. doi: 10.1038/s41572-020-00240-3 - DOI - PubMed
    1. Wang Y, Deng B. Hepatocellular carcinoma: molecular mechanism, targeted therapy, and biomarkers. Cancer Metastasis Rev. (2023) 42:629–52. doi: 10.1007/s10555-023-10084-4 - DOI - PubMed
    1. Rumgay H, Arnold M, Ferlay J, Lesi O, Cabasag CJ, Vignat J, et al. . Global burden of primary liver cancer in 2020 and predictions to 2040. J Hepatol. (2022) 77:1598–606. doi: 10.1016/j.jhep.2022.08.021 - DOI - PMC - PubMed
    1. Ruf B, Heinrich B, Greten TF. Immunobiology and immunotherapy of HCC: spotlight on innate and innate-like immune cells. Cell Mol Immunol. (2021) 18:112–27. doi: 10.1038/s41423-020-00572-w - DOI - PMC - PubMed

Substances