

Profibrogenic role of IL-15 through IL-15 receptor alpha-mediated trans-presentation in the carbon tetrachloride-induced liver fibrosis model
- PMID: 38919611
- PMCID: PMC11196400
- DOI: 10.3389/fimmu.2024.1404891
Profibrogenic role of IL-15 through IL-15 receptor alpha-mediated trans-presentation in the carbon tetrachloride-induced liver fibrosis model
Abstract
Background: Inflammatory cytokines play key pathogenic roles in liver fibrosis. IL-15 is a proinflammatory cytokine produced by myeloid cells. IL-15 promotes pathogenesis of several chronic inflammatory diseases. However, increased liver fibrosis has been reported in mice lacking IL-15 receptor alpha chain (IL-15Rα), suggesting an anti-fibrogenic role for IL-15. As myeloid cells are key players in liver fibrosis and IL-15 signaling can occur independently of IL-15Rα, we investigated the requirement of IL-15 and IL-15Rα in liver fibrosis.
Methods: We induced liver fibrosis in Il15-/- , Il15ra-/- and wildtype C57BL/6 mice by the administration of carbon tetrachloride (CCl4). Liver fibrosis was evaluated by Sirius red and Mason's trichrome staining and α-smooth muscle acting immunostaining of myofibroblasts. Gene expression of collagens, matrix modifying enzymes, cytokines and chemokines was quantified by RT-qPCR. The phenotype and the numbers of intrahepatic lymphoid and myeloid cell subsets were evaluated by flow cytometry.
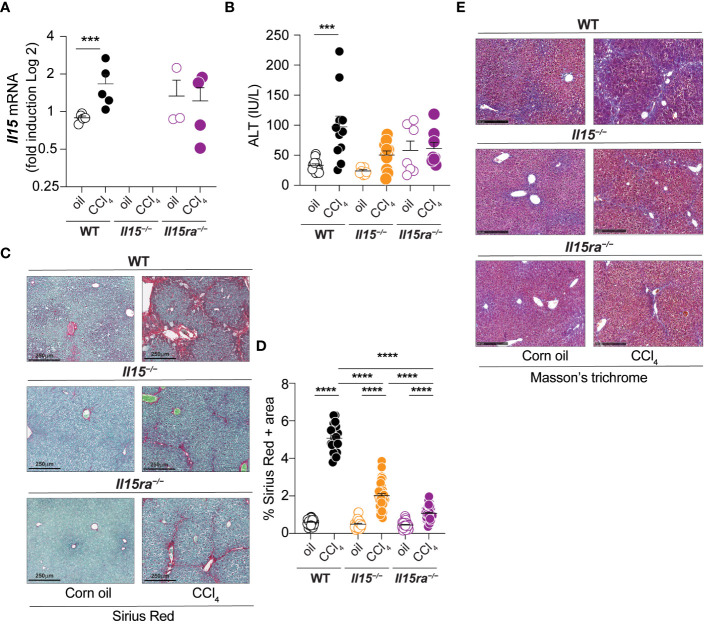
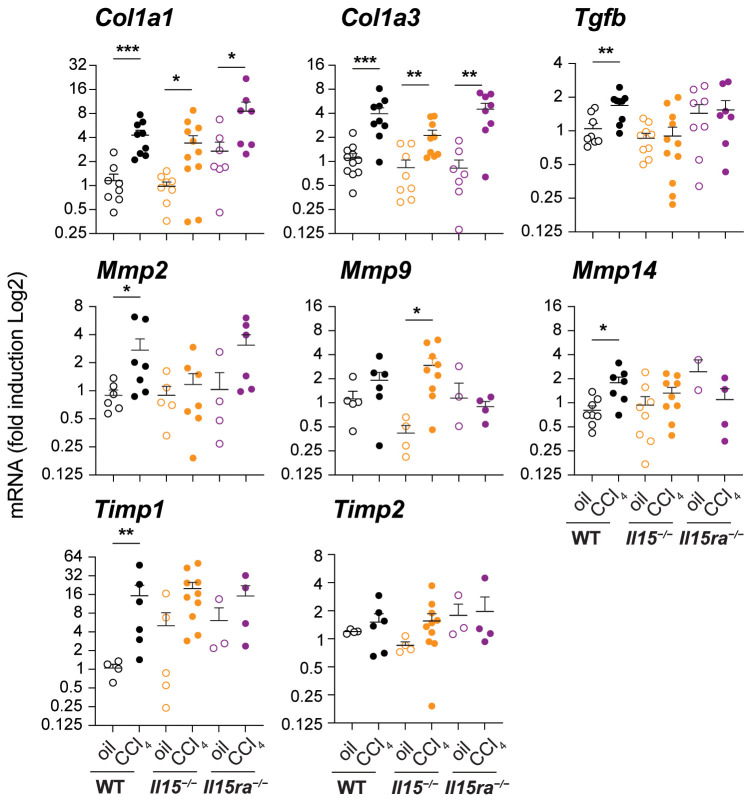
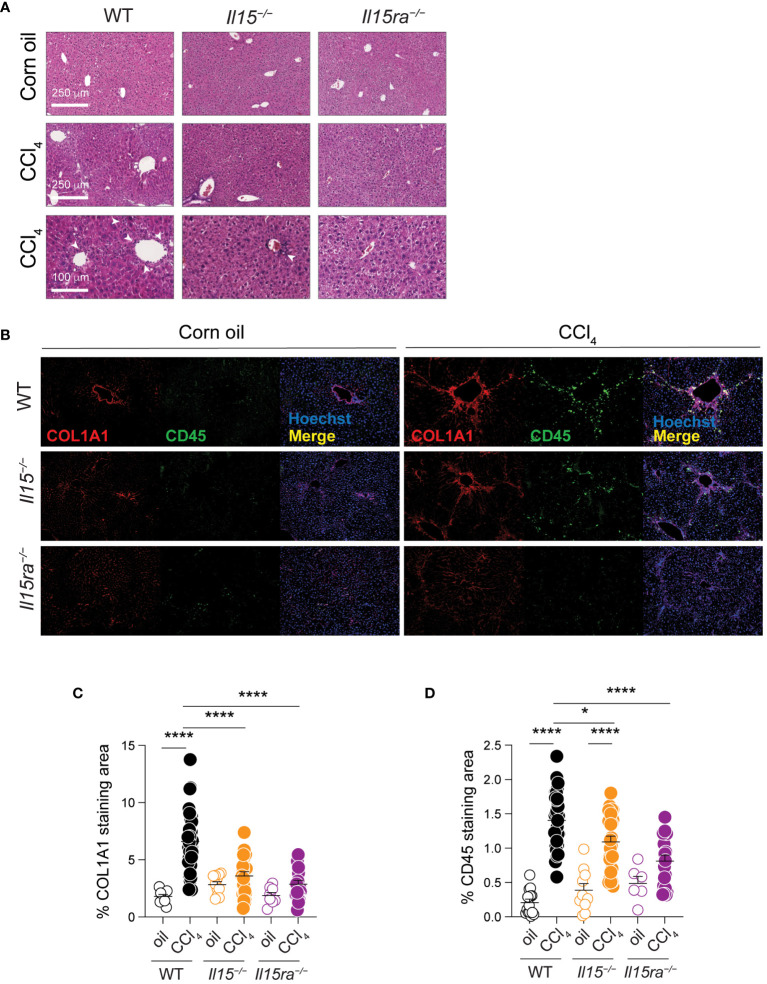
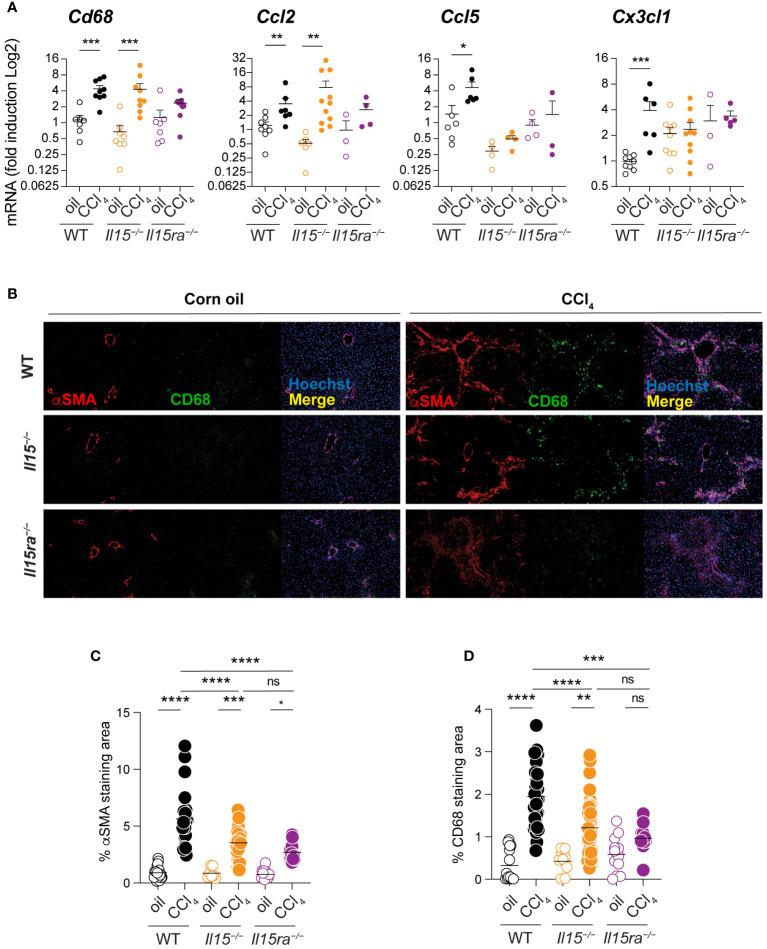
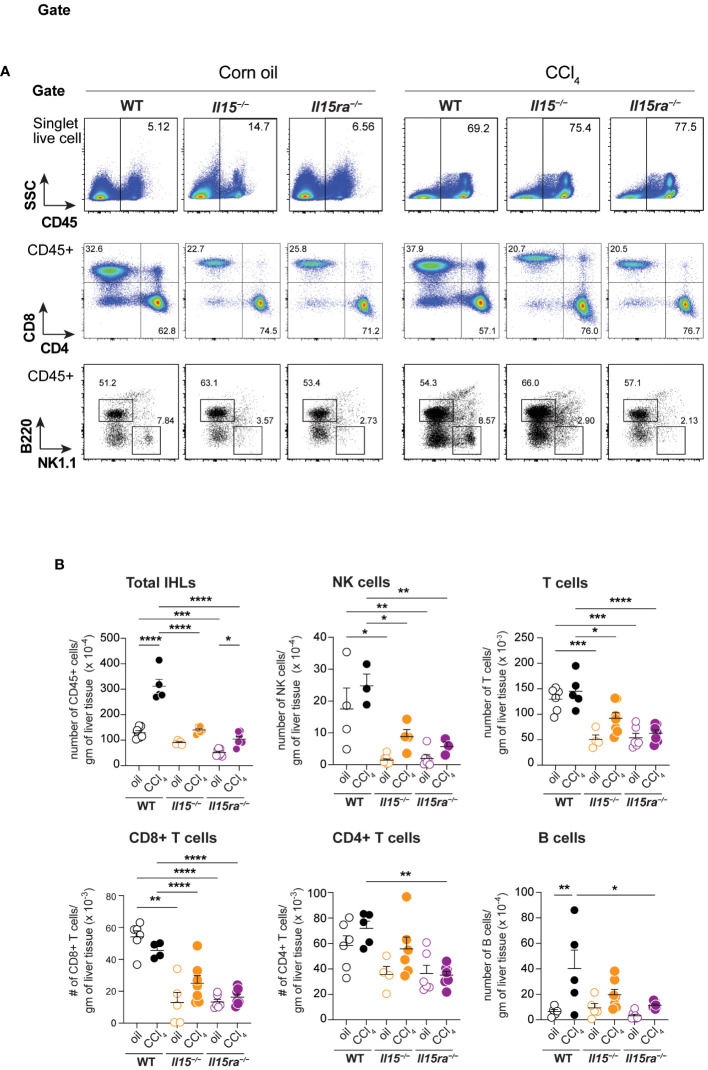
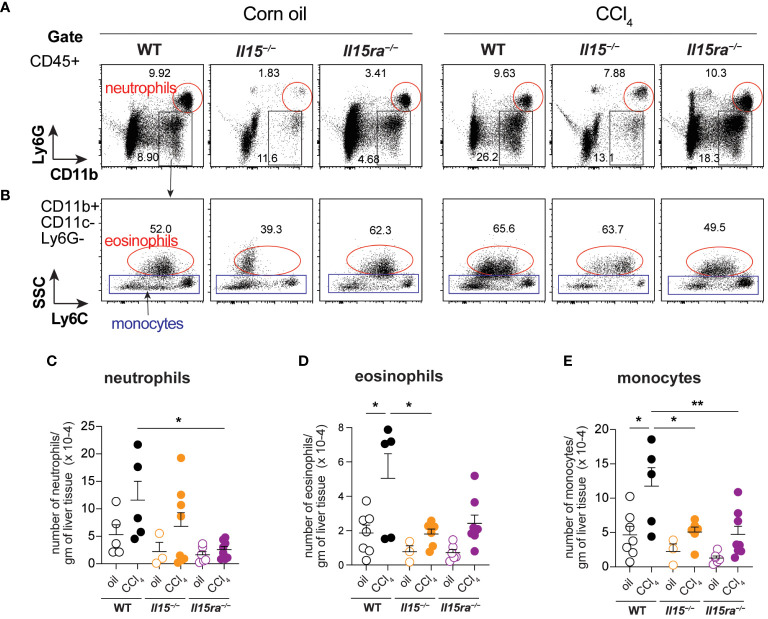
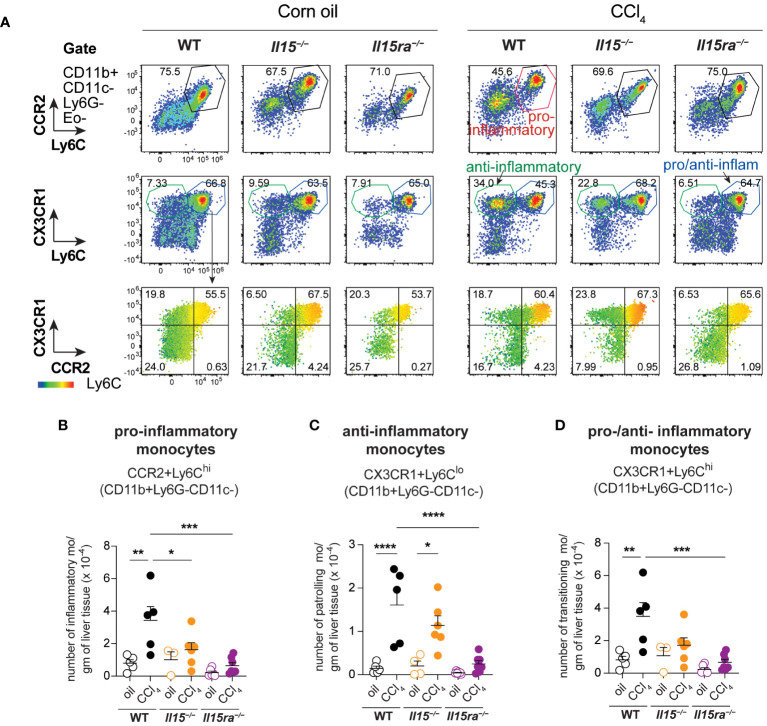
Results: Both Il15-/- and Il15ra-/- mice developed markedly reduced liver fibrosis compared to wildtype control mice, as revealed by reduced collagen deposition and myofibroblast content. Il15ra-/- mice showed further reduction in collagen deposition compared to Il15-/- mice. However, Col1a1 and Col1a3 genes were similarly induced in the fibrotic livers of wildtype, Il15-/- and Il15ra-/- mice, although notable variations were observed in the expression of matrix remodeling enzymes and chemokines. As expected, Il15-/- and Il15ra-/- mice showed markedly reduced numbers of NK cells compared to wildtype mice. They also showed markedly less staining of CD45+ immune cells and CD68+ macrophages, and significantly reduced inflammatory cell infiltration into the liver, with fewer pro-inflammatory and anti-inflammatory monocyte subsets compared to wildtype mice.
Conclusion: Our findings indicate that IL-15 exerts its profibrogenic role in the liver by promoting macrophage activation and that this requires trans-presentation of IL-15 by IL-15Rα.
Keywords: IL-15; IL-15Rα; carbon tetra chloride (CCl) 4; liver fibrosis; pre-clinical study.
Copyright © 2024 Cloutier, Variya, Akbari, Rexhepi, Ilangumaran and Ramanathan.
Conflict of interest statement
The authors declare that the research was conducted in the absence of any commercial or financial relationships that could be construed as a potential conflict of interest.
Figures
Similar articles
-
Hepatic stellate cell-intrinsic role of SOCS1 in controlling hepatic fibrogenic response and the pro-inflammatory macrophage compartment during liver fibrosis.Front Immunol. 2023 Oct 4;14:1259246. doi: 10.3389/fimmu.2023.1259246. eCollection 2023. Front Immunol. 2023. PMID: 37860002 Free PMC article.
-
NLRC5 Deficiency Deregulates Hepatic Inflammatory Response but Does Not Aggravate Carbon Tetrachloride-Induced Liver Fibrosis.Front Immunol. 2021 Oct 12;12:749646. doi: 10.3389/fimmu.2021.749646. eCollection 2021. Front Immunol. 2021. PMID: 34712238 Free PMC article.
-
Apolipoprotein A4 regulates the immune response in carbon tetrachloride-induced chronic liver injury in mice.Int Immunopharmacol. 2021 Jan;90:107222. doi: 10.1016/j.intimp.2020.107222. Epub 2020 Dec 1. Int Immunopharmacol. 2021. PMID: 33276196
-
IL-15Rα-Independent IL-15 Signaling in Non-NK Cell-Derived IFNγ Driven Control of Listeria monocytogenes.Front Immunol. 2021 Dec 10;12:793918. doi: 10.3389/fimmu.2021.793918. eCollection 2021. Front Immunol. 2021. PMID: 34956227 Free PMC article.
-
IRF-1 promotes liver transplant ischemia/reperfusion injury via hepatocyte IL-15/IL-15Rα production.J Immunol. 2015 Jun 15;194(12):6045-56. doi: 10.4049/jimmunol.1402505. Epub 2015 May 11. J Immunol. 2015. PMID: 25964490 Free PMC article.
Cited by
-
Alterations in Immune Cell Profiles in the Liver in Diabetes Mellitus: A Systematic Review.Int J Mol Sci. 2025 Apr 24;26(9):4027. doi: 10.3390/ijms26094027. Int J Mol Sci. 2025. PMID: 40362271 Free PMC article.
References
MeSH terms
Substances
LinkOut - more resources
Full Text Sources
Medical
Molecular Biology Databases
Research Materials
Miscellaneous