. 2024 Jun 11:15:1393851.
doi: 10.3389/fimmu.2024.1393851. eCollection 2024.

Elucidating the molecular landscape of tendinitis: the role of inflammasome-related genes and immune interactions

Affiliations

Elucidating the molecular landscape of tendinitis: the role of inflammasome-related genes and immune interactions

Hongwei Xu et al. Front Immunol. .

Abstract

Tendinitis, characterized by the inflammation of tendons, poses significant challenges in both diagnosis and treatment due to its multifaceted etiology and complex pathophysiology. This study aimed to dissect the molecular mechanisms underlying tendinitis, with a particular focus on inflammasome-related genes and their interactions with the immune system. Through comprehensive gene expression analysis and bioinformatics approaches, we identified distinct expression profiles of inflammasome genes, such as NLRP6, NLRP1, and MEFV, which showed significant correlations with immune checkpoint molecules, indicating a pivotal role in the inflammatory cascade of tendinitis. Additionally, MYD88 and CD36 were found to be closely associated with HLA family molecules, underscoring their involvement in immune response modulation. Contrary to expectations, chemokines exhibited minimal correlation with inflammasome genes, suggesting an unconventional inflammatory pathway in tendinitis. Transcription factors like SP110 and CREB5 emerged as key regulators of inflammasome genes, providing insight into the transcriptional control mechanisms in tendinitis. Furthermore, potential therapeutic targets were identified through the DGidb database, highlighting drugs that could modulate the activity of inflammasome genes, offering new avenues for targeted tendinitis therapy. Our findings elucidate the complex molecular landscape of tendinitis, emphasizing the significant role of inflammasomes and immune interactions, and pave the way for the development of novel diagnostic and therapeutic strategies.

Keywords: bioinformatics; gene expression; immune system; inflammasomes; tendinitis.


Conflict of interest statement

The authors declare that the research was conducted in the absence of any commercial or financial relationships that could be construed as a potential conflict of interest.

Figures

Figure 1
Figure 1
Batch correction and network analysis of tendinitis gene expression. (A) Boxplots showing sample average expression levels before and after batch correction. Initially, clear differences are observed between the datasets. Following batch correction using the Combat function of the sva package, expression levels align, demonstrating effective normalization. (B) Principal Component Analysis (PCA) of post-batch correction samples. The PCA plot shows a uniform distribution of sample features across datasets, indicating successful batch effect mitigation and suitability for further analysis. (C) Analysis of network topology for various soft-thresholding powers in Weighted Gene Co-expression Network Analysis (WGCNA). The left panel shows scale independence as a function of the soft-thresholding power, with a chosen power of 4 achieving the criteria of R^2 = 0.8 for scale-free topology. The right panel displays mean connectivity, affirming the network’s robustness. (D) Heatmap of module-trait relationships from WGCNA. Sixteen color-coded gene modules are correlated with tendinitis traits, with the yellow module showing the highest correlation (correlation = 0.3, P < 0.05), suggesting a significant association with tendinitis. (E) Dendrogram of genes identified by WGCNA, clustered based on dynamic tree cut, with module colors indicated below. This dendrogram and color band illustrate the gene modules resulting from hierarchical clustering of gene expression data. (F) Scatterplot of Module Membership vs. Gene Significance in the yellow module. Genes with a module membership > 0.8 and gene significance > 0.2 are highlighted, identifying ADNP, MSH6, and ZMPSTE24 as key genes associated with tendinitis within this module.
Figure 2
Figure 2
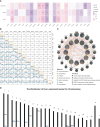
Inflammasome gene correlations and chromosomal localization in tendinitis. (A) Correlation heatmap of core tendinitis genes (ADNP, MSH6, ZMPSTE24) and twelve inflammasome-related genes. The heatmap indicates significant positive correlations, suggesting their involvement in inflammasome pathways related to tendinitis. (B) Expression correlation matrix for the 12 tendinitis-associated inflammasome genes. The matrix reveals significant correlations between most gene pairs, highlighting potential interactions contributing to the disease mechanism. (C) Network visualization from GENEMANIA analysis showing extensive protein-protein interactions among the 12 inflammasome genes, primarily related to Toll-like receptor signaling and inflammasome assembly. (D) Chromosomal distribution map of the 12 tendinitis-associated inflammasome genes, illustrating their primary localization on chromosomes 1, 3, 4, 6, 7, 9, 11, 16, and 17, providing insights into their genomic context.
Figure 3
Figure 3
Machine learning models for tendinitis diagnosis based on gene expression. (A) Heatmap displaying the performance of 45 machine learning model combinations using various algorithms, including Lasso, NaiveBayes, and SVM. Models are ranked by the average AUC of the ROC curve, with SVM-based models showing the highest diagnostic performance (average AUC = 0.858). (B, C) Calibration curves for the predictive model built using the 12 tendinitis-associated inflammasome genes. Curves for both training and validation sets indicate good calibration, suggesting the model’s accuracy in predicting tendinitis. (D, E). Decision Curve Analysis (DCA) for the tendinitis prediction model. The DCA curves demonstrate the model’s clinical usefulness across different threshold probabilities, indicating its potential in improving clinical decision-making.
Figure 4
Figure 4
Expression levels of CD36 (A) and MYD88 (B) in patients with tendinitis.
Figure 5
Figure 5
Differential pathway activation in tendinitis via GSEA and KEGG analysis (A) Network plot from Gene Set Enrichment Analysis (GSEA) showing clusters of gene sets associated with tendinitis. Gene sets related to intrinsic apoptosis, spindle assembly, and lymphocyte activation are upregulated (red nodes), while pathways involved in calcium ion transport are downregulated (blue nodes), indicating distinct pathway activation profiles in tendinitis. (B) Bubble plot of KEGG pathways enrichment analysis for the 12 tendinitis-associated inflammasome genes. Bubble size corresponds to pathway size, and color indicates the normalized enrichment score (NES). Toll-like receptor and Nod-like receptor pathways are significantly enriched, highlighting their potential involvement in tendinitis pathogenesis.
Figure 6
Figure 6
Immune cell abundance and gene correlation in tendinitis. (A) Boxplots showing the distribution of immune cell types in tendinitis versus control samples, estimated by ssGSEA. A decrease in B cells, mast cells, and Tfh cells, and an increase in Treg cells in tendinitis samples suggest alterations in the immune cell composition linked to the disease’s immunological environment. (B) Positive correlation between B cells and TLR6 expression. (C) Negative correlation between mast cells and MYD88 expression. (D–G): Various correlations between Tfh cells and the genes CD36, MEFV, NLRP1, and NLRP6. (H–J): Correlations of Treg cells with ATAT1, TLR6, and MYD88, illustrating complex relationships between inflammasome gene expression and immune cell changes in tendinitis.
Figure 7
Figure 7
Tendinitis microenvironment and immune process associations. (A) Heatmap of the correlation between CD36, MYD88, CPTP, TLR6, and ESTIMATE scores, which assess the immune and stromal components of the tumor microenvironment. The significant positive correlations of CD36 and MYD88 suggest their involvement in promoting an immune microenvironment, while CPTP and TLR6 show significant negative correlations. (B–M): Radar charts depicting the relative abundance of different immune processes and their correlation with the 12 tendinitis-associated inflammasome genes, as assessed by ssGSEA. The charts reveal varying degrees of correlation, with most genes showing significant immunological activity and relevance, except for DHX33, NLRC3, and TLR6, providing a comprehensive view of the immune activity associated with these genes.
Figure 8
Figure 8
Correlations between tendinitis-associated inflammasome genes and immune molecules. (A) Heatmap illustrating the correlation between the 12 tendinitis-associated inflammasome genes and various immune checkpoint molecules. NLRP6, NLRP1, and MEFV exhibit significant positive correlations with numerous immune checkpoints, suggesting their involvement in immune regulation pathways in tendinitis. (B) Correlation heatmap showing the relationships between MYD88, CD36, and a spectrum of HLA family molecules. Both MYD88 and CD36 show numerous positive correlations, indicating their potential role in antigen presentation and immune response in tendinitis. (C) Heatmap displaying the correlations between chemokines and the 12 tendinitis-associated inflammasome genes. The heatmap suggests minimal expression correlation, indicating a less significant role for these chemokines in inflammasome-related pathways of tendinitis. *P<0.05, **P<0.01, ***P<0.001.
Figure 9
Figure 9
Transcriptional regulation and drug predictions for tendinitis-associated genes. (A) Bar graph representing the mean rank scores of the top ten transcription factors (TFs) regulating the 12 tendinitis-associated inflammasome genes. SP110, CREB5, TET2, BATF2, NFE4, FLI1, ELF4, FOXP3, ZNF831, and SP140L are ranked based on their importance in gene regulation, providing insights into the transcriptional control mechanisms in tendinitis. (B) Network interaction diagram depicting the regulatory relationships between the identified TFs and the 12 tendinitis-associated inflammasome genes. The diagram highlights the complex interplay between these TFs and genes, suggesting a multifactorial regulatory landscape in tendinitis. (C) Sankey diagram derived from the DGidb database, predicting 21 drugs with therapeutic potential targeting the tendinitis-associated inflammasome genes. The diagram links each gene with corresponding drugs, illustrating potential treatment pathways for tendinitis.

Similar articles

References

    1. Churgay CA. Diagnosis and treatment of biceps tendinitis and tendinosis. Am Family physician. (2009) 80:470–6. - PubMed
    1. Crone M, Keating R. Acute longus colli calcific tendinitis. Clin Rheumatol. (2023). doi: 10.1007/s10067-023-06815-1 - DOI - PubMed
    1. Ebenbichler GR, Erdogmus CB, Resch KL, Funovics MA, Kainberger F, Barisani G, et al. . Ultrasound therapy for calcific tendinitis of the shoulder. N Engl J Med. (1999) 340:1533–8. doi: 10.1056/NEJM199905203402002 - DOI - PubMed
    1. Chang TJ. Sports medicine. Clinics podiatric Med Surg. (2023) 40:xiii–xiv. doi: 10.1016/j.cpm.2022.10.001 - DOI - PubMed
    1. Löllgen H, Leyk D. Exercise testing in sports medicine. Deutsches Arzteblatt Int. (2018) 115:409–16. - PMC - PubMed