. 2024 Jul 19;19(7):1554-1562.
doi: 10.1021/acschembio.4c00210. Epub 2024 Jun 26.

N-Acyl- N-Alkyl Sulfonamide Probes for Ligand-Directed Covalent Labeling of GPCRs: The Adenosine A2B Receptor as Case Study

Affiliations

N-Acyl- N-Alkyl Sulfonamide Probes for Ligand-Directed Covalent Labeling of GPCRs: The Adenosine A2B Receptor as Case Study

Bert L H Beerkens et al. ACS Chem Biol. .

Abstract

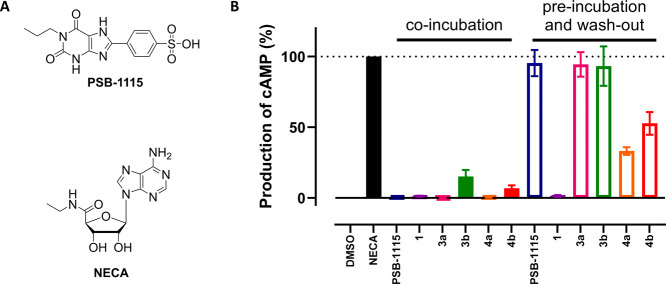
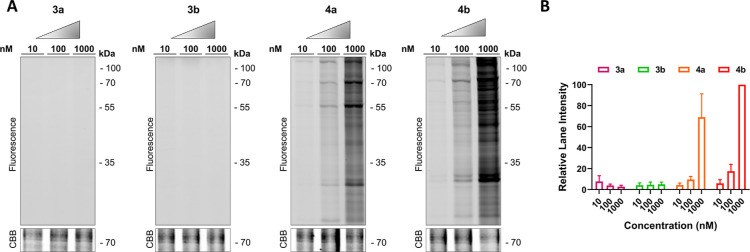
Small molecular tool compounds play an essential role in the study of G protein-coupled receptors (GPCRs). However, tool compounds most often occupy the orthosteric binding site, hampering the study of GPCRs upon ligand binding. To overcome this problem, ligand-directed labeling techniques have been developed that leave a reporter group covalently bound to the GPCR, while allowing subsequent orthosteric ligands to bind. In this work, we applied such a labeling strategy to the adenosine A2B receptor (A2BAR). We have synthetically implemented the recently reported N-acyl-N-alkyl sulfonamide (NASA) warhead into a previously developed ligand and show that the binding of the A2BAR is not restricted by NASA incorporation. Furthermore, we have investigated ligand-directed labeling of the A2BAR using SDS-PAGE, flow cytometric, and mass spectrometry techniques. We have found one of the synthesized probes to specifically label the A2BAR, although detection was hindered by nonspecific protein labeling most likely due to the intrinsic reactivity of the NASA warhead. Altogether, this work aids the future development of ligand-directed probes for the detection of GPCRs.


Conflict of interest statement

The authors declare no competing financial interest.

Figures

Figure 1
Figure 1
Schematic overview of the ligand-directed labeling of GPCRs. (A) The probe binds to the receptor through its conjugated high-affinity ligand. (B) A nucleophilic amino acid residue attacks the electrophilic group of the probe, inducing cleavage between the ligand and the reporter. The reporter group, in this case an alkyne group as click handle, is now covalently bound to the receptor, while the ligand is allowed to leave the binding pocket (reversible mode of binding). (C) The substituted alkyne group can be further derivatized by performing click chemistry using azide-containing detection moieties. This figure was partly created with Protein Imager, using the structure of the A2BAR (PDB: 8HDO).
Scheme 1
Scheme 1. (A) Molecular Structures of the Previously Synthesized Covalent A2BAR Antagonist 1 (LUF7982), the NASA Warhead, and the Design of the Ligand-Directed Probes; R1 = Location of the Molecular Scaffold of a High-Affinity Ligand; R2 = Location of the Reporter Group for Detection; (B) Synthetic Scheme Towards Probes 4a and 4b
Reagents and conditions. (a) NH4OH (28–30%), RT, 2 h, 75%; (b) EDC·HCl, respective benzoic acid, DMAP, DIPEA, dry DMF, RT, overnight, 41–64%; (c) bromoacetonitrile, DIPEA, RT, 6–8 days, 12–41%.
Figure 2
Figure 2
(A) Molecular structures of the reference agonist NECA and the reference antagonist PSB-1115. (B) Functional wash-out experiments. CHO-A2BAR cells were incubated with reversible antagonist PSB-1115, irreversible antagonist 1, inactive probe 3a, inactive probe 3b, active probe 4a, active probe 4b or 0.1% DMSO (vehicle control in case of “DMSO” and “NECA”). The A2BAR was activated upon incubation with 100 nM of the agonist NECA, either through co-incubation with the respective ligand (“co-incubation”), or after pre-incubation with the respective ligands, followed by subsequent washing steps (“pre-incubation and wash-out”). DMSO (0.1%) was used as vehicle control for the NECA stimulation. Data represent the mean ± SEM of three individual experiments.
Figure 3
Figure 3
Ligand-directed labeling of the respective probes in CHO-A2BAR membrane fractions. CHO-A2BAR membrane fractions were incubated for 2 h with various concentrations of 3a, 3b, 4a, or 4b. Probe-bound proteins were clicked to Cy5–N3, denatured, and resolved by SDS-PAGE. (A) Gel images as taken using in-gel fluorescence. Coomassie Brilliant Blue (CBB) staining was used as a loading control. (B) Quantification of the lane intensities. The lane intensities were taken and corrected for the observed amount of protein per lane upon Coomassie staining. The lane intensity of 1000 nM 4b was set to 100% and the other lanes were normalized accordingly. The mean values ± SEM of three individual experiments are shown.
Figure 4
Figure 4
Ligand-directed labeling of A2BAR in live CHO cells. CHO cells with or without stable expression of the A2BAR were pre-incubated for 30 min with medium containing either 1% DMSO (vehicle) or 10 μM of irreversible antagonist 1. The cells were subsequently incubated for 30 min with 400 nM probe in Hank’s Balanced Salt Solution (HBSS) or 1% DMSO (vehicle control). Cells were washed with PBS and membranes were collected. N-glycans were removed using PNGase (5 U) and alkyne moieties were clicked to 1 μM Cy5–N3. The samples were then denatured using Laemmli buffer and resolved by SDS-PAGE. Gels were imaged by in-gel fluorescence. CBB staining was used as the loading control. (A) Protein labeling by 4a. The arrows indicate the presumable band of the A2BAR. (B) Protein labeling by 4b. Gels are representatives of three replicates.
Figure 5
Figure 5
Labeling by probes 4a and 4b in live cell experiments. (A,B) Flow cytometry experiments. CHO cells stably overexpressing the A2BAR were pre-incubated for 30 min with 1% DMSO (vehicle) or irreversible antagonist 1 in medium, prior to incubation for 30 min with probe 4a or 4b in HBSS or 1% DMSO (vehicle control). The cells were fixed, permeabilized, clicked to Cy5–N3, and washed. The cells were then analyzed on their mean fluorescence intensity (MFI) by flow cytometry. Baseline correction was performed by subtraction of the MFI values by the average MFI value of the vehicle-treated samples. Shown are the mean values ± SEM of three individual experiments. ns = not significant. (C–F) Proteomic pull-down experiments using probe 4a. Shown are log2(fold changes) depicting the intensity scores of probe-labeled proteins in positive samples, divided by the intensity scores of probe-labeled proteins in various control samples (vehicle, pre-incubation with antagonist 1 and without expression of the A2BAR). Fold changes are depicted by color in the case of the heat map (C) and on the x-axis of the volcano plots (D–F). CHO cells with or without (“no A2BAR”) stable expression of the A2BAR were pre-incubated for 30 min with a medium containing either 1% DMSO (vehicle) or 10 μM of irreversible antagonist 1 (“1”). The cells were subsequently incubated for 30 min with 400 nM probe in HBSS (“4a”) or 1% DMSO (vehicle control; “vehicle”). Cells were washed with PBS and membranes were collected. Alkyne moieties were clicked to Biotin–N3, reduced, alkylated, and pulled down using avidin beads. Bound proteins were digested into peptides, desalted, and analyzed by LC–MS/MS. (C) Heat map of the proteins labeled by probe 4a. Shown are the top 10 proteins that showed the highest fold change over the vehicle. (D–F) Volcano plot comparing the 4a labeled proteins toward various control conditions: vehicle, pre-incubation with antagonist 1 and CHO cells without expression of the A2BAR. Fold change is depicted on the x-axis and −log(p value) on the y-axis. Protein IDs (CHO proteins) and gene names (human proteins) are given and taken from UniProt. Data originate from three replicates.

References

    1. Hauser A. S.; Attwood M. M.; Rask-Andersen M.; Schiöth H. B.; Gloriam D. E. Trends in GPCR Drug Discovery: New Agents, Targets and Indications. Nat. Rev. Drug Discovery 2017, 16 (12), 829–842. 10.1038/nrd.2017.178. - DOI - PMC - PubMed
    1. Yang D.; Zhou Q.; Labroska V.; Qin S.; Darbalaei S.; Wu Y.; Yuliantie E.; Xie L.; Tao H.; Cheng J.; Liu Q.; Zhao S.; Shui W.; Jiang Y.; Wang M. W. G Protein-Coupled Receptors: Structure- and Function-Based Drug Discovery. Signal Transduct. Target. Ther. 2021, 6 (1), 7.10.1038/s41392-020-00435-w. - DOI - PMC - PubMed
    1. Cekic C.; Linden J. Purinergic Regulation of the Immune System. Nat. Rev. Immunol. 2016, 16, 177–192. 10.1038/nri.2016.4. - DOI - PubMed
    1. Gao Z.-G.; Jacobson K. A. A2B Adenosine Receptor and Cancer. Int. J. Mol. Sci. 2019, 20, 5139.10.3390/ijms20205139. - DOI - PMC - PubMed
    1. Allard B.; Allard D.; Buisseret L.; Stagg J. The Adenosine Pathway in Immuno-Oncology. Nat. Rev. Clin. Oncol. 2020, 17 (10), 611–629. 10.1038/s41571-020-0382-2. - DOI - PubMed

LinkOut - more resources