Review
. 2024 Jun;21(215):18.
doi: 10.1098/rsif.2024.0018. Epub 2024 Jun 26.

Review of factors affecting virus inactivation in aerosols and droplets

Affiliations
Review

Review of factors affecting virus inactivation in aerosols and droplets

Alexandra K Longest et al. J R Soc Interface. 2024 Jun.

Abstract

The inactivation of viruses in aerosol particles (aerosols) and droplets depends on many factors, but the precise mechanisms of inactivation are not known. The system involves complex physical and biochemical interactions. We reviewed the literature to establish current knowledge about these mechanisms and identify knowledge gaps. We identified 168 relevant papers and grouped results by the following factors: virus type and structure, aerosol or droplet size, temperature, relative humidity (RH) and evaporation, chemical composition of the aerosol or droplet, pH and atmospheric composition. These factors influence the dynamic microenvironment surrounding a virion and thus may affect its inactivation. Results indicate that viruses experience biphasic decay as the carrier aerosols or droplets undergo evaporation and equilibrate with the surrounding air, and their final physical state (liquid, semi-solid or solid) depends on RH. Virus stability, RH and temperature are interrelated, but the effects of RH are multifaceted and still not completely understood. Studies on the impact of pH and atmospheric composition on virus stability have raised new questions that require further exploration. The frequent practice of studying virus inactivation in large droplets and culture media may limit our understanding of inactivation mechanisms that are relevant for transmission, so we encourage the use of particles of physiologically relevant size and composition in future research.

Keywords: aerosol; droplet; humidity; inactivation; virus.


Conflict of interest statement

We declare we have no competing interests.

Figures
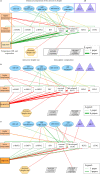
Influenza viruses network connection diagrams. Factors impacting influenza virus stability at (a) low, (b) medium and (c) high RHs.
Figure 1.
Network connection diagrams for influenza viruses. Factors impacting influenza virus stability at (a) low, (b) medium and (c) high RHs. Higher and lower temperatures refer to temperatures above and below the room temperature range (20–24°C), respectively. Green, red and yellow lines represent protective, harmful and neutral effects on virus viability, respectively. The thickness of the lines corresponds to the number of papers reporting a particular effect. The effects are defined by statistically significant differences in results or apparent trends when statistics are not available. Calculated exponential decay constants for each line are provided in electronic supplementary material, table S4. Virus subtypes and strains: avian influenza virus H6N2 (avH6N2)[A/Turkey/Mass/3740/65 (H6N2)] [44], avian influenza virus H6N1 (avH6N1)[A/Shorebird/DE Bay/230/2009 (H6N1)] [43], avian influenza virus H9N2 (avH9N2)[A/Chicken/Henan/98 (H9N2), A/Shorebird/DE/127/2003 (H9N2)] [43,44], influenza B virus (IBV)[B/Texas/02/2013] [43], human seasonal influenza A virus H1N1 (seasonal H1N1)[A/California/07/2009 (H1N1), A/Michigan/45/2015 (H1N1), A/Mexico/4108/2009 (H1N1)] [,,,–51], lab-adapted IAV H1N1 strains (lab-adapted H1N1)[A/PR/8/34 (H1N1), A/WS/33 (H1N1)] [,,,,–56], human seasonal influenza A virus H2N2 (H2N2)[A2/Japan/305/1957] [57], and human seasonal influenza A virus H3N2 (H3N2)[A/Perth/19/09 (H3N2), A/Udorn/307/1972 (H3N2), A/Panama/2007/99 (H3N2)] [35,43,58]. Figure created using ConceptDraw DIAGRAM, by CS Odessa.
Coronaviruses network connection diagram.
Figure 2.
Network connection diagram for coronaviruses. Factors impacting coronavirus stability at high RH. Higher and lower temperatures refer to temperatures above and below the room temperature range (20–24°C), respectively. Green, red and yellow lines represent protective, harmful and neutral effects on virus viability, respectively. The thickness of the lines corresponds to the number of papers reporting a particular effect. The effects are defined by statistically significant differences in results or apparent trends when statistics are not available. Calculated exponential decay constants for each line are provided in electronic supplementary material, table S5. Variants of SARS-CoV-2 in the studies include WA1/2020, REMRQ0001, Delta, England-2, O.S. and BetaCoV-2020 [,,,,–,–80]. Additional network diagrams at low and medium RHs are available in electronic supplementary material, figure S3. Figure created using ConceptDraw DIAGRAM, by CS Odessa.
Biphasic decay of viruses, and the final physical states of particles in the equilibrium phase.
Figure 3.
Biphasic decay of viruses, and the final physical states of particles in the equilibrium phase. The final physical state of particles depends on ambient RH. At high RH, the liquid-like state subjects the virions to reactions with solutes, but their concentrations are low. As RH decreases, the organic and organic–inorganic compounds can form an amorphous, (semi-) solid state that exhibits solid-like properties, which can protect the virions by hindering the diffusion of reactants. At low RH, enough water is lost that the crystalline, formed from efflorescence, or amorphous solid will inhibit inactivation. This figure is adapted from Huynh et al. [100], used under CC BY 4.0 [100].
Schematic of potential changes in pH in aerosols and droplets after exhalation into ambient air [10,55,65].
Figure 4.
(a)–(c) Schematic of potential changes in pH in aerosols and droplets after exhalation into ambient air [10,55,65]. Figure created using ConceptDraw DIAGRAM, by CS Odessa.

References

    1. Wang CC, Prather KA, Sznitman J, Jimenez JL, Lakdawala SS, Tufekci Z, Marr LC. 2021. Airborne transmission of respiratory viruses. Science 373 , eabd9149. ( 10.1126/science.abd9149) - DOI - PMC - PubMed
    1. Greenhalgh T, Jimenez JL, Prather KA, Tufekci Z, Fisman D, Schooley R. 2021. Ten scientific reasons in support of airborne transmission of SARS-CoV-2. Lancet 397 , 1603–1605. ( 10.1016/S0140-6736(21)00869-2) - DOI - PMC - PubMed
    1. Riley RL. 1982. Indoor airborne infection. Environ. Int. 8 , 317–320. ( 10.1016/0160-4120(82)90043-5) - DOI
    1. Herfst S, et al. 2017. Drivers of airborne human-to-human pathogen transmission. Curr. Opin. Virol. 22 , 22–29. ( 10.1016/j.coviro.2016.11.006) - DOI - PMC - PubMed
    1. Jones RM, Brosseau LM. 2015. Aerosol transmission of infectious disease. J. Occup. Environ. Med. 57 , 501–508. ( 10.1097/JOM.0000000000000448) - DOI - PubMed

Grants and funding

LinkOut - more resources