. 2024 Jun 4;14(6):292.
doi: 10.3390/bios14060292.

Europium Nanoparticle-Based Lateral Flow Strip Biosensors for the Detection of Quinoxaline Antibiotics and Their Main Metabolites in Fish Feeds and Tissues

Affiliations

Europium Nanoparticle-Based Lateral Flow Strip Biosensors for the Detection of Quinoxaline Antibiotics and Their Main Metabolites in Fish Feeds and Tissues

Qing Mei et al. Biosensors (Basel). .

Abstract

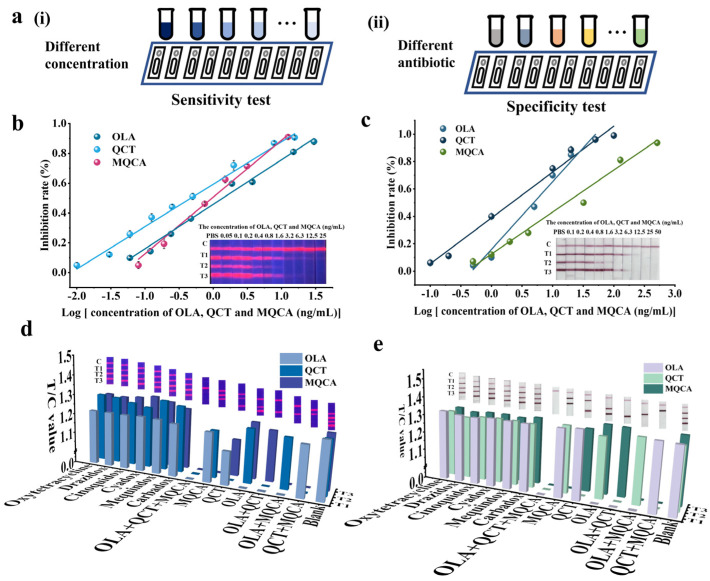
Olaquindox (OLA) and quinocetone (QCT) have been prohibited in aquatic products due to their significant toxicity and side effects. In this study, rapid and visual europium nanoparticle (EuNP)-based lateral flow strip biosensors (LFSBs) were developed for the simultaneous quantitative detection of OLA, QCT, and 3-methyl-quinoxaline-2-carboxylic acid (MQCA) in fish feed and tissue. The EuNP-LFSBs enabled sensitive detection for OLA, QCT, and MQCA with a limit of detection of 0.067, 0.017, and 0.099 ng/mL (R2 ≥ 0.9776) within 10 min. The average recovery of the EuNP-LFSBs was 95.13%, and relative standard deviations were below 9.38%. The method was verified by high-performance liquid chromatography (HPLC), and the test results were consistent. Therefore, the proposed LFSBs serve as a powerful tool to monitor quinoxalines in fish feeds and their residues in fish tissues.

Keywords: fluorescent nanomaterials; lateral flow strip biosensors; multiple detection; quinoxaline antibiotics.


Conflict of interest statement

The authors declare no conflict of interest, and also declare no competing financial interests.

Figures

Figure 1
Figure 1
Detection principle of EuNP-LFSBs. (a(i)) Preparation of three EuNP-mAb probes. The EuNP-mAb probes were obtained by the activated ester method. (a(ii)) Scanning electron microscope images of EuNP-mAbs. (b) Composition of the EuNP-LFSB system. The fabrication of EuNP-LFSBs includes five parts: a sample pad, conjugate pad, NC membrane, absorption pad, and backing card. (c) The EuNP-LFSB detection schematic. The negative results for OLA, QCT, and MQCA were indicated by the appearance of test line 1 (T1), test line 2 (T2), and test line 3 (T3), respectively, and the control line (C) on the LFSBs. On the contrary, the positive result is indicated by the absence of test lines. (d) Visual identification and quantitative analysis of EuNP-LFSBs. The results were observed by naked eyes under UV light and the fluorescence intensity on the EuNP-LFSBs was read and stored by a fluorescent strip reader.
Figure 2
Figure 2
Optimization of the EuNP-LFSB system. (a) FTIR results for OLA. (b) FTIR results for QCT. (c) FTIR results for MQCA. (d) Influence of various OLA-OVA and EuNP-OLA-mAb concentrations on the T/C value. (e) Influence of various QCT-OVA and EuNP-QCT-mAb concentrations on the T/C value. (f) Influence of various MQCA-BSA and EuNP-MQCA-mAb concentrations on the T/C value. (g) Schematic diagram of three types of mixed probe preparation. (h) Effect of different EuNP-mAb probes mixed ratio on the fluorescence intensity. (i) Position result of the three encapsulated antigens on EuNP-LFSBs. (j) Effect of reaction time on EuNP-LFSBs.
Figure 3
Figure 3
EuNP-LFSB performance evaluation. (a(i)) Schematic diagram of the sensitivity test. (a(ii)) Schematic diagram of the specificity test. (b) Sensitivity analysis of EuNP-LFSBs. The OLA standard curve was y = 0.3005x + 0.4548, R2 = 0.9906. The QCT standard curve was y = 0.2837x + 0.6035, R2 = 0.9924. The MQCA standard curve was y = 0.4036x + 0.5045, R2 = 0.9914. (c) Sensitivity analysis of AuNP-LFSBs. The OLA standard curve was y = 0.5211x + 0.1582, R2 = 0.9803. The QCT standard curve was y = 0.3367x + 0.386, R2 = 0.9884; The MQCA standard curve was y = 0.2981x + 0.1243, R² = 0.9847. (d) Specificity analysis of EuNP-LFSBs. (e) Specificity analysis of AuNPs-LFSBs.
Figure 4
Figure 4
Testing in actual samples. (a) Schematic diagram of actual sample analysis. (b) The results of EuNP-LFSBs and HPLC for 500 actual samples. (c) Table of concordance between the proposed EuNP-LFSBs and HPLC for 500 actual samples tested (sensitivity values [%] used to detect EuNP-mLFIA are shown in red; specificity values [%] are shown in black). (d) The correlation analysis of EuNP-LFSBs and HPLC. (e) Comparison of the consistency of 500 actual samples detected by EuNP-LFSBs and HPLC.

Similar articles

References

    1. Liu Z.Y., Sun Z.L. The metabolism of carbadox, olaquindox, mequindox, quinocetone and cyadox: An overview. Med. Chem. 2013;9:1017–1027. doi: 10.2174/1573406411309080002. - DOI - PubMed
    1. Liu M., Ma B., Wang Y., Chen E., Li J., Zhang M. Research on Rapid Detection Technology for β2-Agonists: Multi-Residue Fluorescence Immunochromatography Based on Dimeric Artificial Antigen. Foods. 2022;11:863. doi: 10.3390/foods11060863. - DOI - PMC - PubMed
    1. Zhang K., Ban M., Zhao Z., Zheng H., Wang X., Wang M., Fei C., Xue F. Cytotoxicity and genotoxicity of 1,4-bisdesoxyquinocetone, 3-methylquinoxaline-2-carboxylic acid (MQCA) in human hepatocytes. Res. Vet. Sci. 2012;93:1393–1401. doi: 10.1016/j.rvsc.2012.06.012. - DOI - PubMed
    1. Zhang Y., Zhou S., Chang X., Tao X. Development of a sensitive chemiluminescent immunoassay for the determination of 3-methyl-quinoxaline-2-carboxylic acid and quinoxaline-2-carboxylic acid in edible animal tissues using immunomagnetic beads capturing. Anal. Sci. 2019;35:1291–1293. doi: 10.2116/analsci.19C009. - DOI - PubMed
    1. Qiu M., Liu C., Tang Q., Zhang Y., Wang H., Zhai B., Xu K., Zhou Y., Qu L., Li Q., et al. Distribution and elimination of quinocetone and its major metabolites in Cherry Valley ducks. J. Vet. Pharmacol. Ther. 2019 online ahead of print . - PubMed