. 2024 Jun 13;13(12):1029.
doi: 10.3390/cells13121029.

CCT and Cullin1 Regulate the TORC1 Pathway to Promote Dendritic Arborization in Health and Disease

Affiliations

CCT and Cullin1 Regulate the TORC1 Pathway to Promote Dendritic Arborization in Health and Disease

Erin N Lottes et al. Cells. .

Abstract

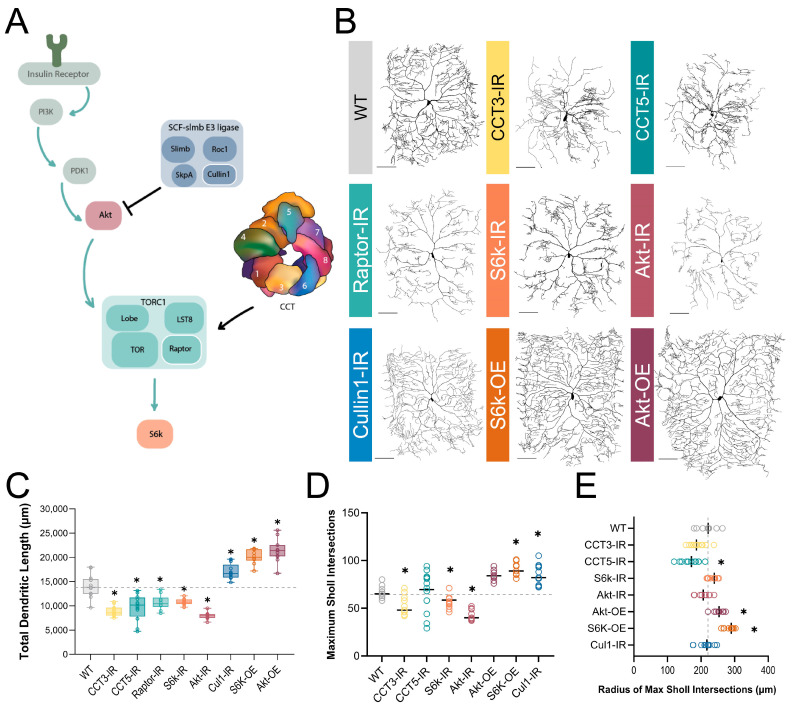
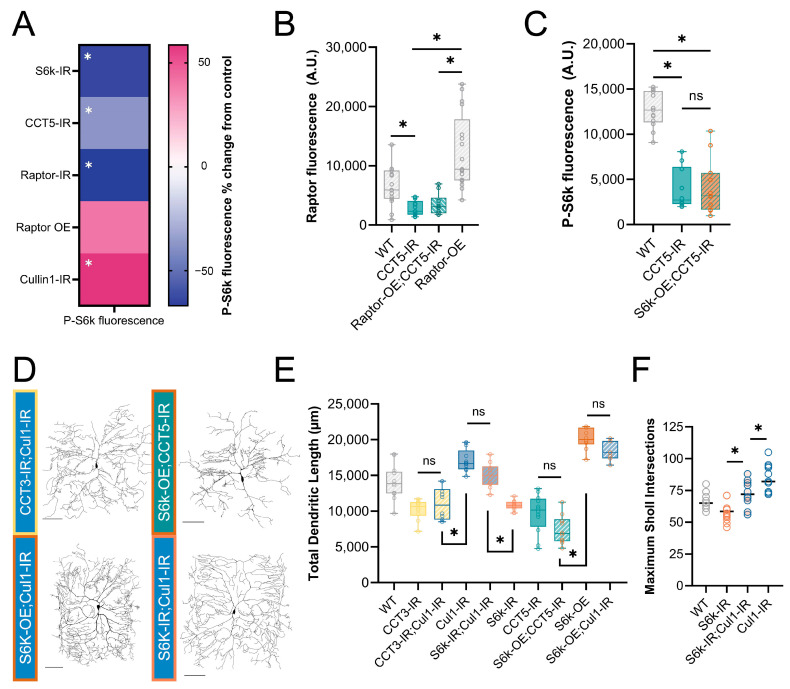
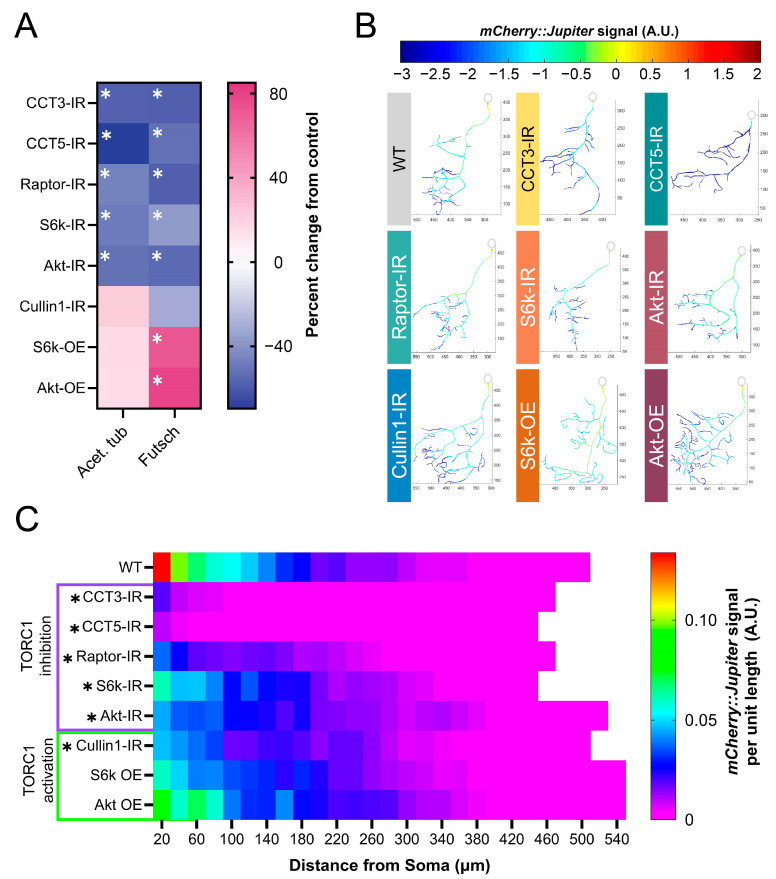
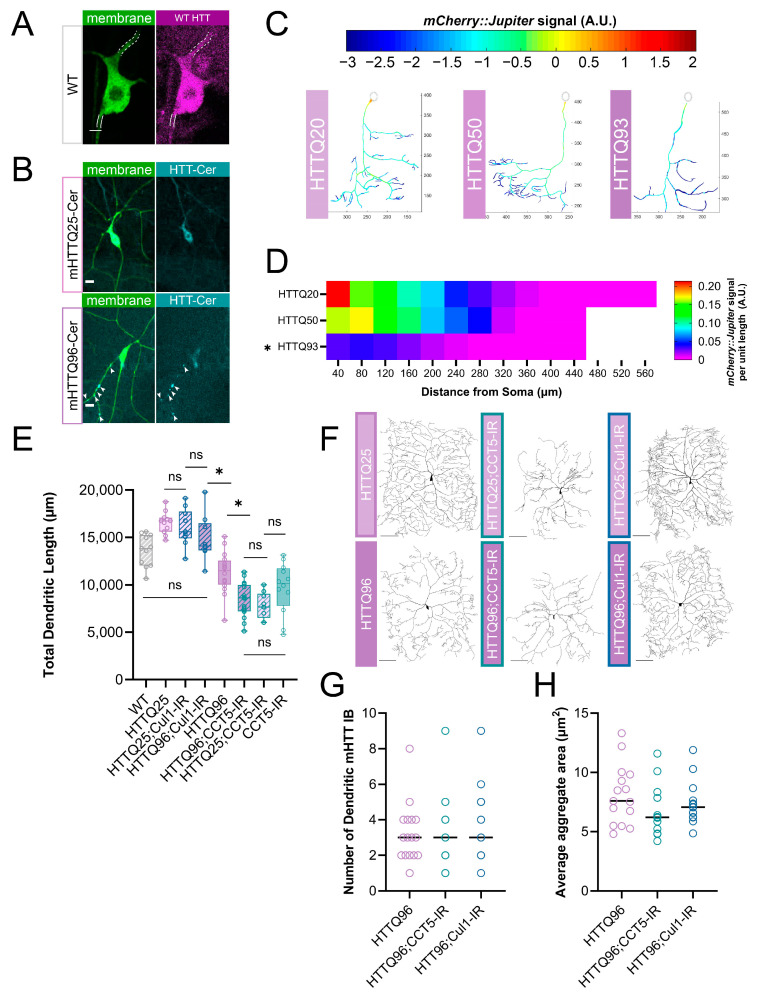
The development of cell-type-specific dendritic arbors is integral to the proper functioning of neurons within their circuit networks. In this study, we examine the regulatory relationship between the cytosolic chaperonin CCT, key insulin pathway genes, and an E3 ubiquitin ligase (Cullin1) in dendritic development. CCT loss of function (LOF) results in dendritic hypotrophy in Drosophila Class IV (CIV) multi-dendritic larval sensory neurons, and CCT has recently been shown to fold components of the TOR (Target of Rapamycin) complex 1 (TORC1) in vitro. Through targeted genetic manipulations, we confirm that an LOF of CCT and the TORC1 pathway reduces dendritic complexity, while overexpression of key TORC1 pathway genes increases the dendritic complexity in CIV neurons. Furthermore, both CCT and TORC1 LOF significantly reduce microtubule (MT) stability. CCT has been previously implicated in regulating proteinopathic aggregation, thus, we examine CIV dendritic development in disease conditions as well. The expression of mutant Huntingtin leads to dendritic hypotrophy in a repeat-length-dependent manner, which can be rescued by Cullin1 LOF. Together, our data suggest that Cullin1 and CCT influence dendritic arborization through the regulation of TORC1 in both health and disease.

Keywords: Drosophila; E3 ubiquitin ligase; Huntingtin; TORC1; chaperone; dendrite development.


Conflict of interest statement

The authors declare no competing financial interests.

Figures

Figure 1
Figure 1
CCT and the TORC1 pathway promote dendritic arborization. (A) Schematic diagram of regulatory relationships between the insulin pathway, SCF complex, CCT, and TORC1 pathway, with the insulin pathway indicated by teal arrows. TORC1 is negatively regulated by Cullin1 and positively regulated by CCT. The upstream insulin pathway in green is displayed for context, but was not examined in this study. Individual components of the SCF and TORC1 complexes examined in this study are outlined in white. (B) Representative images of CIV neurons for key CCT and TORC1 pathway manipulations, with RNAi-mediated knockdown indicated with -IR and UAS-mediated overexpression with -OE. Scale bars = 100 µm (C) Total dendritic length of CCT and TORC1 pathway manipulations shown in comparison to a WT control. (D) Number of Sholl maximum intersections. (E) Radius (in µm) of Sholl maximum intersection for each genotype. Radii that have shifted a significant difference from control are indicated with an asterisk. In all panels * = p < 0.05, see Supplementary Table S2 for detailed statistics.
Figure 2
Figure 2
CCT and Cullin1 regulate the TORC1 pathway in vivo. (A) Heat map showing the percent change in P-S6k fluorescence for each genetic manipulation as compared to its proper control. See Figure S2I for representative images. (B) Raptor fluorescence is significantly decreased in CCT5 LOF conditions and is not rescued by overexpression of Raptor. (C) P-S6k fluorescence levels are significantly decreased in CCT5 LOF and are not rescued by overexpression of S6k. (D) Representative images of combined TORC1 genetic manipulations. Scale bars = 100 µm. (E) Total dendritic length in microns for WT and combined TORC1 genetic manipulations. (F) Number of Sholl maximum intersections for S6k and Cullin1 individual and combined LOF. In all panels * = p < 0.05, ns = not significant; see Supplementary Table S2 for detailed statistics.
Figure 3
Figure 3
TORC1 pathway manipulations alter underlying stable MT signal. (A) Heat map showing percent change from control in acetylated α-tubulin and Futsch levels for each genetic manipulation. Each experimental condition was compared to WT control and appropriate statistical comparisons were performed (detailed in Supplementary Table S2). See Figure S3A,B for representative images. (B) Representative reconstructions of branches from WT and TORC1 genetic manipulations—normalized mCherry::Jupiter fluorescence is coded with the rainbow spectrum shown (A.U.). Scaled axes are provided in µm. (C) Heat map representing the average normalized, binned mCherry::Jupiter fluorescence along dendrites at increasing distances from the soma for each genotype. TORC1 inhibitions are marked in purple and TORC1 activations in green. Genotypes found to be significantly different along the dendritic arbor are marked with an asterisk. In all panels * = p < 0.05, see Supplementary Table S2 for detailed statistics.
Figure 4
Figure 4
Expression of mHTT leads to dendritic hypotrophy parallel to TORC1 pathway. (A) Representative image of WT HTT staining in CIV neuron—dendrite marked by dashed white lines, axon by solid lines. Scale bar = 3 µm. (B) Representative images of mHTT25-Cerulean and mHTT96-Cerulean shown with aggregate inclusion bodies marked by white arrows for mHTT96-Cerulean. Scale bar = 10 µm. (C) Representative reconstructions of branches from WT and TORC1 genetic manipulations—normalized mCherry::Jupiter fluorescence is coded with the rainbow spectrum shown (A.U.) (D) Heat map representing the average normalized, binned mCherry::Jupiter fluorescence along dendrites at increasing distances from the soma for overexpressions of mHTT 20, 50, and 93 repeats. Genotypes found to be significantly different along the dendritic arbor are marked with an asterisk. (E) TDL of Cullin1-IR and CCT5-IR in both mHTTQ25 and mHTTQ96 backgrounds displayed as percent change from WT control. CCT5-IR decreases both mHTTQ96 and mHTTQ25 neurons to far lower than WT, while Cullin1-IR rescues mHTT96 hypotrophy to WT levels. CCT5-IR alone is not significantly different from either mHTTQ25;CCT5-IR or mHTTQ96;CCT5-IR. All genotypes vary significantly from WT except for mHTTQ96;Cullin1-IR. (F) Representative images of CIV dendritic morphology in combined HTT and CCT5-IR or Cullin1-IR combinations. Scale bars = 100 µm. (G) Number of mHTT aggregate IBs does not change due to CCT5 or Cullin1 LOF. (H) mHTT aggregates in mHTTQ96Cerulean conditions do not change in average area due to CCT5 or Cullin1 LOF. In all panels * = p < 0.05, ns = not significant; see Supplementary Table S2 for detailed statistics.

Update of

References

    1. Dewey E.H. The No-Breakfast Plan and the Fasting-Cure. 4th ed. The Health Culture Co.; New York, NY, USA: 1900.
    1. Miles W.R., Root H.F. Psychologic Tests Applied to Diabetic Patients. Arch. Intern. Med. 1922;30:767–777. doi: 10.1001/archinte.1922.00110120086003. - DOI
    1. Moheet A., Mangia S., Seaquist E. Impact of diabetes on cognitive function and brain structure. Ann. N. Y. Acad. Sci. 2015;1353:60–71. doi: 10.1111/nyas.12807. - DOI - PMC - PubMed
    1. Raizada M.K. Localization of insulin-like immunoreactivity in the neurons from primary cultures of rat brain. Exp. Cell Res. 1983;143:351–357. doi: 10.1016/0014-4827(83)90061-7. - DOI - PubMed
    1. Weyhenmeyer J.A., Fellows R.E. Presence of immunoreactive insulin in neurons cultured from fetal rat brain. Cell. Mol. Neurobiol. 1983;3:81–86. doi: 10.1007/BF00735000. - DOI - PMC - PubMed

Publication types

MeSH terms

LinkOut - more resources