. 2024 May 30;46(6):5488-5510.
doi: 10.3390/cimb46060328.

Multiomics Analysis of the PHLDA Gene Family in Different Cancers and Their Clinical Prognostic Value

Affiliations

Multiomics Analysis of the PHLDA Gene Family in Different Cancers and Their Clinical Prognostic Value

Safia Iqbal et al. Curr Issues Mol Biol. .

Abstract

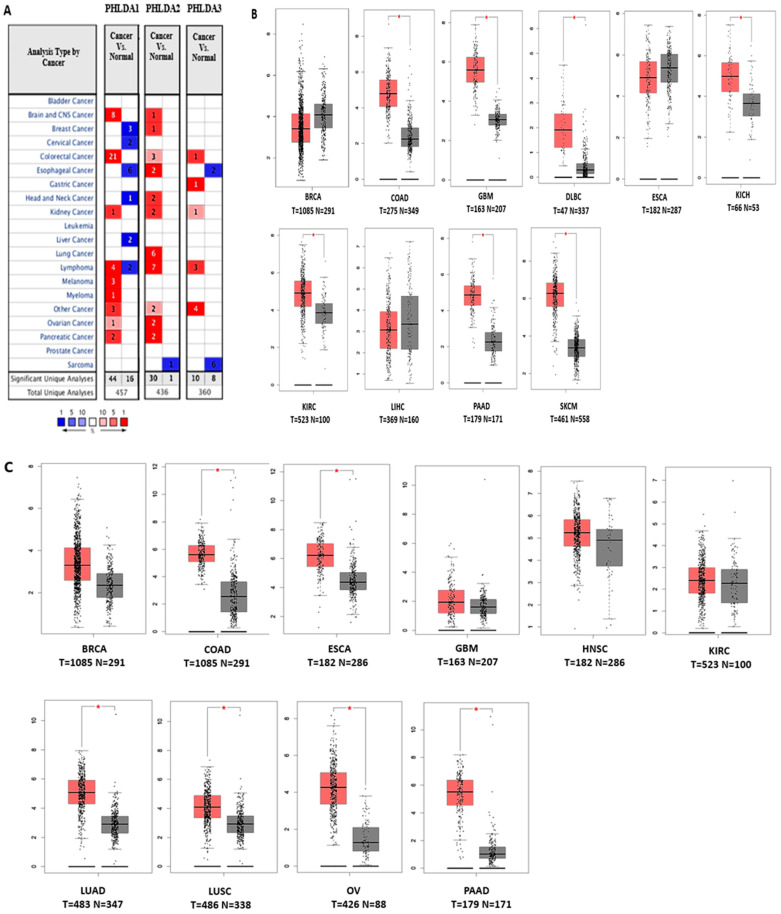
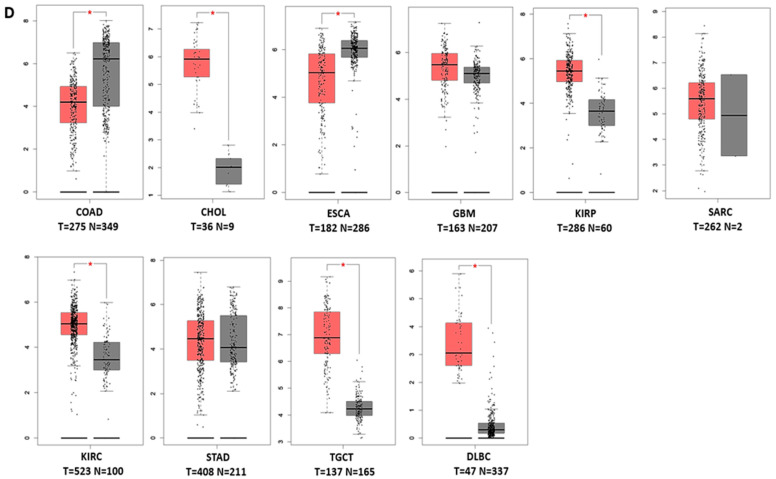
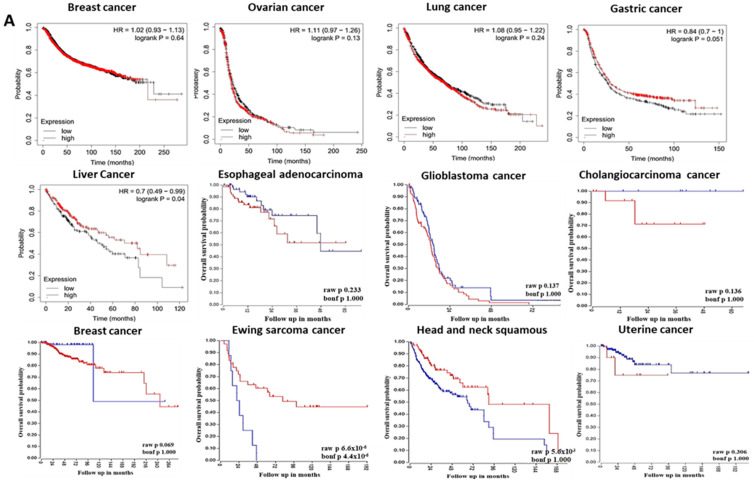
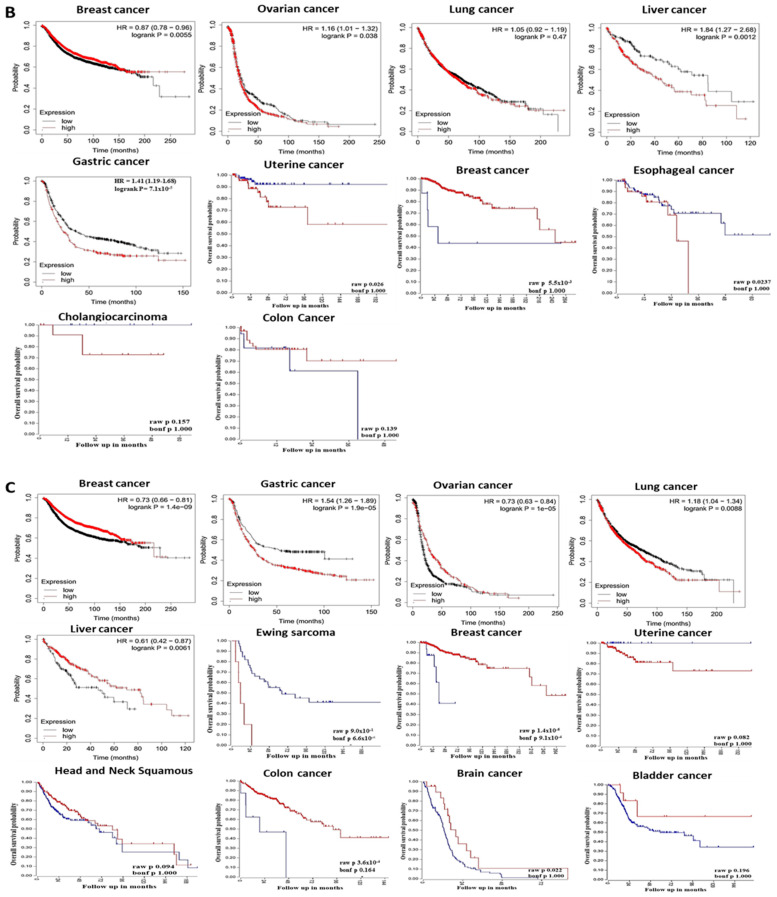
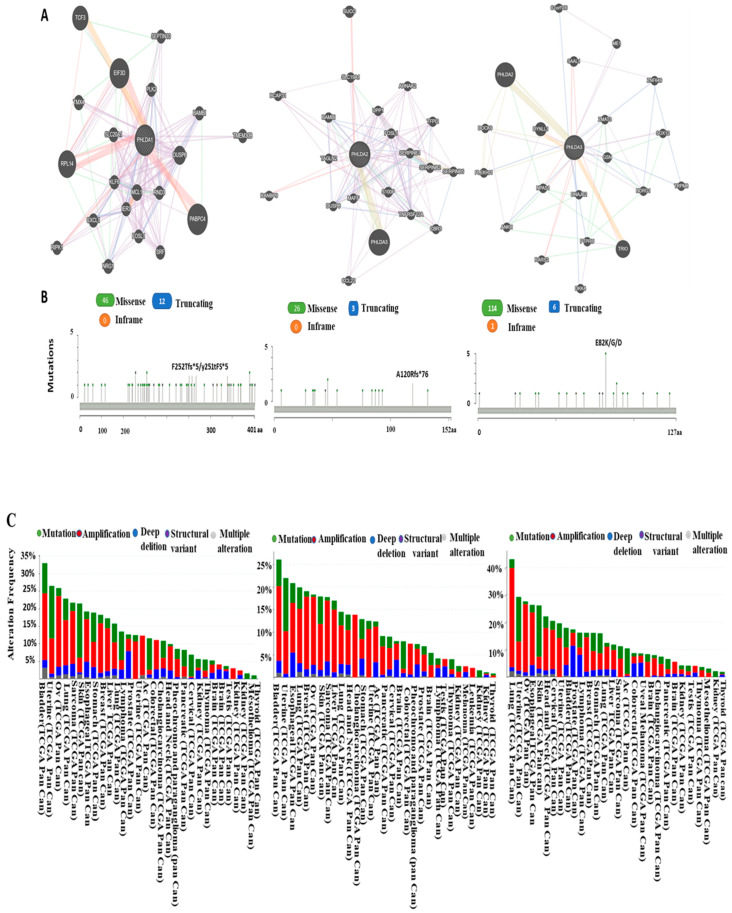
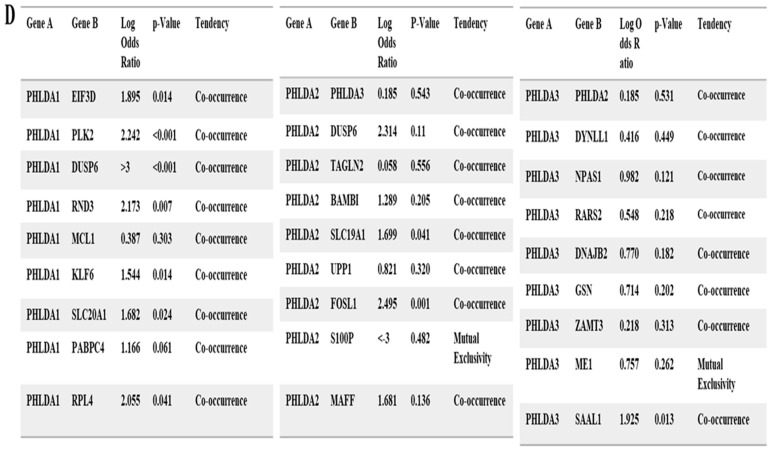
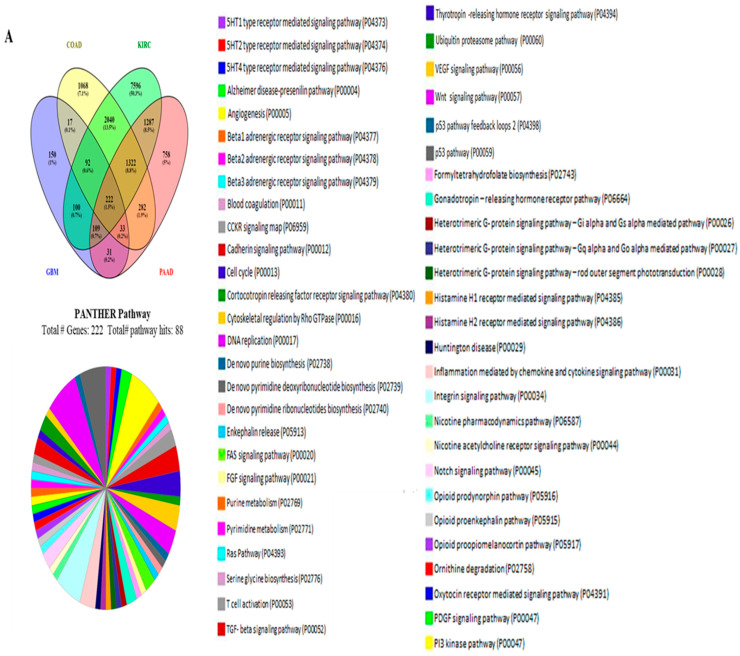
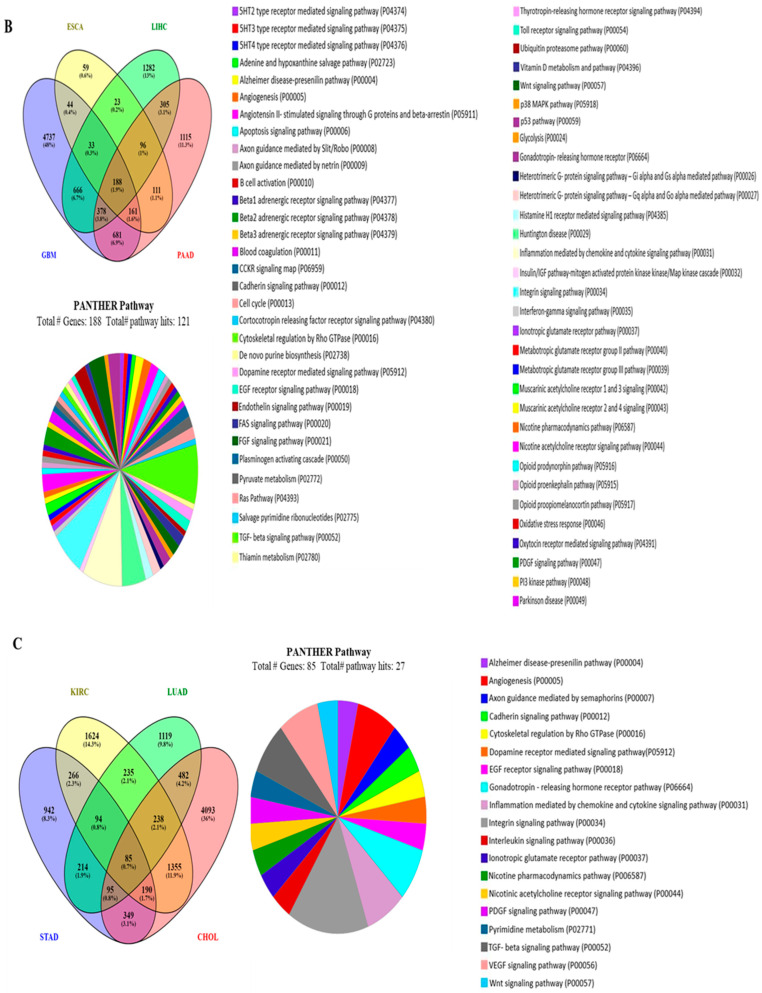
The PHLDA (pleckstrin homology-like domain family) gene family is popularly known as a potential biomarker for cancer identification, and members of the PHLDA family have become considered potentially viable targets for cancer treatments. The PHLDA gene family consists of PHLDA1, PHLDA2, and PHLDA3. The predictive significance of PHLDA genes in cancer remains unclear. To determine the role of pleckstrin as a prognostic biomarker in human cancers, we conducted a systematic multiomics investigation. Through various survival analyses, pleckstrin expression was evaluated, and their predictive significance in human tumors was discovered using a variety of online platforms. By analyzing the protein-protein interactions, we also chose a collection of well-known functional protein partners for pleckstrin. Investigations were also carried out on the relationship between pleckstrins and other cancers regarding mutations and copy number alterations. The cumulative impact of pleckstrin and their associated genes on various cancers, Gene Ontology (GO), and pathway analyses were used for their evaluation. Thus, the expression profiles of PHLDA family members and their prognosis in various cancers may be revealed by this study. During this multiomics analysis, we found that among the PHLDA family, PHLDA1 may be a therapeutic target for several cancers, including kidney, colon, and brain cancer, while PHLDA2 can be a therapeutic target for cancers of the colon, esophagus, and pancreas. Additionally, PHLDA3 may be a useful therapeutic target for ovarian, renal, and gastric cancer.

Keywords: PHLDA (pleckstrin homology-like domain family) gene; cancer biomarker; gene ontology (GO); gene pathway; multiomics.


Conflict of interest statement

The authors declare no conflicts of interest.

Figures

Figure 1
Figure 1
PHLDA1, PHLDA2, and PHLDA3 transcription levels in various types of cancer (Oncomine and TCGA databases). (A). The number of datasets where the overexpression (red) or underexpression (blue) of PHLDA1, PHLDA2, and PHLDA3 mRNA (cancer vs. corresponding normal tissue) is statistically significant (p ≤ 0.01) is shown in this graphic, which was created using Oncomine (available at https://www.oncomine.org/resource/login.html) (accessed on 3 April 2023). The threshold was established with the following parameters: 10% gene ranking, a fold change of 2, and a p-value of 1 × 10⁻⁵. The numbers in the boxes show the number of analyses that met these requirements (BD). (B) PHLDA1 expression in The Cancer Genome Atlas (TCGA) database. Using TCGA data from GEPIA, box plots illustrating PHLDA1 mRNA expression in various tumor (T) and normal (N) tissues are shown. The following parameters were used when designing the threshold: p-value is 0.01, and the fold change is 2. (Abbreviations: COAD, colon adenocarcinoma; GBM, brain glioblastoma; LUAD, lung adenocarcinoma; DLBCL, diffuse large B cell lymphoma; KICH, kidney chromophobe; KIRC, kidney renal clear cell carcinoma; SKCM, skin cutaneous melanoma; PAAD, pancreatic adenocarcinoma; LIHC, liver hepatocellular carcinoma; BRCA, invasive breast carcinoma; ESCA, esophageal carcinoma) (C). PHLDA2 gene expression in The Cancer Genome Atlas (TCGA) database. Box plots using data from the TCGA database via the GEPIA website demonstrating the expression of PHLDA2 mRNA in various tumor (T) and normal (N) tissues. The following parameters were used to design the threshold: p-value = 0.01, fold change = 2. (Abbreviations: BRCA, invasive breast carcinoma; COAD, colon adenocarcinoma; ESCA, esophageal carcinoma; GBM, glioblastoma multiforme; HNSC, head and neck squamous cell carcinoma; KIRC, kidney renal clear cell carcinoma; LUAD, lung adenocarcinoma; LUSC, lung squamous cell carcinoma; OV, ovarian cancer; PAAD, pancreatic adenocarcinoma) (D). Expression of the PHLDA3 gene in The Cancer Genome Atlas (TCGA) database. Box plots displaying the expression of PHLDA3 mRNA in various tumor (T) and normal (N) tissues were created using information from the TCGA database via the GEPIA website. The threshold was created using the parameters p-value = 0.01 and fold change = 2. (Abbreviations: CHOL, cholangiocarcinoma; GBM, glioblastoma multiforme; KIRP, kidney renal papillary cell carcinoma; KIRC, kidney renal clear cell carcinoma; TGCT, Tenosynovial giant cell tumour; COAD, colon adenocarcinoma; DLBCL, diffuse large B cell lymphoma; ESCA, esophageal carcinoma; SARC, sarcoma; STAD, stomach adenocarcinoma).
Figure 1
Figure 1
PHLDA1, PHLDA2, and PHLDA3 transcription levels in various types of cancer (Oncomine and TCGA databases). (A). The number of datasets where the overexpression (red) or underexpression (blue) of PHLDA1, PHLDA2, and PHLDA3 mRNA (cancer vs. corresponding normal tissue) is statistically significant (p ≤ 0.01) is shown in this graphic, which was created using Oncomine (available at https://www.oncomine.org/resource/login.html) (accessed on 3 April 2023). The threshold was established with the following parameters: 10% gene ranking, a fold change of 2, and a p-value of 1 × 10⁻⁵. The numbers in the boxes show the number of analyses that met these requirements (BD). (B) PHLDA1 expression in The Cancer Genome Atlas (TCGA) database. Using TCGA data from GEPIA, box plots illustrating PHLDA1 mRNA expression in various tumor (T) and normal (N) tissues are shown. The following parameters were used when designing the threshold: p-value is 0.01, and the fold change is 2. (Abbreviations: COAD, colon adenocarcinoma; GBM, brain glioblastoma; LUAD, lung adenocarcinoma; DLBCL, diffuse large B cell lymphoma; KICH, kidney chromophobe; KIRC, kidney renal clear cell carcinoma; SKCM, skin cutaneous melanoma; PAAD, pancreatic adenocarcinoma; LIHC, liver hepatocellular carcinoma; BRCA, invasive breast carcinoma; ESCA, esophageal carcinoma) (C). PHLDA2 gene expression in The Cancer Genome Atlas (TCGA) database. Box plots using data from the TCGA database via the GEPIA website demonstrating the expression of PHLDA2 mRNA in various tumor (T) and normal (N) tissues. The following parameters were used to design the threshold: p-value = 0.01, fold change = 2. (Abbreviations: BRCA, invasive breast carcinoma; COAD, colon adenocarcinoma; ESCA, esophageal carcinoma; GBM, glioblastoma multiforme; HNSC, head and neck squamous cell carcinoma; KIRC, kidney renal clear cell carcinoma; LUAD, lung adenocarcinoma; LUSC, lung squamous cell carcinoma; OV, ovarian cancer; PAAD, pancreatic adenocarcinoma) (D). Expression of the PHLDA3 gene in The Cancer Genome Atlas (TCGA) database. Box plots displaying the expression of PHLDA3 mRNA in various tumor (T) and normal (N) tissues were created using information from the TCGA database via the GEPIA website. The threshold was created using the parameters p-value = 0.01 and fold change = 2. (Abbreviations: CHOL, cholangiocarcinoma; GBM, glioblastoma multiforme; KIRP, kidney renal papillary cell carcinoma; KIRC, kidney renal clear cell carcinoma; TGCT, Tenosynovial giant cell tumour; COAD, colon adenocarcinoma; DLBCL, diffuse large B cell lymphoma; ESCA, esophageal carcinoma; SARC, sarcoma; STAD, stomach adenocarcinoma).
Figure 2
Figure 2
Correlation of PHLDA1, PHLDA2, and PHLDA3 expression with the prognosis of various cancers. (A). Correlation of PHLDA1 expression with the prognosis of various cancers (R2: Kaplan-Meier Scanner; Kaplan-Meier Plotter). Patients with high (red) and low (blue) PHLDA1 expression were compared on survival curves using breast, ovarian, lung, gastric, and liver data from Kaplan-Meier Plotter; esophageal cancer, brain, cholangiocarcinoma, breast, Ewing sarcoma, head, and neck squamous, uterine data from R2: Kaplan-Meier Scanner. Cox p-value threshold < 0.05. For PHLDA1, gene expression was not statistically significant for breast, ovarian, lung, esophageal, glioblastoma, cholangiocarcinoma, head and neck squamous, and uterine cancer (B). Correlation of PHLDA2 expression with the prognosis of various cancers (R2: Kaplan–Meier Scanner; Kaplan-Meier Plotter). Survival curves comparing patients with high (red) and low (blue) PHLDA2 expression were plotted using breast, ovarian, lung, liver, and gastric data from Kaplan-Meier Plotter; uterine cancer, breast, esophageal, cholangiocarcinoma, and colon cancer data from R2: Kaplan–Meier Scanner. Cox p-value threshold < 0.05. For PHLDA2, gene expression was not statistically significant for cholangiocarcinoma and colon cancer (C). Correlation of PHLDA3 expression with the prognosis of various cancers (R2: Kaplan-Meier Scanner, Kaplan-Meier Plotter). Survival curves comparing patients with high (red) and low (blue) PHLDA3 expression were plotted using breast, gastric, ovarian, lung, and liver data from Kaplan-Meier Plotter; Ewing sarcoma cancer, breast, uterine, head, and neck squamous, colon, brain cancer, and bladder data from R2: Kaplan-Meier Scanner. p < 0.05 represents statistical significance. For PHLDA3, gene expression was not statistically significant for lung, liver, and head and neck squamous cancer.
Figure 2
Figure 2
Correlation of PHLDA1, PHLDA2, and PHLDA3 expression with the prognosis of various cancers. (A). Correlation of PHLDA1 expression with the prognosis of various cancers (R2: Kaplan-Meier Scanner; Kaplan-Meier Plotter). Patients with high (red) and low (blue) PHLDA1 expression were compared on survival curves using breast, ovarian, lung, gastric, and liver data from Kaplan-Meier Plotter; esophageal cancer, brain, cholangiocarcinoma, breast, Ewing sarcoma, head, and neck squamous, uterine data from R2: Kaplan-Meier Scanner. Cox p-value threshold < 0.05. For PHLDA1, gene expression was not statistically significant for breast, ovarian, lung, esophageal, glioblastoma, cholangiocarcinoma, head and neck squamous, and uterine cancer (B). Correlation of PHLDA2 expression with the prognosis of various cancers (R2: Kaplan–Meier Scanner; Kaplan-Meier Plotter). Survival curves comparing patients with high (red) and low (blue) PHLDA2 expression were plotted using breast, ovarian, lung, liver, and gastric data from Kaplan-Meier Plotter; uterine cancer, breast, esophageal, cholangiocarcinoma, and colon cancer data from R2: Kaplan–Meier Scanner. Cox p-value threshold < 0.05. For PHLDA2, gene expression was not statistically significant for cholangiocarcinoma and colon cancer (C). Correlation of PHLDA3 expression with the prognosis of various cancers (R2: Kaplan-Meier Scanner, Kaplan-Meier Plotter). Survival curves comparing patients with high (red) and low (blue) PHLDA3 expression were plotted using breast, gastric, ovarian, lung, and liver data from Kaplan-Meier Plotter; Ewing sarcoma cancer, breast, uterine, head, and neck squamous, colon, brain cancer, and bladder data from R2: Kaplan-Meier Scanner. p < 0.05 represents statistical significance. For PHLDA3, gene expression was not statistically significant for lung, liver, and head and neck squamous cancer.
Figure 3
Figure 3
Identification of known and anticipated structural proteins necessary for PHLDA1, PHLDA2, and PHLDA3 function (GeneMANIA), as well as the frequency of mutations and copy number changes (CNAs) in different cancer types (cBioPortal web). (A) GeneMANIA displays interacting nodes as circles. After considering co-expression, colocalization, genetic relationships, pathways, physical interactions, and predicted shared protein domains, putative functional partners of PHLDA1, PHLDA2, and PHLDA3 are presented. (B) In PHLDA1, 58 mutation sites were identified and were located between amino acids 0 and 401. For PHLDA1, the mutation mainly occurred in colorectal cancer and bladder cancer and existed in a hotspot in the PHLDA domain. For PHLDA2, 29 mutation sites were detected and located between amino acids 0 and 152 of PHLDA2. For Phlda3, 120 mutations were found overall, spanning out between amino acids 0 and 127 of PHLDA3. (C). The cBioPortal was used to calculate the frequency of alterations in a ten-gene signature (PHLDA1, EIF3D, PLK2, DUSP6, RND3, MCL1, KLF6, SLC20A1, PABPC4, and RPL14). The alterations included mutations (green), amplifications (red), deep deletions (blue), structural variants (purple), or multiple alterations (grey). With the use of cBioPortal, the alteration frequency of a ten-gene signature (PHLDA2, PHLDA3, DUSP6, TAGLN2, BAMBI, SLC19A1, UPP1, FOSL1, S100P, and MAFF) was determined. The alteration frequency included mutations (green), structural variants (purple), amplifications (red), deep deletions (blue), or multiple alterations (grey). cBioPortal was used to evaluate the alteration frequency of a ten-gene signature (PHLDA3, PHLDA2, DYNLL1, NPAS1, RARS2, DNAJB2, GSN, ZMAT3, ME1, and SAAL1). The alteration frequency included mutations (green), structural variants (purple), amplifications (red), deep deletions (blue), or multiple alterations (grey). (D). The co-occurrence of PHLDA1, PHLDA2, and PHLDA3 gene signature alterations and relationships between their respective gene copy number and mRNA expression were discovered via mutual exclusivity panel analysis. The cBioPortal for Cancer Genomics was used to examine the association between PHLDA1, PHLDA2, and PHLDA3 CNAs and mRNA levels.
Figure 3
Figure 3
Identification of known and anticipated structural proteins necessary for PHLDA1, PHLDA2, and PHLDA3 function (GeneMANIA), as well as the frequency of mutations and copy number changes (CNAs) in different cancer types (cBioPortal web). (A) GeneMANIA displays interacting nodes as circles. After considering co-expression, colocalization, genetic relationships, pathways, physical interactions, and predicted shared protein domains, putative functional partners of PHLDA1, PHLDA2, and PHLDA3 are presented. (B) In PHLDA1, 58 mutation sites were identified and were located between amino acids 0 and 401. For PHLDA1, the mutation mainly occurred in colorectal cancer and bladder cancer and existed in a hotspot in the PHLDA domain. For PHLDA2, 29 mutation sites were detected and located between amino acids 0 and 152 of PHLDA2. For Phlda3, 120 mutations were found overall, spanning out between amino acids 0 and 127 of PHLDA3. (C). The cBioPortal was used to calculate the frequency of alterations in a ten-gene signature (PHLDA1, EIF3D, PLK2, DUSP6, RND3, MCL1, KLF6, SLC20A1, PABPC4, and RPL14). The alterations included mutations (green), amplifications (red), deep deletions (blue), structural variants (purple), or multiple alterations (grey). With the use of cBioPortal, the alteration frequency of a ten-gene signature (PHLDA2, PHLDA3, DUSP6, TAGLN2, BAMBI, SLC19A1, UPP1, FOSL1, S100P, and MAFF) was determined. The alteration frequency included mutations (green), structural variants (purple), amplifications (red), deep deletions (blue), or multiple alterations (grey). cBioPortal was used to evaluate the alteration frequency of a ten-gene signature (PHLDA3, PHLDA2, DYNLL1, NPAS1, RARS2, DNAJB2, GSN, ZMAT3, ME1, and SAAL1). The alteration frequency included mutations (green), structural variants (purple), amplifications (red), deep deletions (blue), or multiple alterations (grey). (D). The co-occurrence of PHLDA1, PHLDA2, and PHLDA3 gene signature alterations and relationships between their respective gene copy number and mRNA expression were discovered via mutual exclusivity panel analysis. The cBioPortal for Cancer Genomics was used to examine the association between PHLDA1, PHLDA2, and PHLDA3 CNAs and mRNA levels.
Figure 4
Figure 4
Exploration of the predicted pathways for the genes that were positively correlated with PHLDA1, PHLDA2, and PHLDA3 using PANTHER. (A). Venn diagram of the coinciding genes in GBM, COAD, KIRC, and PAAD that are positively correlated with PHLDA1, and PANTHER pathway analysis followed by classification based on the pathways (B). ESCA, GBM, LIHC, and PAAD are instances of coincident genes in the Venn diagram of genes that are positively correlated with PHLDA2 and using PANTHER, pathway analysis, and classifications based on those pathways (C). Venn diagram of the coinciding genes in STAD, KICH, LUAD, and CHOL that were positively linked with PHLDA3. PANTHER pathway analysis followed by classification based on the pathways.
Figure 4
Figure 4
Exploration of the predicted pathways for the genes that were positively correlated with PHLDA1, PHLDA2, and PHLDA3 using PANTHER. (A). Venn diagram of the coinciding genes in GBM, COAD, KIRC, and PAAD that are positively correlated with PHLDA1, and PANTHER pathway analysis followed by classification based on the pathways (B). ESCA, GBM, LIHC, and PAAD are instances of coincident genes in the Venn diagram of genes that are positively correlated with PHLDA2 and using PANTHER, pathway analysis, and classifications based on those pathways (C). Venn diagram of the coinciding genes in STAD, KICH, LUAD, and CHOL that were positively linked with PHLDA3. PANTHER pathway analysis followed by classification based on the pathways.

Similar articles

References

    1. Brader G., Compant S., Mitter B., Trognitz F., Sessitsch A. Metabolic potential of endophytic bacteria. Curr. Opin. Biotechnol. 2014;27:30–37. doi: 10.1016/j.copbio.2013.09.012. - DOI - PMC - PubMed
    1. Schmidt D.R., Patel R., Kirsch D.G., Lewis C.A., Vander Heiden M.G., Locasale J.W. Metabolomics in cancer research and emerging applications in clinical oncology. CA Cancer J. Clin. 2021;71:333–358. doi: 10.3322/caac.21670. - DOI - PMC - PubMed
    1. DeBerardinis R.J., Chandel N.S. Fundamentals of cancer metabolism. Sci. Adv. 2016;2:e1600200. doi: 10.1126/sciadv.1600200. - DOI - PMC - PubMed
    1. Baldavira C.M., Machado-Rugolo J., Prieto T.G., Bastos D.R., Balancin M., Ab’Saber A.M., Yaegashi L.B., Souza P.C., Farhat C., Takagaki T.Y., et al. The expression patterns and prognostic significance of pleckstrin homology-like domain family A (PHLDA) in lung cancer and malignant mesothelioma. J. Thorac. Dis. 2021;13:689–707. doi: 10.21037/jtd-20-2909. - DOI - PMC - PubMed
    1. Duan H., Liu Y., Gao Z., Huang W. Recent advances in drug delivery systems for targeting cancer stem cells. Acta Pharm. Sin. B. 2021;11:55–70. doi: 10.1016/j.apsb.2020.09.016. - DOI - PMC - PubMed

LinkOut - more resources