. 2024 May 22;15(6):378.
doi: 10.3390/insects15060378.

Seasonal Dynamics and Damage of Halyomorpha halys in Italian Vineyards

Affiliations

Seasonal Dynamics and Damage of Halyomorpha halys in Italian Vineyards

Davide Scaccini et al. Insects. .

Abstract

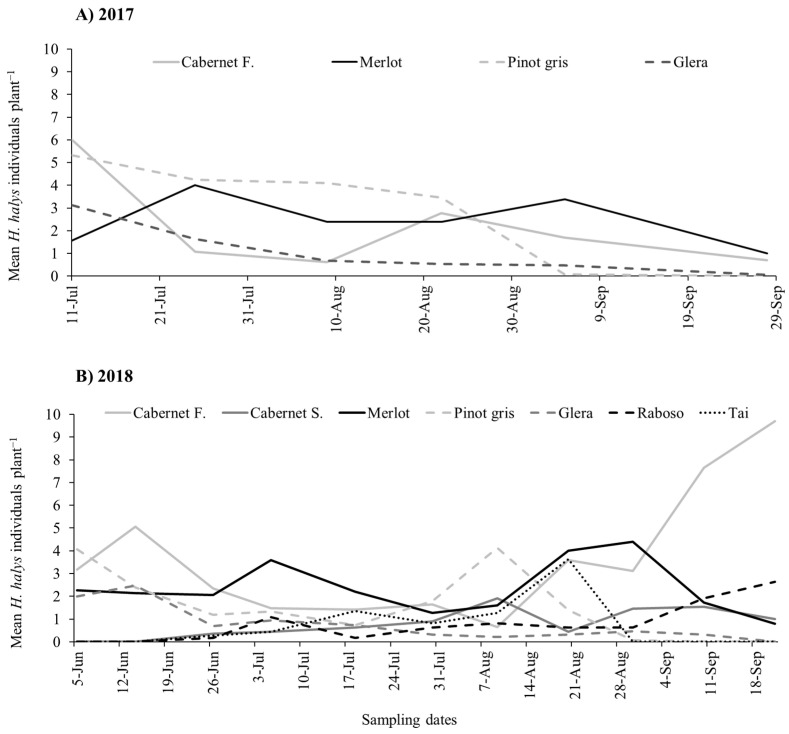
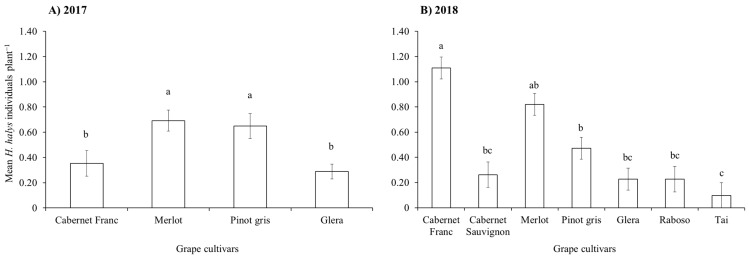
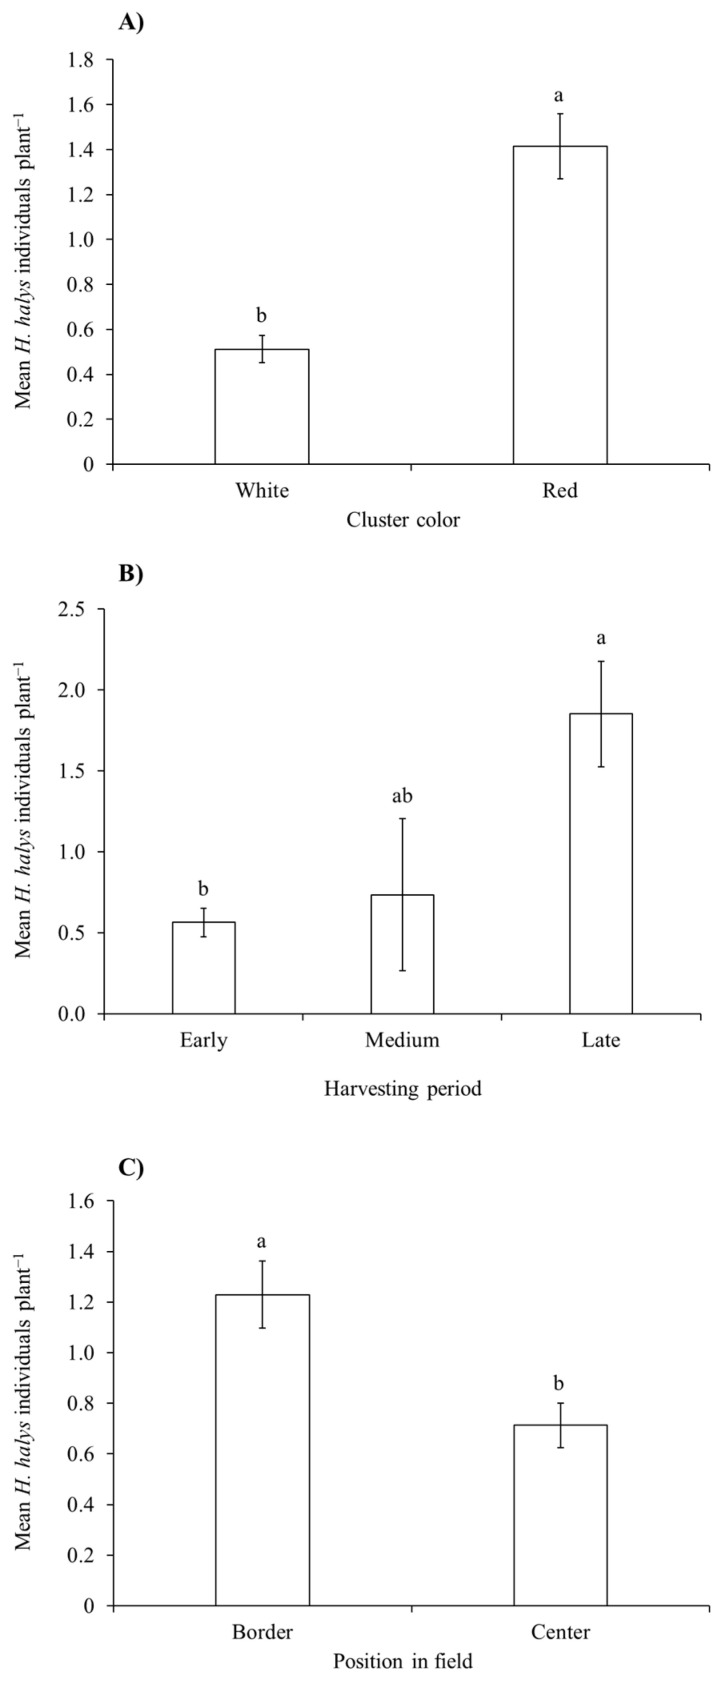
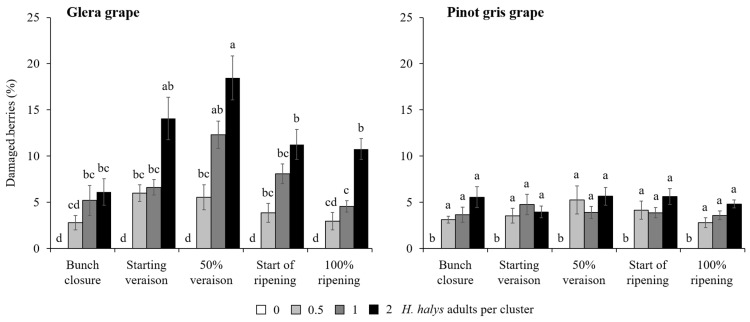
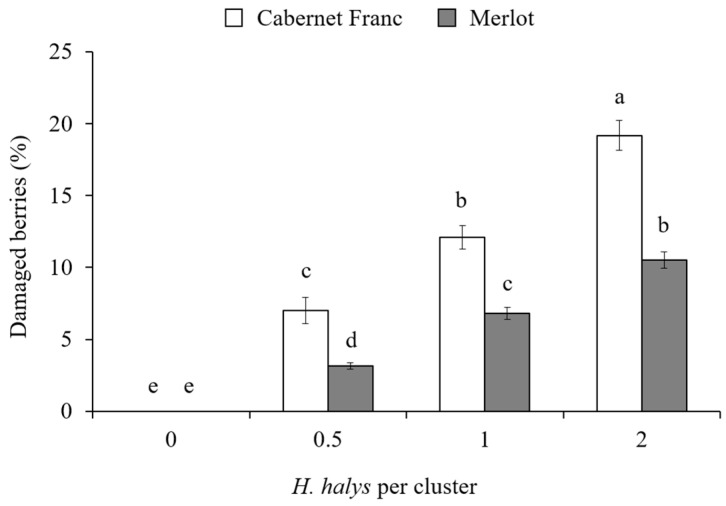
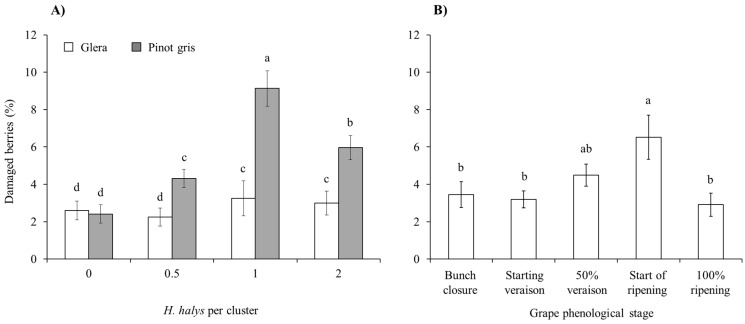
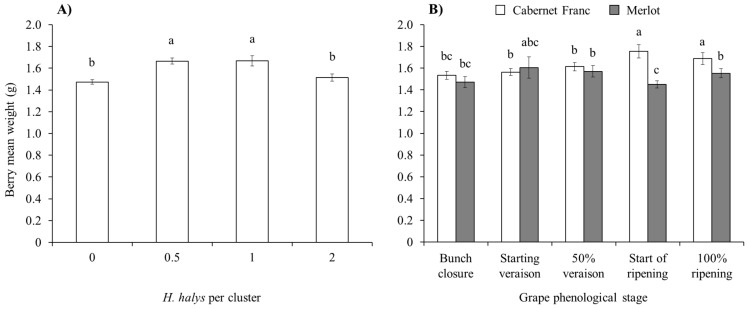
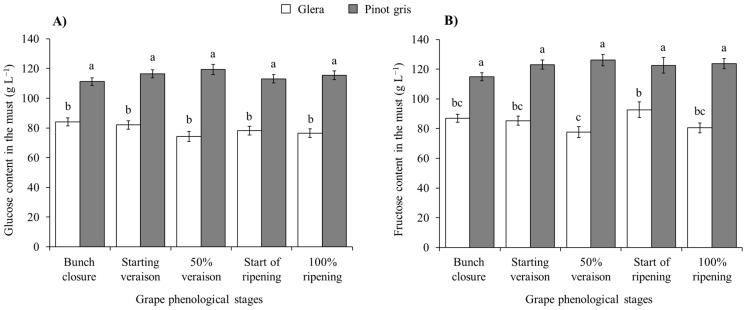
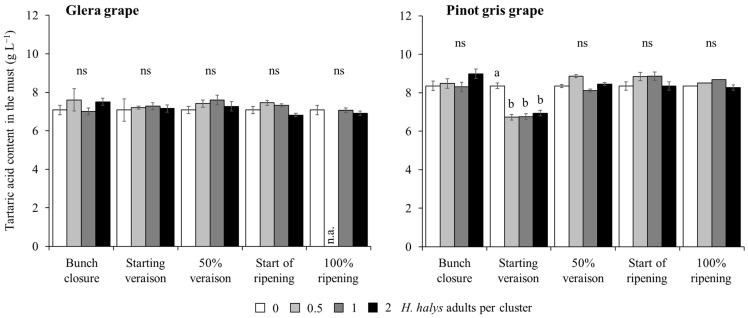
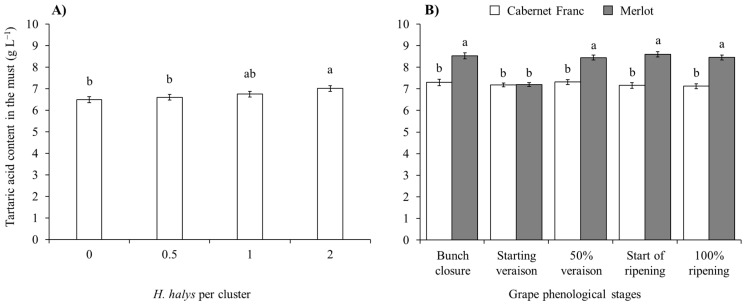
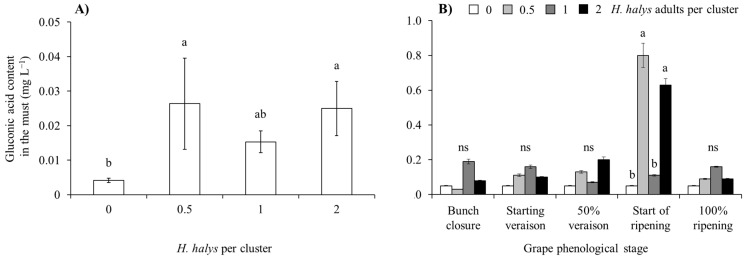
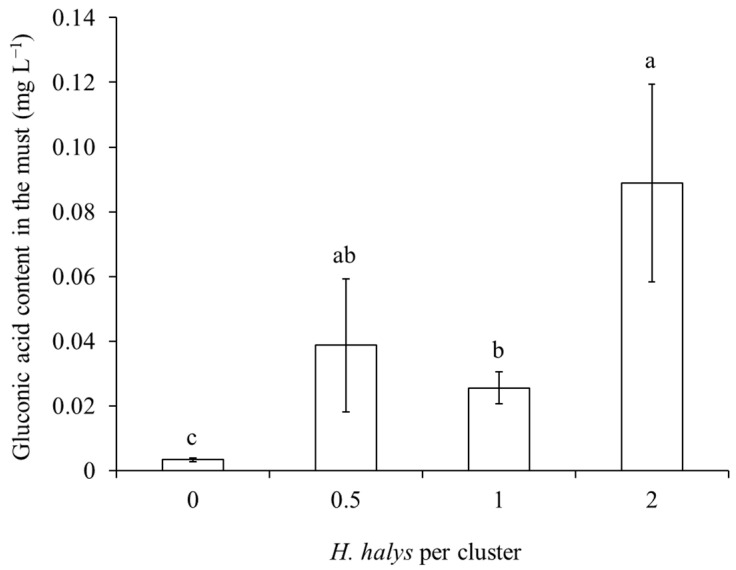
The brown marmorated stink bug, Halyomorpha halys (Stål) (Hemiptera: Pentatomidae), is an invasive polyphagous pest often observed in vineyards. In Europe, a gap needs to be filled in the knowledge on H. halys seasonal dynamics and damage on grapes. With this study, we described the seasonal dynamics of H. halys and its distribution in multi-cultivar vineyards, and we evaluated the damage on grape clusters induced by different pest densities. In vineyards, the seasonal occurrence of H. halys varied across time and grape cultivars, and the pest was more abundant on Cabernet Franc, Merlot and, to a lesser extent, Pinot gris. Moreover, higher densities of H. halys were found on red berry cultivars than on white ones, and on cultivars ripening late in the season. An edge effect was also detected in pest distribution within vineyards, with more stink bugs observed in the borders. In the study on pest infestation density, H. halys caused damage on berries, showing differences in susceptibility among different cultivars and with regard to the time of infestation (i.e., plant phenological stages). Halyomorpha halys infestation induced an increase in Botrytis cinerea and sour rot incidence, which probably represents the main issue related to the impact of brown marmorated stink bug on grapevine.

Keywords: Botrytis cinerea; IPM; Italy; Vitis vinifera; brown marmorated stink bug; cultivars; grapevine; grey mold; pathogen; sour rot.


Conflict of interest statement

The authors declare no conflicts of interest.

Figures

Figure 1
Figure 1
Halyomorpha halys seasonal dynamics on different grape cultivars observed from beat sampling in 2017 (A) and 2018 (B).
Figure 2
Figure 2
Halyomorpha halys number (mean ± std. err.) on different grape cultivars observed from beat sampling in 2017 (A) and 2018 (B). Back-transformed data from least-square means were used in the figure. Different letters indicate significant differences in the Tukey’s test on least-square means (α = 0.05).
Figure 3
Figure 3
Halyomorpha halys abundance (mean no. ± std. err.) in vineyards on white and red grape cultivars (A), on cultivars with different harvesting period (B), and in different positions (i.e., border vs. center) within vineyard rows (C) as observed in 2018. Back-transformed data from least-square means were used in the figure. Different letters indicate significant differences in the Tukey’s test on least-square means (α = 0.05).
Figure 4
Figure 4
Percentage (mean ± std. err.) of berries of white cultivars showing signs of feeding damage observed in the cage experiment in different treatments defined by Halyomorpha halys infestation density and phenological stage of infestation. Different letters indicate significant differences according to Tukey–Kramer’s test (α = 0.05).
Figure 5
Figure 5
Percentage (mean ± std. err.) of damaged berries by Halyomorpha halys per cluster of the red grapes Cabernet Franc and Merlot with different H. halys infestation densities. Different letters indicate significant differences according to Tukey–Kramer’s test (α = 0.05).
Figure 6
Figure 6
Percentage (mean ± std. err.) of berries with signs of Botrytis cinerea and sour rot in the white grapes Glera and Pinot gris with different Halyomorpha halys infestation densities (A), and for different plant phenological stages (B). Different letters indicate significant differences according to Tukey–Kramer’s test (α = 0.05).
Figure 7
Figure 7
Berry weight (mean ± std. err.) in red grapes for different Halyomorpha halys densities (A), and considering the phenological stage of Cabernet Franc and Merlot (B). Different letters indicate significant differences according to Tukey–Kramer’s test (α = 0.05).
Figure 8
Figure 8
Glucose (A) and fructose (B) content (mean ± std. err.) in must of white grapes for different Halyomorpha halys densities. Different letters indicate significant differences according to Tukey–Kramer’s test (α = 0.05).
Figure 9
Figure 9
Tartaric acid content (mean ± std. err.) in must of white grapes, Glera and Pinot gris, according to the plant phenological stage and density of Halyomorpha halys infestation. Different letters indicate significant differences according to Tukey–Kramer’s test (α = 0.05). n.a. = not available data.
Figure 10
Figure 10
Tartaric acid content (mean ± std. err.) in must of red grapes for different Halyomorpha halys densities (A), and depending on the phenological stage of Cabernet Franc and Merlot grapes (B). Different letters indicate significant differences according to Tukey–Kramer’s test (α = 0.05).
Figure 11
Figure 11
Gluconic acid content (mean ± std. err.) in must of white grapes for different Halyomorpha halys densities (A), and in different grape phenological stages and H. halys infestation densities (B). Different letters indicate significant differences according to Tukey–Kramer’s test (α = 0.05).
Figure 12
Figure 12
Gluconic acid content (mean ± std. err.) in must of red grapes for different Halyomorpha halys densities. Different letters indicate significant differences according to Tukey–Kramer’s test (α = 0.05).
Figure 13
Figure 13
Halyomorpha halys number (mean ± std. err.) on Pinot gris grapes collected with beat sampling in 2019, by insecticide/fungicide treatment. Different letters indicate significant differences according to Tukey’s test on least-square means (α = 0.05), by sampling event.
Figure 14
Figure 14
Percentage (mean ± std. err.) of Pinot gris berries with signs of Botrytis cinerea and sour rot in grapes observed at harvest in different treatments of fungicide and insecticide applications. Different letters indicate significant differences according to Tukey–Kramer’s test (α = 0.05).

References

    1. OIV State of the World Wine and Wine Sector in 2022. [(accessed on 11 January 2024)]. Available online: https://www.oiv.int/sites/default/files/documents/OIV_State_of_the_world....
    1. Fregoni M. Viticoltura di Qualità. Edizioni L’Informatore Agrario S.r.l.; Piacenza, Italy: 1998.
    1. Raimondi S. Vite e vino nel mondo. In: Angelini R., editor. La Vite e il Vino. Coltura e Cultura, Bayer CropScience S.r.l. and ART Servizi Editoriali S.p.A.; Milan and Bologna, Italy: 2007. pp. 548–579.
    1. IWC Winegrape Production by Region. [(accessed on 11 January 2024)]. Available online: https://italianwinecentral.com/grape-production-by-region/
    1. Leskey T.C., Nielsen A.L. Impact of The Invasive Brown Marmorated Stink Bug in North America and Europe: History, Biology, Ecology, and Management. Annu. Rev. Entomol. 2018;63:599–618. doi: 10.1146/annurev-ento-020117-043226. - DOI - PubMed

LinkOut - more resources