. 2024 May 30;9(6):328.
doi: 10.3390/biomimetics9060328.

Autocatalysis, Autopoiesis, and the Opportunity Cost of Individuality

Affiliations

Autocatalysis, Autopoiesis, and the Opportunity Cost of Individuality

Nemanja Kliska et al. Biomimetics (Basel). .

Abstract

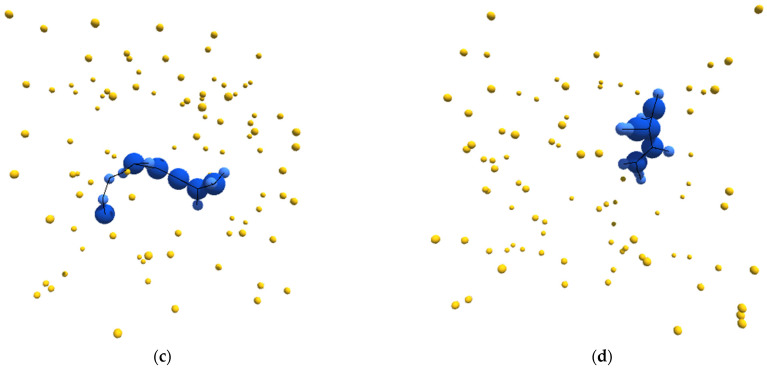
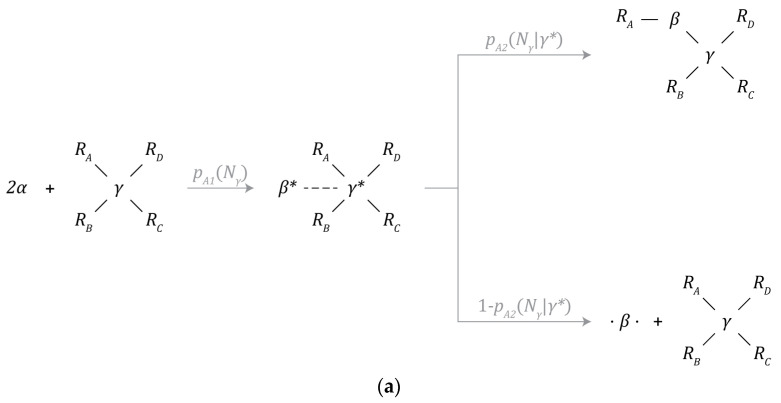
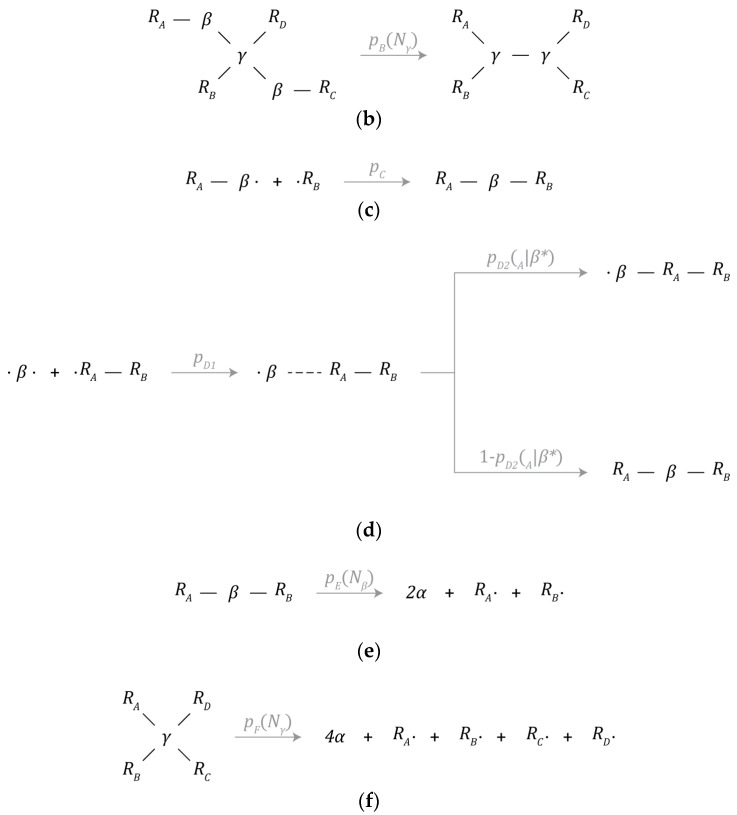
Ever since Varela and Maturana proposed the concept of autopoiesis as the minimal requirement for life, there has been a focus on cellular systems that erect topological boundaries to separate themselves from their surrounding environment. Here, we reconsider whether the existence of such a spatial boundary is strictly necessary for self-producing entities. This work presents a novel computational model of a minimal autopoietic system inspired by dendrites and molecular dynamic simulations in three-dimensional space. A series of simulation experiments where the metabolic pathways of a particular autocatalytic set are successively inhibited until autocatalytic entities that could be considered autopoietic are produced. These entities maintain their distinctness in an environment containing multiple identical instances of the entities without the existence of a topological boundary. This gives rise to the concept of a metabolic boundary which manifests as emergent self-selection criteria for the processes of self-production without any need for unique identifiers. However, the adoption of such a boundary comes at a cost, as these autopoietic entities are less suited to their simulated environment than their autocatalytic counterparts. Finally, this work showcases a generalized metabolism-centered approach to the study of autopoiesis that can be applied to both physical and abstract systems alike.

Keywords: autocatalysis; autopoiesis without spatial boundaries; characterization of living systems; complex systems; computational autopoiesis; emergence of individuality; metabolic boundary; metabolism; network science; self-production.


Conflict of interest statement

The authors declare no conflict of interest.

Figures

Figure 1
Figure 1
(ad) Sample images, from randomly initialized simulations, depicting autopoietic instances derived from the schema used in experiment II. Environmental α-particles are depicted in yellow, β-particles belonging to the depicted instance are shown in light blue, γ-particles belonging to the depicted instance are shown in dark blue, and chemical bonds between neighboring particles are depicted as black lines.
Figure 1
Figure 1
(ad) Sample images, from randomly initialized simulations, depicting autopoietic instances derived from the schema used in experiment II. Environmental α-particles are depicted in yellow, β-particles belonging to the depicted instance are shown in light blue, γ-particles belonging to the depicted instance are shown in dark blue, and chemical bonds between neighboring particles are depicted as black lines.
Figure 2
Figure 2
Physical interaction mechanisms involved in chemical bonding: (a) diagram of linear spring mechanism and (b) diagram of torsion spring mechanism.
Figure 3
Figure 3
Chemical reaction mechanisms: (a) β-particle synthesis, (b) γ-particle synthesis, (c) partially bonded β-particle bonding, (d) free β-particle bonding, (e) β-particle decay, and (f) γ-particle decay.
Figure 3
Figure 3
Chemical reaction mechanisms: (a) β-particle synthesis, (b) γ-particle synthesis, (c) partially bonded β-particle bonding, (d) free β-particle bonding, (e) β-particle decay, and (f) γ-particle decay.
Figure 4
Figure 4
Experimental results for experiments I, II, and III. (a,e,i) The time evolution of the quantity of individual instances [majority red instances in red, majority blue instances in blue, all individual instances in thick medium gray]. (b,f,j) The time evolution of the size of individual instances [maximum in black, average in medium gray, minimum in light gray]. (c,g,k) The total mass utilization out of 1008 potential available mass units [total mass of β-particles in light gray, total mass of γ-particles in black, all particles in thick medium gray]. (d,h,l) The time evolution of the average color value within majority red and majority blue individual instances [majority red average γ-particle color value in dark red, majority red average β-particle color value in light red, majority blue average γ-particle color value in dark blue, majority blue average β-particle color value in light blue]. Note, β-particle color values range from −0.9 to 0.9 for visual clarity. All figures depict 300 s of simulation data sampled once every second.
Figure 4
Figure 4
Experimental results for experiments I, II, and III. (a,e,i) The time evolution of the quantity of individual instances [majority red instances in red, majority blue instances in blue, all individual instances in thick medium gray]. (b,f,j) The time evolution of the size of individual instances [maximum in black, average in medium gray, minimum in light gray]. (c,g,k) The total mass utilization out of 1008 potential available mass units [total mass of β-particles in light gray, total mass of γ-particles in black, all particles in thick medium gray]. (d,h,l) The time evolution of the average color value within majority red and majority blue individual instances [majority red average γ-particle color value in dark red, majority red average β-particle color value in light red, majority blue average γ-particle color value in dark blue, majority blue average β-particle color value in light blue]. Note, β-particle color values range from −0.9 to 0.9 for visual clarity. All figures depict 300 s of simulation data sampled once every second.

Similar articles

References

    1. Kauffman S.A. Autocatalytic sets of proteins. J. Theor. Biol. 1986;119:1–24. doi: 10.1016/s0022-5193(86)80047-9. - DOI - PubMed
    1. Hordijk W. A History of Autocatalytic Sets. Biol. Theory. 2019;14:224–246. doi: 10.1007/s13752-019-00330-w. - DOI
    1. Varela F.G., Maturana H.R., Uribe R. Autopoiesis: The organization of Living Systems, Its Characterization and a Model. Biosystems. 1974;5:187–196. doi: 10.1016/0303-2647(74)90031-8. - DOI - PubMed
    1. Kauffman L.H. Autopoiesis and Eigenform. Computation. 2023;11:247. doi: 10.3390/computation11120247. - DOI
    1. Stano P., Nehaniv C., Ikegami T., Damiano L., Witkowski O. Autopoiesis: Foundations of life, cognition, and emergence of self/other. Biosystems. 2023;232:105008. doi: 10.1016/j.biosystems.2023.105008. - DOI - PubMed

LinkOut - more resources