. 2024 May 31;14(6):319.
doi: 10.3390/metabo14060319.

Phenylpropanoid Metabolism in Phaseolus vulgaris during Growth under Severe Drought

Affiliations

Phenylpropanoid Metabolism in Phaseolus vulgaris during Growth under Severe Drought

Luis Eduardo Peña Barrena et al. Metabolites. .

Abstract

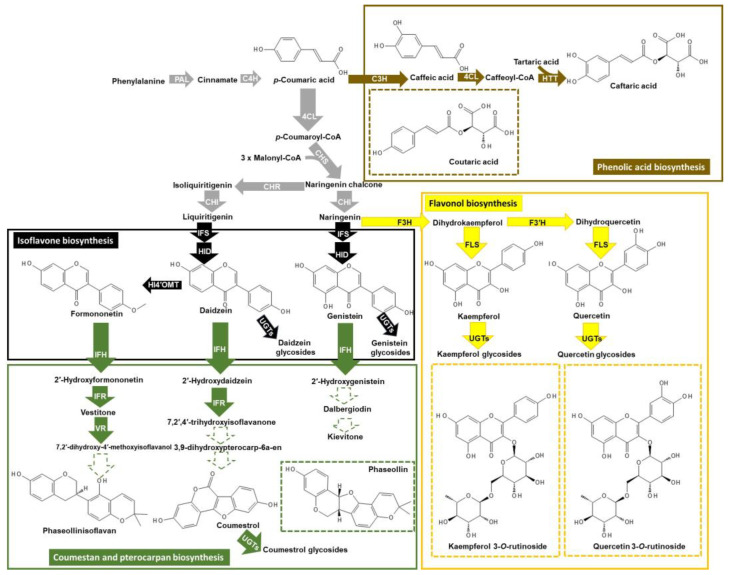
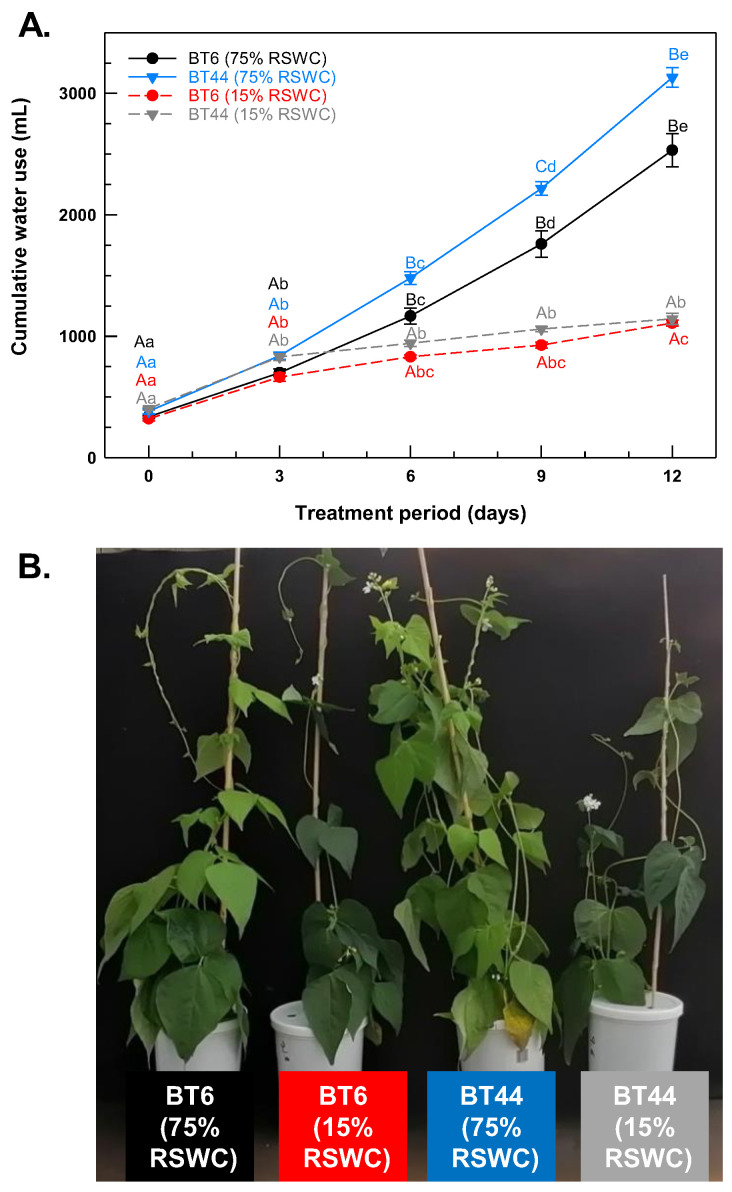
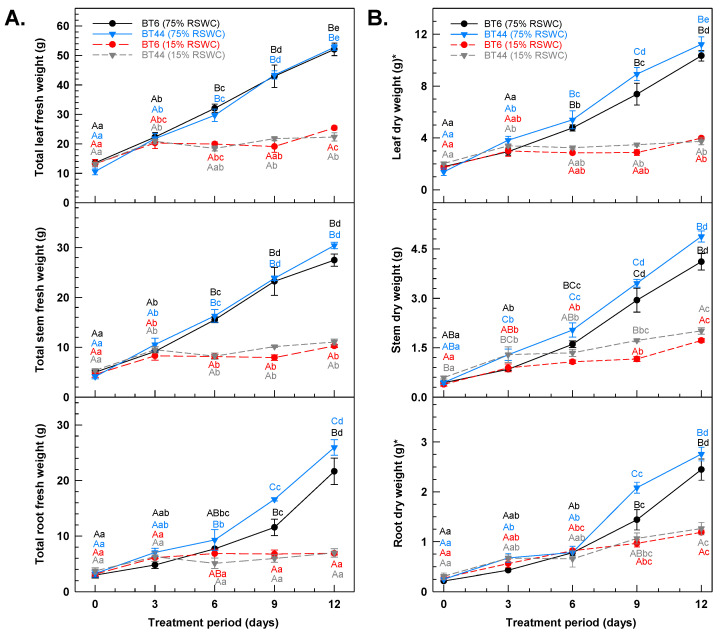
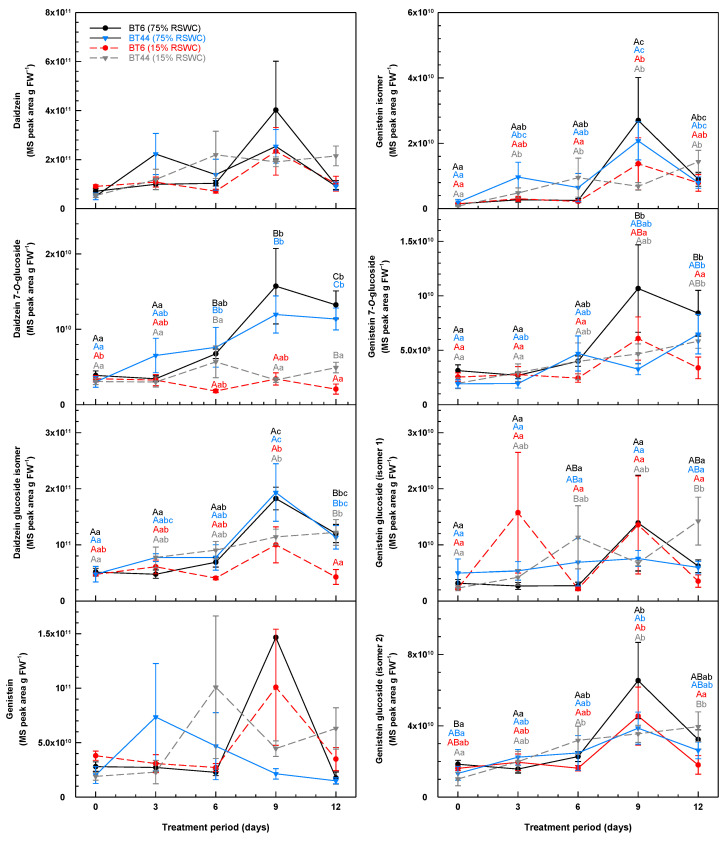
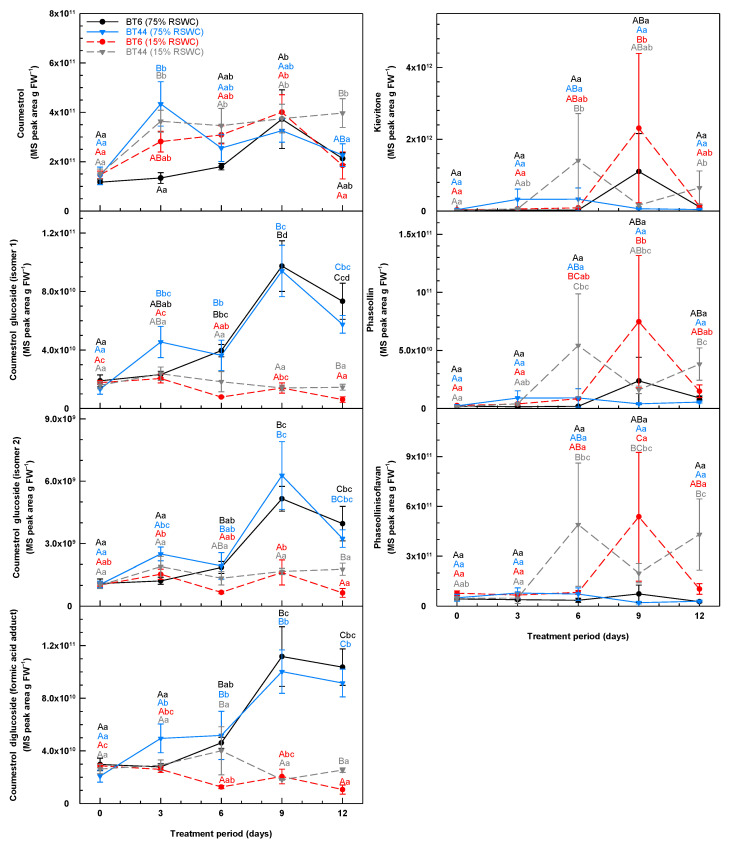
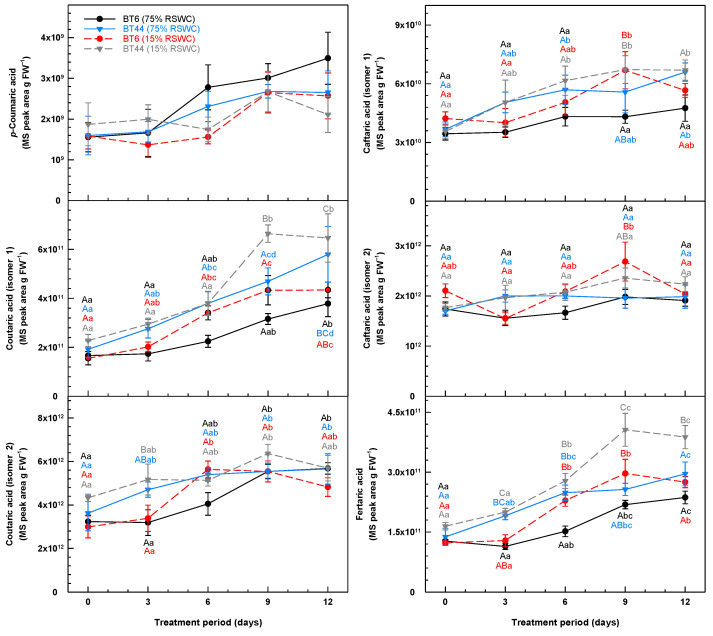
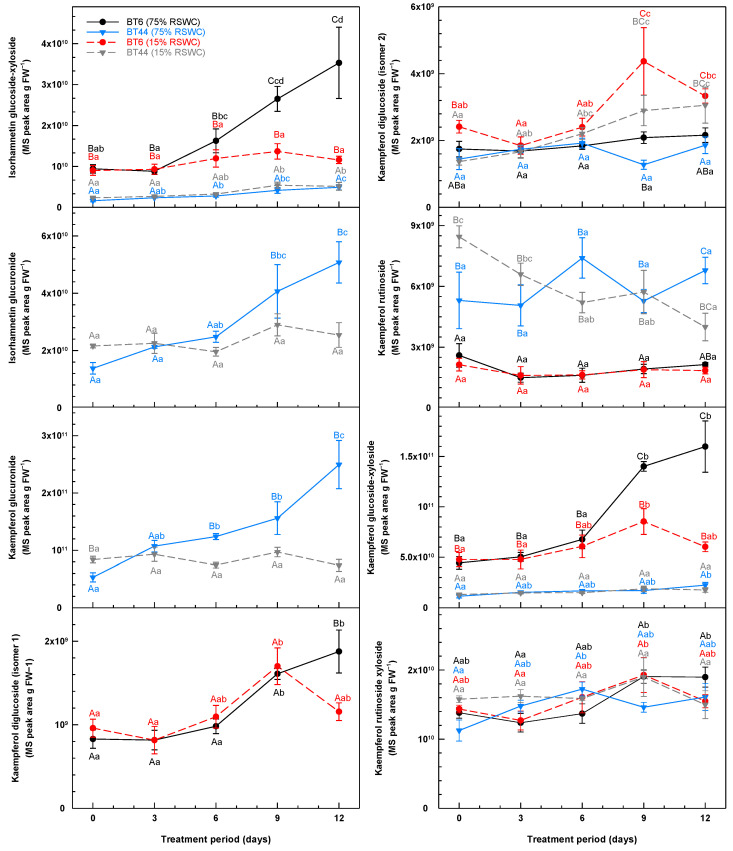
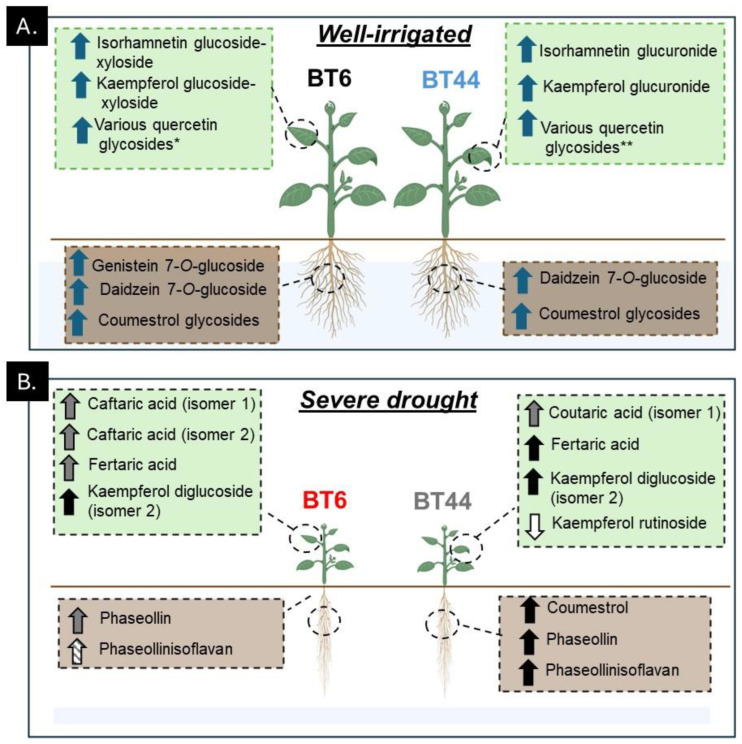
Drought limits the growth and development of Phaseolus vulgaris L. (known as common bean). Common bean plants contain various phenylpropanoids, but it is not known whether the levels of these metabolites are altered by drought. Here, BT6 and BT44, two white bean recombinant inbred lines (RILs), were cultivated under severe drought. Their respective growth and phenylpropanoid profiles were compared to those of well-irrigated plants. Both RILs accumulated much less biomass in their vegetative parts with severe drought, which was associated with more phaseollin and phaseollinisoflavan in their roots relative to well-irrigated plants. A sustained accumulation of coumestrol was evident in BT44 roots with drought. Transient alterations in the leaf profiles of various phenolic acids occurred in drought-stressed BT6 and BT44 plants, including the respective accumulation of two separate caftaric acid isomers and coutaric acid (isomer 1) relative to well-irrigated plants. A sustained rise in fertaric acid was observed in BT44 with drought stress, whereas the greater amount relative to well-watered plants was transient in BT6. Apart from kaempferol diglucoside (isomer 2), the concentrations of most leaf flavonol glycosides were not altered with drought. Overall, fine tuning of leaf and root phenylpropanoid profiles occurs in white bean plants subjected to severe drought.

Keywords: Phaseolus vulgaris; drought; flavonol glycosides; isoflavones; phenylpropanoids.


Conflict of interest statement

The authors declare no conflicts of interest. The funder had no role in the design of the study, in the collection, analyses, or interpretation of data, in the writing of the manuscript, or in the decision to publish the results.

Figures

Figure 1
Figure 1
Proposed phenylpropanoid metabolism in Phaseolus vulgaris subjected to drought. This biochemical scheme was adapted from models of isoflavone, coumestan, pterocarpan, flavonol glycoside, and phenolic acid biosynthesis pathways from previous sources [13,17,18,19,20] and incorporates some of the corresponding metabolites that are known to occur in P. vulgaris [19,21,22]. Early phenylpropanoid biosynthesis steps that are shared between the phenolic acid, isoflavone, and flavonol pathways are represented by enzymatic steps within grey arrows. Black arrows denote metabolic steps associated with the biosynthesis of isoflavones (e.g., daidzein), whereas green arrows denote metabolic steps leading to the production of coumestans and pterocarpans. Arrows with a dashed green outline represent unknown reactions for the biosynthesis of phaseollinisoflavan, coumestrol, and kievitone. Enzymatic reactions for phenolic acid biosynthesis are represented by the brown arrows, whereas yellow arrows represent flavonol glycoside biosynthesis steps. Metabolites encased within green and brown dashed outline boxes respectively represent a pterocarpan and a phenolic acid for which their precise biosynthetic steps are not shown. Flavonol glycosides within yellow dashed outline boxes represent examples of kaempferol and quercetin glycosides that accumulate in P. vulgaris [19]. Abbreviations include: 4CL, 4-coumaroyl:coenzyme A ligase; C3H, coumarate 3-hydroxylase; C4H, cinnamate 4-hydroxylase; CHI, chalcone isomerase; CHR, chalcone reductase; CHS, chalcone synthase; F3H, flavanone 3-hydroxylase; F3′H, flavonoid 3′-hydroxylase; FLS, flavonol synthase; HI4′OMT, 2-hydroxyisoflavanone 4′-O-methyltransferase; HID, 2-hydroxyisoflavanone dehydratase; HTT, hydroxycinnamoyl-CoA: tartaric acid hydroxycinnamoyl transferase; IFH, isoflavone 2′-hydroxylase; IFR, isoflavone reductase; IFS, isoflavone synthase; PAL, phenylalanine ammonia-lyase; UGT, UDP-glucose dependent glycosyltransferase; VR, vestitone reductase. Images of metabolite structures were drawn with the online software PubChem Sketcher, v2.4 (https://pubchem.ncbi.nlm.nih.gov//edit3/index.html, accessed on 14 February 2024) [23].
Figure 2
Figure 2
(A) Cumulative water use of white bean RILs BT6 and BT44 cultivated under 75% relative soil water content (RSWC) and 15% RSWC. Each datum represents the cumulative water use mean ± standard error of four experimental replicates. Means sharing the same letters are not statistically different. Uppercase letters indicate significant differences across the treatments within a single sampling day. Lowercase letters indicate significant differences within a treatment across the 12-day experimental period. Black and blue lettering correspond to the proximal BT6 and BT44 75% RSWC treatment data, respectively. Red and grey lettering correspond to the proximal BT6 and BT44 15% RSWC treatment data, respectively. (B) Representative images of BT6 and BT44 plants sampled from 75% RSWC and 15% RSWC on day 12 of the cultivation period.
Figure 3
Figure 3
Changes in the (A) total fresh weight (FW) and (B) total dry weight (DW) of leaves, stems, and roots of white bean plants cultivated under 75% relative soil water content (RSWC) and 15% RSWC. The top, middle, and bottom plots within each panel represent data corresponding to leaf, stem, and root biomass, respectively. The asterisk in the y-axis label of the total leaf DW plot denotes an extrapolation of the data for the leaf DW per plant; this was calculated by dividing the DW by the proportion of the total leaf FW that was dried after harvest. A similar calculation was performed for the root DW per plant; an asterisk notation in the y-axis label is used to note that the represented scale is for the extrapolated data. The stem DW was based on the drying of the total stem material following excision of leaves and petioles. Each datum within a plot represents the mean ± standard error of the total biomass of the corresponding organ across four experimental replicates. Means sharing the same letters are not statistically different. Uppercase letters indicate significant differences across the treatments within the sampling day. Lowercase letters indicate significant differences within a treatment across the 12-day experimental period. Within each plot, black and blue lettering correspond to the proximal BT6 and BT44 75% RSWC treatment data, respectively; red and grey lettering correspond to the proximal BT6 and BT44 15% RSWC treatment data, respectively.
Figure 4
Figure 4
Temporal alterations in the root isoflavone and isoflavone glycoside profiles during cultivation of white bean RILs BT6 and BT44 under 75% relative soil water content (RSWC) or 15% RSWC. For each metabolite, the concentration is based on the MS peak area associated with the intensity of the metabolite’s parent ion (m/z) divided by the precise mg of root tissue extracted and then extrapolated and expressed as MS peak area g FW−1. Each datum within a metabolite plot represents the mean ± standard error of four experimental replicates. Means sharing the same letter are not statistically different. Uppercase letters indicate significant differences across the RILs and their treatments within a single sampling day. Lowercase letters indicate significant differences within a treatment across the 12-day treatment period. Black and blue lettering correspond to the proximal BT6 and BT44 75% RSWC treatment data, respectively; red and grey lettering correspond to the proximal BT6 and BT44 15% RSWC treatment data, respectively. For the daidzein and genistein panels, the data are not accompanied by statistical letters, as in either case there was no significant difference across any of the compared means.
Figure 5
Figure 5
Temporal alterations in the root concentrations of coumestans and other isoflavone derivatives during cultivation of white bean RILs BT6 and BT44 under 75% relative soil water content (RSWC) or 15% RSWC. For each metabolite, the concentration is based on the MS ion peak area associated with the intensity of the metabolite’s parent ion (m/z) divided by the precise mg of root tissue extracted and then extrapolated and expressed as MS peak area g FW−1. Each datum within a metabolite plot represents the mean ± standard error of four experimental replicates. Means sharing the same letter are not statistically different. Uppercase letters indicate significant differences across the RILs and their treatments within a single sampling day. Lowercase letters indicate significant differences within a treatment across the 12-day treatment period. Black and blue lettering correspond to the proximal BT6 and BT44 75% RSWC treatment data, respectively; red and grey lettering correspond to the proximal BT6 and BT44 15% RSWC treatment data, respectively.
Figure 6
Figure 6
Temporal alterations in the leaf concentrations of phenolic acids during cultivation of white bean RILs BT6 and BT44 under 75% relative soil water content (RSWC) or 15% RSWC. Each phenolic acid concentration is based on the MS peak area associated with the intensity of the metabolite’s parent ion (m/z) divided by the precise mg of leaf tissue extracted and then extrapolated and expressed as MS peak area g FW−1. Each datum within a metabolite plot represents the mean ± standard error of four experimental replicates. Means sharing the same letter are not statistically different. Uppercase letters indicate significant differences across the RILs and their treatments within a single sampling day. Lowercase letters indicate significant differences within a treatment across the 12-day treatment period. Black and blue lettering correspond to the proximal BT6 and BT44 75% RSWC treatment data, respectively; red and grey lettering correspond to the proximal BT6 and BT44 15% RSWC treatment data, respectively. For the p-coumaric acid panel, the data are not accompanied by statistical letters as there was no significant difference across any of the compared means.
Figure 7
Figure 7
Temporal alterations in the concentration of leaf isorhamnetin glycosides and kaempferol glycosides during cultivation of white bean RILs BT6 and BT44 under 75% relative soil water content (RSWC) or 15% RSWC. Each metabolite concentration is based on the MS ion peak area associated with the intensity of the metabolite’s parent ion (m/z) divided by the precise mg of leaves extracted and then extrapolated and expressed as MS peak area g FW−1. Each datum within a metabolite plot represents the mean ± standard error of four experimental replicates. Means sharing the same letter are not statistically different. Uppercase letters indicate significant differences across the RILs and their treatments within a single sampling day. Lowercase letters indicate significant differences within a treatment across the 12-day treatment period. Black and blue lettering correspond to the proximal BT6 and BT44 75% RSWC treatment data, respectively; red and grey lettering correspond to the proximal BT6 and BT44 15% RSWC treatment data, respectively.
Figure 8
Figure 8
Fine tuning of the phenylpropanoid metabolism in the leaves and roots of two white bean RILs (BT6 and BT44) grown under (A) well-irrigated conditions (75% relative soil water content, RSWC) versus (B) severe drought (15% RSWC). For each RIL at each RSWC, the green-shaded box and brown-shaded box represent metabolites that were altered over the 12-day period in their leaves and roots, respectively. The arrow next to each metabolite denotes whether a decrease or increase occurred during cultivation. Blue arrow denotes an increase with cultivation under well-irrigated conditions. Grey arrow denotes a transient accumulation of the metabolite with severe drought; black arrow denotes a sustained increase with severe drought; diagonally striped arrow denotes a greater concentration with severe drought relative to well-irrigated plants but there was no alteration over the 12-day time course; white arrow denotes a sustained decrease of the metabolite concentration with severe drought. The single asterisk (*) represents the accumulation of the following quercetin glycosides in BT6 under well-watered conditions: quercetin 3-O-glucoside, 3-O-galactoside, quercetin xyloside, quercetin dixyloside (isomers 1 and 2), and quercetin glucoside-xyloside (isomers 1 and 2). The double asterisks (**) represent the accumulation of the following quercetin glycosides in BT44 under well-watered conditions: quercetin 3-O-glucuronide and quercetin glucuronide-xyloside. Images of plants were created with BioRender.com (accessed on 6 September 2023).

Similar articles

Cited by

References

    1. IPCC . “Summary for Policymakers” in Global Warming of 1.5 °C. In: Masson-Delmotte V., Zhai P., Pörtner H.-O., Roberts D., Skea J., Shukla P.R., Pirani A., Moufouma-Okia W., Péan C., Pidcock R., et al., editors. An IPCC Special Report on the Impacts of Global Warming of 1.5 °C above Pre-Industrial Levels and Related Global Greenhouse Gas Emission Pathways, in the Context of Strengthening the Global Response to the Threat of Climate Change, Sustainable Development, and Efforts to Eradicate Poverty. World Meteorological Organization; Geneva, Switzerland: 2018. pp. 3–24.
    1. Losa A., Vorster J., Cominelli E., Sparvoli F., Paolo D., Sala T., Ferrari M., Carbonaro M., Marconi S., Camilli E., et al. Drought and heat affect common bean minerals and human diet—What we know and where to go. Food Energy Secur. 2022;11:e351. doi: 10.1002/fes3.351. - DOI
    1. FAOSTAT Database Food and Agriculture Organization of the United Nations, Statistics Division, Rome. 2013. [(accessed on 24 February 2024)]. Available online: http://fenix.fao.org/faostat/beta/en/#home.
    1. Uebersax M.A., Cichy K.A., Gomez F.E., Porch T.G., Heitholt J., Osorno J.M., Kamfwa K., Snapp S.S., Bales S. Dry beans (Phaseolus vulgaris L.) as a vital component of sustainable agriculture and food security—A review. Legume Sci. 2023;5:e155. doi: 10.1002/leg3.155. - DOI
    1. Daryanto S., Wang L., Jacinthe P.A. Global synthesis of drought effects on food legume production. PLoS ONE. 2015;10:e0127401. doi: 10.1371/journal.pone.0127401. - DOI - PMC - PubMed

LinkOut - more resources