. 2024 Jun 7;14(6):137.
doi: 10.3390/membranes14060137.

Characterizing Cellular Physiological States with Three-Dimensional Shape Descriptors for Cell Membranes

Affiliations

Characterizing Cellular Physiological States with Three-Dimensional Shape Descriptors for Cell Membranes

Guoye Guan et al. Membranes (Basel). .

Abstract

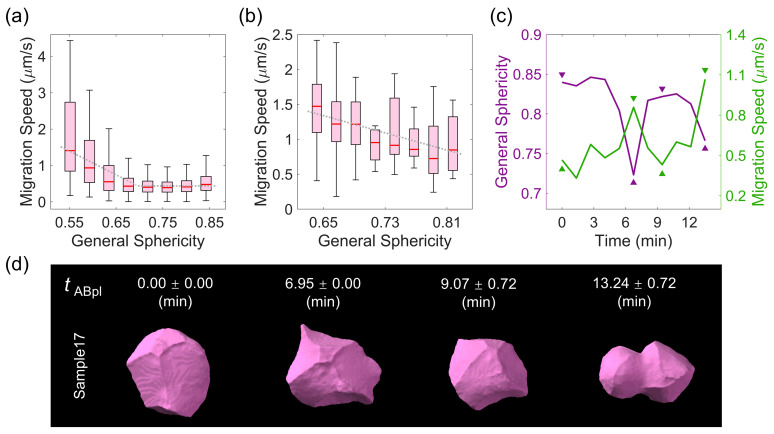
The shape of a cell as defined by its membrane can be closely associated with its physiological state. For example, the irregular shapes of cancerous cells and elongated shapes of neuron cells often reflect specific functions, such as cell motility and cell communication. However, it remains unclear whether and which cell shape descriptors can characterize different cellular physiological states. In this study, 12 geometric shape descriptors for a three-dimensional (3D) object were collected from the previous literature and tested with a public dataset of ~400,000 independent 3D cell regions segmented based on fluorescent labeling of the cell membranes in Caenorhabditis elegans embryos. It is revealed that those shape descriptors can faithfully characterize cellular physiological states, including (1) cell division (cytokinesis), along with an abrupt increase in the elongation ratio; (2) a negative correlation of cell migration speed with cell sphericity; (3) cell lineage specification with symmetrically patterned cell shape changes; and (4) cell fate specification with differential gene expression and differential cell shapes. The descriptors established may be used to identify and predict the diverse physiological states in numerous cells, which could be used for not only studying developmental morphogenesis but also diagnosing human disease (e.g., the rapid detection of abnormal cells).

Keywords: 3D shape descriptor; Caenorhabditis elegans; cell division (cytokinesis); cell fate; cell lineage; cell membrane; cell migration; embryogenesis; fluorescence imaging; gene expression.


Conflict of interest statement

The authors declare no conflicts of interest.

Figures

Figure 1
Figure 1
Fluorescence imaging and morphology reconstruction of wild-type C. elegans embryos (exemplified by Sample05–Sample08, from top to bottom) during imaging time t 0–200 min, starting from no later than the 4-cell stage. For each embryo sample, the 3D projection of image stacks with GFP-labeled cell nuclei (green) and mCherry-labeled cell membranes (red) is shown in the upper row, while the automatic segmentation of cell membranes via CShaper is shown in the lower row [18,19]. Scale bar shown in the bottom right corner (10 μm). The relationships between cell identities and color maps are listed in Table S1. The corresponding time-lapse data are fully illustrated in Movie S1.
Figure 2
Figure 2
Cell lineage tree and cell shape data. (a) The cell lineage tree was averaged over 17 embryo samples, with the last moment of the 4–cell stage (ABa, ABp, EMS, and P2 cells) as time zero. The differentiated somatic cell lineages (AB, EMS, C, and D) and germline stem cells (P2, P3, and P4) are distinguished by different colors. The absent early cells beyond the imaging period are indicated by the gray dotted lines (P0, AB, and P1). (b) The 3D shape of the P4 cell in embryos of Sample05–Sample08 at specific time points (mean ± STD calculated with all of the 17 embryo samples). Note that tP4 represents the actual lifespan of the P4 cell, with its birth considered as time zero and normalized over 17 embryo samples.
Figure 3
Figure 3
The elongation ratio significantly distinguishes cytokinesis during cell division. (a) The statistical comparison (two-sample t-test, where n.s. means not significant with a p value > 0.1) of the elongation ratio between the last three time points before the complete divisions of all cells, where Δtcytokinesis represents the time to the last time point. (b) The shape dynamics of cells from various lineages. For each cell shown in two embryo samples, the cell shapes at the last three time points before the complete divisions are listed from left to right.
Figure 4
Figure 4
Negative correlation between cell migration speed and sphericity, represented by general sphericity. (a) The distribution of migration speed for all reproducible cells against their variable general sphericity. (b) The distribution of migration speed for the ABpl cell against its variable general sphericity. For (a,b), the plotted boxes were constructed using the data range from the lower quartile (Q1) to the upper quartile (Q3), with a line inside showing the median (Q2) and the two bars showing the lower limit [Q11.5Q3Q1] and the upper limit [Q3+1.5Q3Q1]. (c) The change in general sphericity and migration speed in the normalized lifetime of the ABpl cell, averaged over all 17 embryo samples and with four opposite peaks indicated by triangles. (d) The 3D shape of the ABpl cell in embryo Sample17 at the time points (mean ± STD calculated using all 17 embryo samples) indicated in (c). Note that tABpl represents the actual lifespan of the ABpl cell, with its birth considered as time zero and normalized over 17 embryo samples.
Figure 5
Figure 5
Oscillation in cell sphericity and migration speed. (a) The coupled oscillation of general sphericity in both the AB (solid) and P1 lineages (dashed) with opposite phases. (b) The coupled oscillation of general sphericity (left, purple) and migration speed (right, green) in the P1 lineage with opposite phases. (c) The decoupled oscillation of general sphericity (left, purple) and migration speed (right, green) in the AB lineage. For (ac), the value on each curve was obtained by averaging those of all living cells in the targeted lineage and in all embryo samples at each time point.
Figure 6
Figure 6
Lineage-dependent differentiation of cell shape, exemplified by the MS lineage. (a) The time-lapse distribution of the Corey shape factor (1st column), pivotability index (2nd column), Wilson flatness index (3rd column), and Hayakawa flatness ratio (4th column), shown with a colored tree. The MSpap, MSppp, MSaapx, and MSpapx cells are indicated by triangles to highlight their substantially smaller or larger values relative to others. (b) The substantially smaller Corey shape factor of the MSpap, MSppp, MSaapx, and MSpapx cells (indicated by triangles) relative to others. The plotted box was constructed using the data range from the lower quartile (Q1) to the upper quartile (Q3), with a line inside showing the median (Q2) and the two bars showing the lower limit [Q11.5Q3Q1] and the upper limit [Q3+1.5Q3Q1].
Figure 7
Figure 7
Simultaneous differentiation of cell shape and gene expression, exemplified by the D lineage. (a) The time-lapse distribution of Hayakawa roundness (1st column), general sphericity (2nd column), and the spreading index (3rd column) for cells within the D lineage shown with a colored tree. The Daa and Dpa cells are indicated by triangles to highlight their substantially smaller values relative to other cells. (b) The substantially smaller Hayakawa roundness values in the Daa and Dpa cells (indicated by triangles) relative to their sister cells. The plotted box was constructed using the data range from the lower quartile (Q1) to the upper quartile (Q3), with a line inside showing the median (Q2) and two bars showing the lower limit [Q11.5Q3Q1] and the upper limit [Q3+1.5Q3Q1]. (c) In terms of the 3rd generation of the D lineage, the anterior (Daa and Dpa) and posterior (Dap and Dpp) cells had differential expression of FKH-2 and TBX-8/9, respectively, as revealed by previous experimental reports [60].
Figure 8
Figure 8
The graphical user interface of the Shape Descriptor Tool software. An exemplary case (the embryo Sample20, time point 14, ABpl cell) for calculating the 12 3D shape descriptors is shown. A part of the progress status with the corresponding running mission is listed as follows: the top left panel (30%), the top right panel (60%), the bottom left panel (80%), and the bottom right panel (90%).

Similar articles

Cited by

References

    1. Suzuki M., Morita H., Ueno N. Molecular mechanisms of cell shape changes that contribute to vertebrate neural tube closure. Dev. Growth Differ. 2012;54:266–276. doi: 10.1111/j.1440-169X.2012.01346.x. - DOI - PubMed
    1. Chan C.J., Heisenberg C.-P., Hiiragi T. Coordination of morphogenesis and cell-fate specification in development. Curr. Biol. 2017;27:R1024–R1035. doi: 10.1016/j.cub.2017.07.010. - DOI - PubMed
    1. Izquierdo E., Quinkler T., De Renzis S. Guided morphogenesis through optogenetic activation of Rho signalling during early Drosophila embryogenesis. Nat. Commun. 2018;9:2366. doi: 10.1038/s41467-018-04754-z. - DOI - PMC - PubMed
    1. Walker F.R., Beynon S.B., Jones K.A., Zhao Z., Kongsui R., Cairns M., Nilsson M. Dynamic structural remodelling of microglia in health and disease: A review of the models, the signals and the mechanisms. Brain Behav. Immun. 2014;37:1–14. doi: 10.1016/j.bbi.2013.12.010. - DOI - PubMed
    1. Leyh J., Paeschke S., Mages B., Michalski D., Nowicki M., Bechmann I., Winter K. Classification of microglial morphological phenotypes using machine learning. Front. Cell Neurosci. 2021;15:701673. doi: 10.3389/fncel.2021.701673. - DOI - PMC - PubMed

LinkOut - more resources