. 2024 Jun 19;13(6):518.
doi: 10.3390/pathogens13060518.

Evaluation of RNA Secondary Stem-Loop Structures in the UTRs of Mouse Hepatitis Virus as New Therapeutic Targets

Affiliations

Evaluation of RNA Secondary Stem-Loop Structures in the UTRs of Mouse Hepatitis Virus as New Therapeutic Targets

Gyuhyun Kang et al. Pathogens. .

Abstract

MHV-A59 is a beta-coronavirus that causes demyelinating encephalitis and hepatitis in mice. Recently, the mouse infection model of MHV-A59 has been used as an alternative animal infection model for SARS-CoV and SARS-CoV-2, aiding the development of new antiviral drugs. In this study, the MHV-A59 model was employed to investigate the potential of SARS-CoV-2 UTRs as new targets for antiviral drugs. Optimal targets within the MHV-A59 UTRs were identified using a shRNA and siRNA design tool, focusing on RNA secondary stem-loop (SL) structures in the UTRs. We then examined whether the designed RNAi constructs could inhibit MHV-A59 replication. In the 5'UTR, the stem-loop 1 (SL1) was identified as the most effective target, while in the 3'UTR, the minimal element for the initiation of negative-strand RNA synthesis (MIN) proved to be the most effective. Importantly, siRNAs targeting SL1 and MIN structures significantly reduced total RNA synthesis, negative-strand genomic RNA synthesis, subgenomic (sg) RNA synthesis, viral titer, and the plaque size of MHV-A59 compared to the control. Although not statistically significant, the combination of siSL1 and siMIN had a stronger effect on inhibiting MHV-A59 replication than either siRNA monotherapy. Interestingly, while the SL1 structure is present in both MHV and SARS-CoV-2, the MIN structure is unique to MHV. Thus, the SL1 of SARS-CoV-2 may represent a novel and promising target for RNAi-based antiviral drugs.

Keywords: MHV-A59; UTR; shRNA; siRNA; stem-loop.


Conflict of interest statement

The authors declare no conflict of interest.

Figures
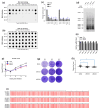
Figure 2
Figure 2
Inhibitory effects of shRNAs targeting RNA secondary SL structures in the 5′UTR on MHV-A59 replication. (a) RNA dot blot analysis for inhibitory effects of shRNA on MHV replication. DBT cells (DBT-5′shRNA cells) expressing shRNAs (5′shRNA) targeted for MHV-A59 5′UTR SL structures were established by the shRNA lentiviral system. MHV-A59 was infected at an M.O.I 10−1 to 10−4 into DBT-5′shRNA cells. RNA dot blot probes were made to detect the MHV N gene (NC_048217.1, nt 31,519-31,018). (b) As an internal control, the expression of the actin gene (NM_007393.5, nt 668-1180) in DBT-5′shRNA cells was analyzed by RNA dot blot assay. (c) The relative inhibitory effect of 5′shRNAs on MHV-A59 infection based on actin expression was quantified by ImageJ software (https://imagej.net/ij/, accessed on 1 January 2023) [27]. One-way analysis of variance was performed, followed by Tukey’s multiple comparison test to verify statistical significance by 5′shRNAs. Statistically significant groups were labeled as A, B, and C to differentiate them. (d) Northern analysis for inhibitory effect of 5′shRNA on the MHV sgRNA synthesis. MHV-A59 at an M.O.I of 0.5 was infected into DBT-5′shRNA cells for 24 h. Mock (negative control) was performed with DBT-5′shRNA cells that were not infected with MHV-A59. Patterns of the MHV-A59 sgRNA production in DBT-5′shRNA cells were investigated with a DIG labelled N gene probe. (e) The effect of 5′shRNA inhibition on the MHV sgRNA synthesis was quantitatively analyzed with Image J software. (f) The one-step growth experiments of MHV-A59 infected DBT-5′shRNA cells. 5 × 10⁴ DBT cells were seeded in 24-well plates and infected with MHV-A59 at an M.O.I of 3 for 0, 6, 12, 18, and 24 h the next day. After each infection time, MHV-A59 was harvested and the growth rate of the virus was analyzed. (g) Representative plaque shape formed by MHV-A59 infecting DBT-5′shRNA cells. (h) Average plaque size of MHV-A59 formed on DBT-5′shRNA cells. Statistical analysis was performed using a student’s t-test and a one-way analysis of variance (ANOVA). A post-hoc test was conducted using Tukey’s multiple comparisons test. (i) Analysis of the 5′UTR sequence of MHV-A59 infected DBT-5′shRNA cells. The MHV-A59 virus, harvested after infecting DBT-5′shRNA cells, was designated as P0. Subsequently, the harvested virus obtained after re-infecting cells was named P1, and the virus obtained after another round of infection and harvest was named P2. RNA was extracted from each of these virus samples, and sequence analysis was performed. * indicates a statistical difference in the t-test between the shCon-treated plaque size group and the shSL1/2 plaque size group; ** indicates a statistical difference in the t-test between the shCon-treated plaque size group and the shSL3/4 plaque size group; *** indicates a statistical difference in the t-test statistical difference between the shCon-treated plque size group and the siMIN-treated plque size group is significant.
Figure 1
Figure 1
Design of RNAi targets in 5′ and 3′ UTRs in MHV-A59 genome. (a) The sequence schematic diagram to display RNAi (shRNA and siRNA) targets in RNA secondary SL structures of MHV-A59 5′ UTR. (b) The sequence schematic diagram to display RNAi (shRNA and siRNA) targets in RNA secondary SL structures of MHV-A59 3′ UTR. In a previous study [18], the removal of SL1 A35 (5′ΔA35) in the MHV-A59 5′ untranslated region (UTR) resulted in changes to A31307G (3′A29G, numbered from the 3′ end) and A31257G (3′A78G, numbered from the 3′ end) in the MHV-A59 3′ UTR. The RNA secondary SL structures were labelled 5′ΔA35, 3’A29G, and 3’A78G, respectively.
Figure 3
Figure 3
Inhibitory effects of siRNAs targeting RNA secondary SL structures in the UTR on MHV replication. (a) RNA dot blot analysis for inhibitory effects of 5′siRNA on MHV replication. DBT cells (DBT-5′siRNA cells) were treated with two concentrations (100, 500 ng) of siRNA (5′siRNA) targeted for MHV-A59 5′UTR SL structures. DBT-5′siRNA cells were infected with MHV-A59 at an M.O.I of 10−2 for 24 h. RNA dot blot probes were made to detect the MHV N gene. (b) As an internal control, the expression of the actin gene in DBT-5′siRNA cells was analyzed by RNA dot blot assay. (c) The relative inhibitory effect of siRNAs on MHV-A59 infection based on actin expression was quantified by Image J software. One-way analysis of variance was performed, followed by Tukey’s multiple comparison test to verify statistical significance by 5′siRNAs. Statistically significant groups were labeled as A, B, C, D, E, F and G to differentiate them. (d) Northern analysis for inhibitory effect of 20 nM siSL1 on the MHV sgRNA synthesis. MHV-A59 at an M.O.I of 0.5 was infected into DBT-5′siRNA cells for 24 h. Mock (negative control) was performed with DBT-5′siRNA cells that were not infected with MHV-A59. Patterns of MHV-A59 sgRNA production were investigated with a DIG labelled N gene probe. (e) The effect of 20 nM siSL1 inhibition on the MHV sgRNA synthesis was quantitatively analyzed with Image J software. (f) The one-step growth curve of MHV-A59-infected DBT-5′siRNA cells treated with 20 nM siSL1. 5 × 10⁴ DBT cells were seeded in 24-well plates and infected with MHV-A59 at an M.O.I of 3 for 0, 6, 12, 18, and 24 h the next day. After each infection time, MHV-A59 was harvested and the growth rate of the virus was analyzed. (g) Representative plaque shape formed by MHV-A59 infecting DBT-siRNA cells treated with 20 nM siSL1. (h) Average plaque size of MHV-A59 formed on DBT-5′siRNA cells treated with 20 nM siSL1. Statistical analysis was performed using a student’s t-test and a one-way analysis of variance (ANOVA). A post-hoc test was conducted using Tukey’s multiple comparisons test. (i) Analysis of the 5′UTR sequence of MHV-A59-infected DBT-5′siRNA cells treated with 20 nM siSL1. The MHV-A59 virus, harvested after infecting DBT-5′siRNA cells, was designated as P0. Subsequently, the harvested virus obtained after re-infecting cells was named P1, and the virus obtained after another round of infection and harvest was named P2. RNA was extracted from each of these virus samples, and sequence analysis was performed. (j) Detection of MHV-A59 gRNA in DBT cells treated with 10 nM siSL1. MHV-A59 negative-strand RNA and positive-strand gRNA were quantified relative to actin control by RT-qPCR assay. The negative-strand RNA synthesis in siSL1-treated DBT cells was statistically significantly decreased compared to the negative-strand RNA synthesis in siCon-treated DBT cells. Statistically significant groups were labeled as A and B to differentiate them. * indicates a statistical difference in the t-test between the shCon-treated plaque size group and the shSL1/2 plaque size group; ** indicates a statistical difference in the t-test between the shCon-treated plaque size group and the shSL3/4 plaque size group.
Figure 4
Figure 4
Inhibitory effects of shRNAs targeting RNA secondary SL structures in the 3′UTR on MHV replication. (a) RNA dot blot analysis for inhibition of MHV replication by 3′sh1 and 3′sh2 targeting MHV-A59 3′UTR pseudoknot. DBT-3′sh1 and DBT-3′sh2 cells expressing 3′sh1 and 3′sh2 were established by the shRNA lentiviral system. MHV-A59 was infected at an M.O.I of 10−1 to 10−4 into DBT-3′sh1 and DBT-3′sh2 cells, respectively. RNA dot blot probes were made to detect the MHV N gene. (b) As an internal control, the expression of the actin gene in DBT-3′sh1 and DBT-3′sh2 cells was analyzed by RNA dot blot assay, respectively. (c) The relative inhibitory effect of 3′sh1 and 3′sh2 on MHV-A59 infection based on actin expression was quantified by Image J software, respectively. MHV-A59 N gene expression was evaluated relative to actin gene expression in DBT-3′sh1 and DBT-3′sh2 cells infected with MHV-A59, respectively. One-way analysis of variance was performed, followed by Tukey’s multiple comparison test to verify statistical significance by 3′shRNAs. Statistically significant groups were labeled as A and B to differentiate them. (d) RNA dot blot analysis for inhibition of MHV replication by 3′sh3 and 3′sh4 targeting MHV-A59 3′UTR pseudoknot. DBT-3′sh3 and DBT-3′sh4 cells expressing 3′sh3 and 3′sh4 were established by the shRNA lentiviral system. MHV-A59 was infected at an M.O.I of 10−1 to 10−4 into DBT-3′sh3 and DBT-3′sh4 cells, respectively. RNA dot blot probes were made to detect the MHV N gene. (e) As an internal control, the expression of the actin gene in DBT-3′sh3 and DBT-3′sh4 cells was analyzed by RNA dot blot assay, respectively. (f) The relative inhibitory effect of 3′sh3 and 3′sh4 on MHV-A59 infection based on actin expression was quantified by Image J software, respectively. MHV-A59 N gene expression was evaluated relative to actin gene expression in DBT-3′sh3 and DBT-3′sh4 cells infected with MHV-A59, respectively. One-way analysis of variance was performed, followed by Tukey’s multiple comparison test to verify statistical significance by 3′shRNAs. Statistically significant groups were labeled as A, B and C to differentiate them. (g) Northern analysis for inhibitory effect of 3′sh1 on the MHV sgRNA synthesis. MHV-A59 at an M.O.I of 0.5 was infected into DBT-3′sh1 cells for 24 h. Mock (negative control) was performed with DBT-3′sh1 cells that were not infected with MHV-A59. MHV sgRNA production pattern was probed with a DIG labelled N gene probe. (h) The effect of 3′sh1 inhibition on MHV sgRNA production was quantitatively analyzed with Image J software. (i) Northern analysis for inhibitory effect of 3′sh2 on MHV sgRNA synthesis. MHV-A59 at an M.O.I of 0.5 was infected into DBT-3′sh2 cells for 24 h. Mock (negative control) was performed with DBT-3′sh2 cells that were not infected with MHV-A59. MHV sgRNA synthesis pattern was probed with a DIG labelled N gene probe. (j) The effect of 3′sh2 inhibition on the MHV sgRNA synthesis was quantitatively analyzed with Image J software. (k) The one-step growth experiments of MHV-A59-infected DBT-3′sh1 cells. 5 × 10⁴ DBT cells were seeded in 24-well plates and infected with MHV-A59 at an M.O.I of 3 for 0, 6, 12, 18, and 24 h the next day. After each infection time, MHV-A59 was harvested and the growth rate of the virus was analyzed. (l) Representative plaque shape formed by MHV-A59 infecting DBT-3′sh1 cells. (m) Average plaque size of MHV-A59 formed on DBT-3′sh1 cells. Statistical analysis was performed using a student’s t-test and a one-way analysis of variance (ANOVA). A post-hoc test was conducted using Tukey’s multiple comparisons test. * indicates a statistical difference in the t-test between the shCon-treated plaque size group and the shSL1/2 plaque size group; ** indicates a statistical difference in the t-test between the shCon-treated plaque size group and the shSL3/4 plaque size group; *** indicates a statistical difference in the t-test statistical difference between the shCon-treated plque size group and the siMIN-treated plque size group is significant.
Figure 4
Figure 4
Inhibitory effects of shRNAs targeting RNA secondary SL structures in the 3′UTR on MHV replication. (a) RNA dot blot analysis for inhibition of MHV replication by 3′sh1 and 3′sh2 targeting MHV-A59 3′UTR pseudoknot. DBT-3′sh1 and DBT-3′sh2 cells expressing 3′sh1 and 3′sh2 were established by the shRNA lentiviral system. MHV-A59 was infected at an M.O.I of 10−1 to 10−4 into DBT-3′sh1 and DBT-3′sh2 cells, respectively. RNA dot blot probes were made to detect the MHV N gene. (b) As an internal control, the expression of the actin gene in DBT-3′sh1 and DBT-3′sh2 cells was analyzed by RNA dot blot assay, respectively. (c) The relative inhibitory effect of 3′sh1 and 3′sh2 on MHV-A59 infection based on actin expression was quantified by Image J software, respectively. MHV-A59 N gene expression was evaluated relative to actin gene expression in DBT-3′sh1 and DBT-3′sh2 cells infected with MHV-A59, respectively. One-way analysis of variance was performed, followed by Tukey’s multiple comparison test to verify statistical significance by 3′shRNAs. Statistically significant groups were labeled as A and B to differentiate them. (d) RNA dot blot analysis for inhibition of MHV replication by 3′sh3 and 3′sh4 targeting MHV-A59 3′UTR pseudoknot. DBT-3′sh3 and DBT-3′sh4 cells expressing 3′sh3 and 3′sh4 were established by the shRNA lentiviral system. MHV-A59 was infected at an M.O.I of 10−1 to 10−4 into DBT-3′sh3 and DBT-3′sh4 cells, respectively. RNA dot blot probes were made to detect the MHV N gene. (e) As an internal control, the expression of the actin gene in DBT-3′sh3 and DBT-3′sh4 cells was analyzed by RNA dot blot assay, respectively. (f) The relative inhibitory effect of 3′sh3 and 3′sh4 on MHV-A59 infection based on actin expression was quantified by Image J software, respectively. MHV-A59 N gene expression was evaluated relative to actin gene expression in DBT-3′sh3 and DBT-3′sh4 cells infected with MHV-A59, respectively. One-way analysis of variance was performed, followed by Tukey’s multiple comparison test to verify statistical significance by 3′shRNAs. Statistically significant groups were labeled as A, B and C to differentiate them. (g) Northern analysis for inhibitory effect of 3′sh1 on the MHV sgRNA synthesis. MHV-A59 at an M.O.I of 0.5 was infected into DBT-3′sh1 cells for 24 h. Mock (negative control) was performed with DBT-3′sh1 cells that were not infected with MHV-A59. MHV sgRNA production pattern was probed with a DIG labelled N gene probe. (h) The effect of 3′sh1 inhibition on MHV sgRNA production was quantitatively analyzed with Image J software. (i) Northern analysis for inhibitory effect of 3′sh2 on MHV sgRNA synthesis. MHV-A59 at an M.O.I of 0.5 was infected into DBT-3′sh2 cells for 24 h. Mock (negative control) was performed with DBT-3′sh2 cells that were not infected with MHV-A59. MHV sgRNA synthesis pattern was probed with a DIG labelled N gene probe. (j) The effect of 3′sh2 inhibition on the MHV sgRNA synthesis was quantitatively analyzed with Image J software. (k) The one-step growth experiments of MHV-A59-infected DBT-3′sh1 cells. 5 × 10⁴ DBT cells were seeded in 24-well plates and infected with MHV-A59 at an M.O.I of 3 for 0, 6, 12, 18, and 24 h the next day. After each infection time, MHV-A59 was harvested and the growth rate of the virus was analyzed. (l) Representative plaque shape formed by MHV-A59 infecting DBT-3′sh1 cells. (m) Average plaque size of MHV-A59 formed on DBT-3′sh1 cells. Statistical analysis was performed using a student’s t-test and a one-way analysis of variance (ANOVA). A post-hoc test was conducted using Tukey’s multiple comparisons test. * indicates a statistical difference in the t-test between the shCon-treated plaque size group and the shSL1/2 plaque size group; ** indicates a statistical difference in the t-test between the shCon-treated plaque size group and the shSL3/4 plaque size group; *** indicates a statistical difference in the t-test statistical difference between the shCon-treated plque size group and the siMIN-treated plque size group is significant.
Figure 5
Figure 5
Inhibitory effect of siRNAs targeting RNA secondary SL structures in the 3′UTR on MHV replication. (a) RNA dot blot analysis for inhibitory effect of 3′siRNA on MHV replication. DBT cells (DBT-3′siRNA cells) were treated with two concentrations (100, 500 ng) of siRNA (3′siRNA) targeted for MHV-A59 3′UTR SL structures. DBT-3′siRNA cells were infected with MHV-A59 at an M.O.I of 10−2 for 24 h. RNA dot blot probes were made to detect the MHV N gene. (b) As an internal control, the expression of the actin gene in DBT-3′siRNA cells was analyzed by RNA dot blot assay. (c) The relative inhibitory effect of 3′siRNAs on MHV-A59 infection based on actin expression was quantified by Image J software. MHV-A59 N gene expression was evaluated relative to actin gene expression in DBT-3′siRNA cells infected with MHV-A59. One-way analysis of variance was performed, followed by Tukey’s multiple comparison test to verify statistical significance by 3′siRNAs. Statistically significant groups were labeled as A, B, C, D, E and F to differentiate them. (d) Northern analysis for inhibitory effect of 20 nM siMIN on the MHV sgRNA synthesis. MHV-A59 at an M.O.I of 0.5 was infected into DBT-3′siRNA cells for 24 h. Mock (negative control) was performed with DBT-3′siRNA cells that were not infected with MHV-A59. Patterns of MHV-A59 sgRNA production in DBT-3′siRNA cells were investigated with a DIG labelled N gene probe. (e) The effect of siMIN inhibition on the MHV sgRNA synthesis was quantitatively analyzed with Image J software. (f) The one-step growth experiments of MHV-A59-infected DBT-3′siRNA cells treated with 20 nM siMIN. 5 × 10⁴ DBT cells were seeded in 24-well plates and infected with MHV-A59 at an M.O.I of 3 for 0, 6, 12, 18, and 24 h the next day. After each infection time, MHV-A59 was harvested and the growth rate of the virus was analyzed. (g) Representative plaque shape formed by MHV-A59 infecting DBT-3′siRNA cells treated with 20 nM siMIN. (h) Average plaque size of MHV-A59 formed on DBT-3′siRNA cells treated with 20 nM siMIN. Statistical analysis was performed using a student’s t-test and a one-way analysis of variance (ANOVA). A post-hoc test was conducted using Tukey’s multiple comparisons test. (i) Analysis of 3′UTR sequence of MHV-A59 infected DBT-3′siRNA cells treated with 20 nM siMIN. The MHV-A59 virus, harvested after infecting DBT-3′siRNA cells, was designated as P0. Subsequently, the harvested virus obtained after re-infecting cells was named P1, and the virus obtained after another round of infection and harvest was named P2. RNA was extracted from each of these virus samples, and sequence analysis was performed. (j) Detection of MHV-A59 gRNA in DBT cells treated with 10 nM siMIN. MHV-A59 negative-strand RNA and positive-strand gRNA were quantified relative to actin control by RT-qPCR assay. The negative-strand RNA synthesis in siMIN-treated DBT cells was statistically significantly decreased compared to the negative-strand RNA synthesis in siCon-treated DBT cells. Statistically significant groups were labeled as A and B to differentiate them. * indicates a statistical difference in the t-test between the shCon-treated plaque size group and the shSL1/2 plaque size group; ** indicates a statistical difference in the t-test between the shCon-treated plaque size group and the shSL3/4 plaque size group; *** indicates a statistical difference in the t-test statistical difference between the shCon-treated plque size group and the siMIN-treated plque size group is significant.
Figure 6
Figure 6
Inhibitory effects of siRNAs targeting SL structures in the 5′UTR and 3′UTR of MHV-A59. (a) RNA dot blot assay to analyze the effectiveness of the combination of siSL1 (5′siRNA) and siMIN (siRNA) to inhibit MHV-A59 replication. DBT cells (DBT-5′3′siRNA cells) were treated with two concentrations of siSL1 and siMIN combinations. For siSL1 and siMIN monotherapy, concentrations of 10 nM and 20 nM of each siRNA were used, respectively. For combination therapy, a half-and-half mixture of the two siRNAs at concentrations of 10 nM (5 nM siSL1 + 5 nM siMIN) and 20 nM (10 nM siSL1 + 10 nM siMIN) was used. DBT-5′3′siRNA cells were infected with MHV-A59 at an M.O.I of 10−2 for 24 h. RNA dot blot probes were made to detect the MHV N gene. (b) As an internal control, the expression of the actin gene in DBT-5′3′siRNA cells was analyzed by RNA dot blot assay. (c) The inhibitory effect of MHV-A59 replication by the combination therapy of siSL1 and siMIN (5 + 5, 10 + 10) was quantitatively analyzed by Image J software. MHV-A59 N gene expression was evaluated relative to actin gene expression in DBT-5′3′siRNA cells infected with MHV-A59. A primary one-way analysis of variance, followed by a secondary Tukey’s multiple comparison test was performed to determine the statistical significance between siSL1, siMIN, and the combination. Statistically significant groups were labeled as A, B and C to differentiate them. (d) Northern analysis for inhibitory effect of the combination therapy of siSL1 and siMIN (5 + 5) on the MHV sgRNA synthesis. MHV-A59 at an M.O.I of 0.5 was infected into DBT-5′3′siRNA cells for 24 h. Mock (negative control) was performed with DBT-5′3′siRNA cells that were not infected with MHV-A59. Patterns of MHV-A59 sgRNA production in DBT-5′3′siRNA cells were investigated with a DIG labelled N gene probe. (e) The inhibitory effect of the combination therapy of siSL1 and siMIN (5 + 5) on the MHV sgRNA synthesis was quantitatively analyzed with Image J software. Based on the sgRNA production of MHV-A59 infecting siCon-treated DBT cells, we quantified the sgRNA production of MHV-A59 infecting siSL1, si3MIN, and the combination-treated DBT cells. (f) The one-step growth experiments of MHV-A59-infected DBT-5′3′siRNA cells treated with the combination therapy of 5 nM siSL1 and 5 nM siMIN (5 + 5). 5 × 10⁴ DBT cells were seeded in 24-well plates and infected with MHV-A59 at an M.O.I of 3 for 0, 6, 12, 18, and 24 h the next day. After each infection time, MHV-A59 was harvested and the growth rate of the virus was analyzed. (g) Representative plaque shapes formed by MHV-A59 infecting DBT-5′3′siRNA cells treated with the combination therapy of 5 nM siSL1 and 5 nM siMIN (5 + 5). (h) Average plaque size of MHV-A59 formed on DBT-5′3′siRNA cells treated with the combination therapy of 5 nM siSL1 and 5 nM siMIN (5 + 5). Statistical analysis was performed using a student’s t-test and a one-way analysis of variance (ANOVA). A post-hoc test was conducted using Tukey’s multiple comparisons test. Statistically significant groups were labeled as A and B to differentiate them.

Similar articles

References

    1. Malik Y.A. Properties of coronavirus and SARS-CoV-2. Malays. J. Pathol. 2020;42:3–11. - PubMed
    1. Tan C.W., Chia W.N., Qin X., Liu P., Chen M.I.-C., Tiu C., Hu Z., Chen V.C.-W., Young B.E., Sia W.R. A SARS-CoV-2 surrogate virus neutralization test based on antibody-mediated blockage of ACE2–spike protein–protein interaction. Nat. Biotechnol. 2020;38:1073–1078. doi: 10.1038/s41587-020-0631-z. - DOI - PubMed
    1. Coley S.E., Lavi E., Sawicki S.G., Fu L., Schelle B., Karl N., Siddell S.G., Thiel V. Recombinant mouse hepatitis virus strain A59 from cloned, full-length cDNA replicates to high titers in vitro and is fully pathogenic in vivo. J. Virol. 2005;79:3097–3106. doi: 10.1128/JVI.79.5.3097-3106.2005. - DOI - PMC - PubMed
    1. Yuan S., Balaji S., Lomakin I.B., Xiong Y. Coronavirus Nsp1: Immune response suppression and protein expression inhibition. Front. Microbiol. 2021;12:752214. doi: 10.3389/fmicb.2021.752214. - DOI - PMC - PubMed
    1. Shuipys T., Montazeri N. Optimized Protocols for the Propagation and Quantification of Infectious Murine Hepatitis Virus (MHV-A59) Using NCTC Clone 1469 and 929 Cells. Methods Protoc. 2022;5:5. doi: 10.3390/mps5010005. - DOI - PMC - PubMed

MeSH terms

LinkOut - more resources