

The Characteristics of Endurance Events with a Variable Pacing Profile-Time to Embrace the Concept of "Intermittent Endurance Events"?
- PMID: 38921858
- PMCID: PMC11207974
- DOI: 10.3390/sports12060164
The Characteristics of Endurance Events with a Variable Pacing Profile-Time to Embrace the Concept of "Intermittent Endurance Events"?
Abstract
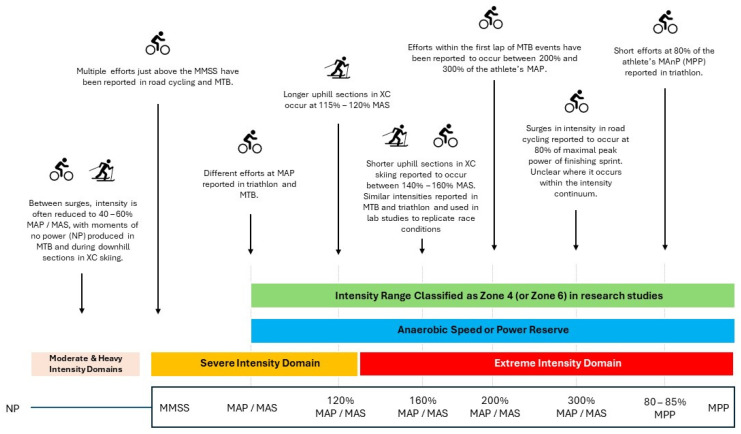
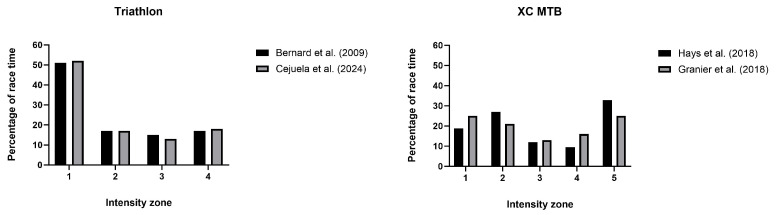
A variable pacing profile is common in different endurance events. In these races, several factors, such as changes in elevation or race dynamics, lead participants to perform numerous surges in intensity. These surges are so frequent that certain events, such as cross-country (XC) skiing, mountain biking (MTB), triathlon, and road cycling, have been termed "intermittent endurance events". The characteristics of these surges vary depending on the sport: MTB and triathlon require athletes to perform numerous short (<10 s) bouts; XC skiing require periods of short- and moderate-(30 s to 2 min) duration efforts, while road cycling is comprised of a mix of short-, moderate-, and long-duration (>2 min) bouts. These bouts occur at intensities above the maximal metabolic steady state (MMSS), with many efforts performed at intensities above the athletes' maximal aerobic power or speed (MAP/MAS) (i.e., supramaximal intensities). Given the factors that influence the requirement to perform surges in these events, athletes must be prepared to always engage in a race with a highly stochastic pace. The aim of this review is to characterize the variable pacing profile seen in endurance events and to discuss how the performance of multiple maximal and supramaximal surges in intensity can affect how athletes fatigue during a race and influence training strategies that can lead to success in these races.
Keywords: anaerobic power reserve; cross-country skiing; cycling; extreme intensity domain; mountain biking; sprints; surges; triathlon.
Conflict of interest statement
The authors declare no conflicts of interest.
Figures
Similar articles
-
Creatine supplementation and endurance performance: surges and sprints to win the race.J Int Soc Sports Nutr. 2023 Dec;20(1):2204071. doi: 10.1080/15502783.2023.2204071. J Int Soc Sports Nutr. 2023. PMID: 37096381 Free PMC article. Review.
-
Energy system contribution during competitive cross-country skiing.Eur J Appl Physiol. 2019 Aug;119(8):1675-1690. doi: 10.1007/s00421-019-04158-x. Epub 2019 May 10. Eur J Appl Physiol. 2019. PMID: 31076890 Free PMC article. Review.
-
Changes in pacing variation with increasing race duration in ultra-triathlon races.Sci Rep. 2023 Mar 6;13(1):3692. doi: 10.1038/s41598-023-30932-1. Sci Rep. 2023. PMID: 36878948 Free PMC article.
-
Power Output and Pacing During International Cross-Country Mountain Bike Cycling.Int J Sports Physiol Perform. 2018 Oct 1;13(9):1243-1249. doi: 10.1123/ijspp.2017-0516. Epub 2018 Oct 26. Int J Sports Physiol Perform. 2018. PMID: 29688109
-
Distribution of power output when establishing a breakaway in cycling.Int J Sports Physiol Perform. 2013 Jul;8(4):452-5. doi: 10.1123/ijspp.8.4.452. Epub 2013 Mar 22. Int J Sports Physiol Perform. 2013. PMID: 23539668
References
Publication types
Grants and funding
LinkOut - more resources
Full Text Sources
