

Ultrasonography of Testicular Maturation and Correlation with Body Growth and Semen Evaluation in Beagle Dog Model
- PMID: 38922017
- PMCID: PMC11209051
- DOI: 10.3390/vetsci11060270
Ultrasonography of Testicular Maturation and Correlation with Body Growth and Semen Evaluation in Beagle Dog Model
Abstract
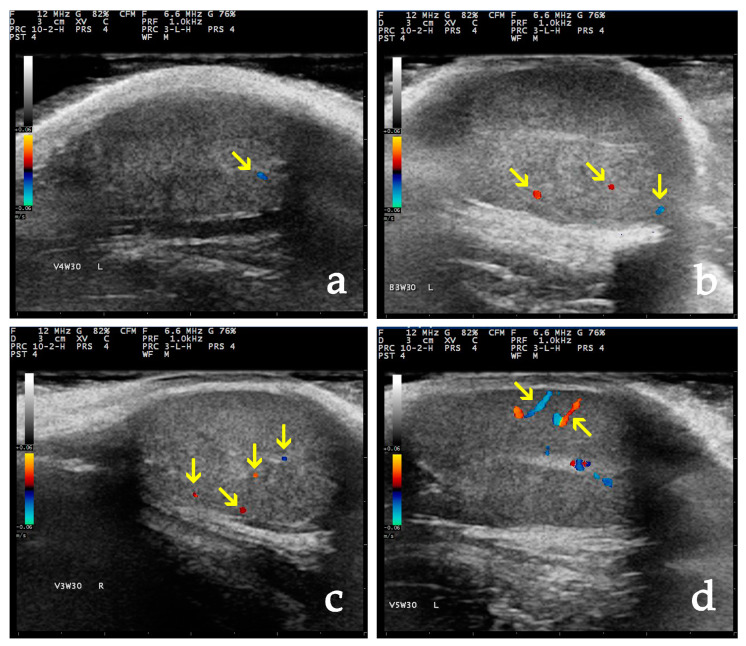
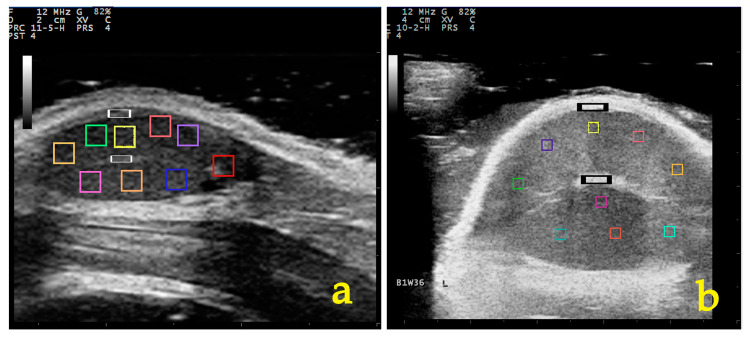
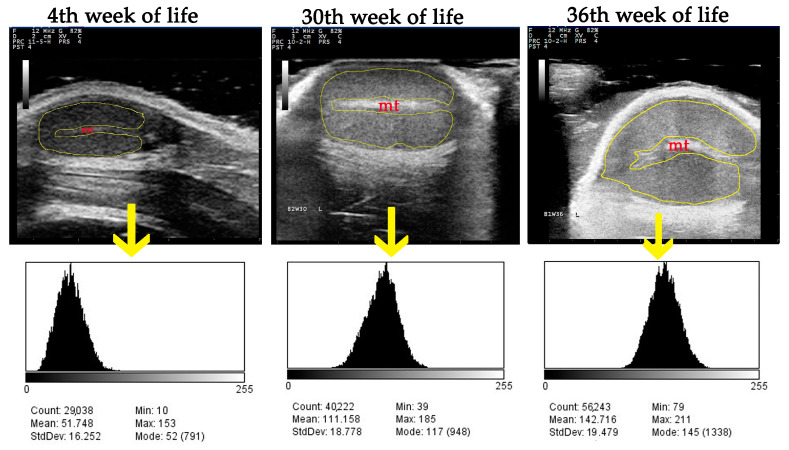
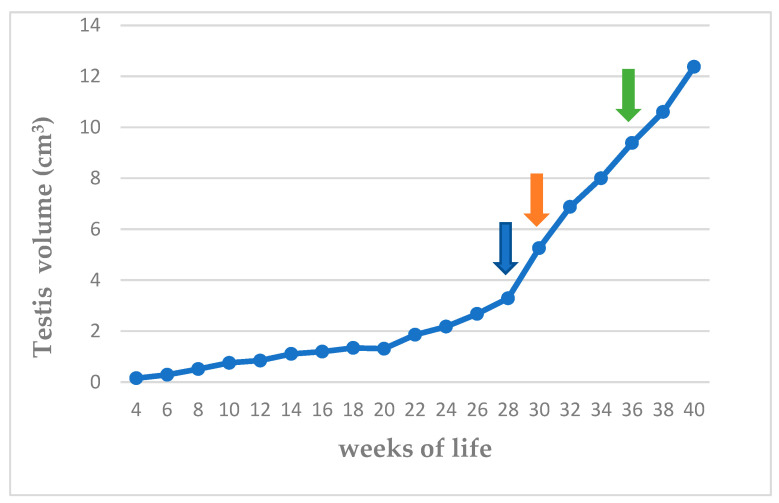
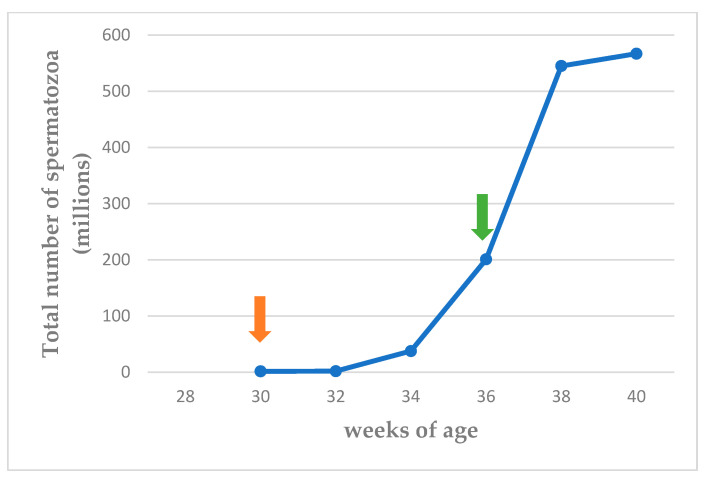
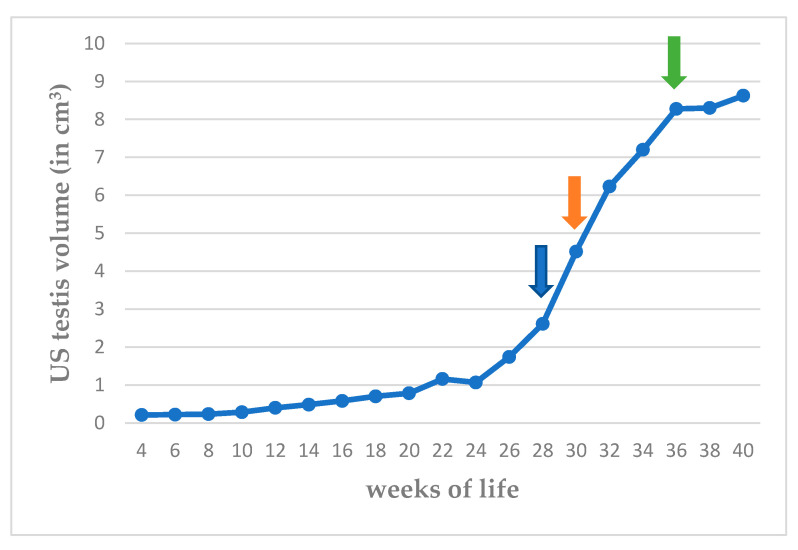
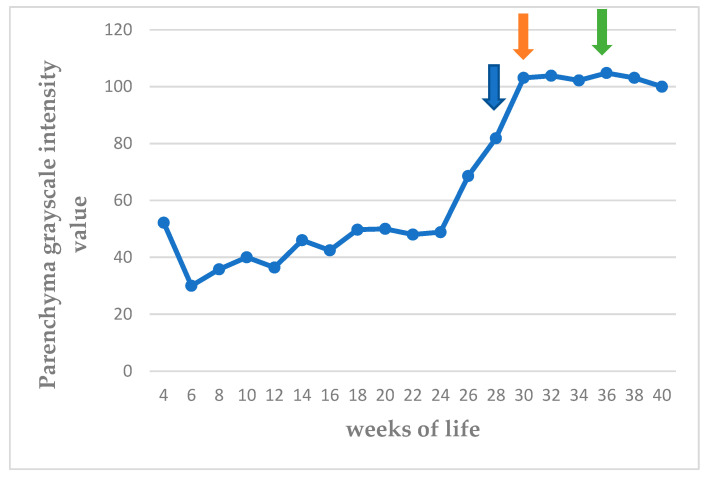
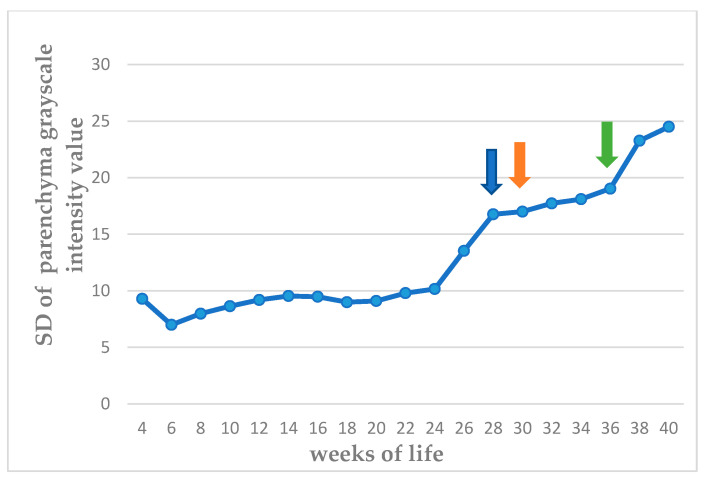
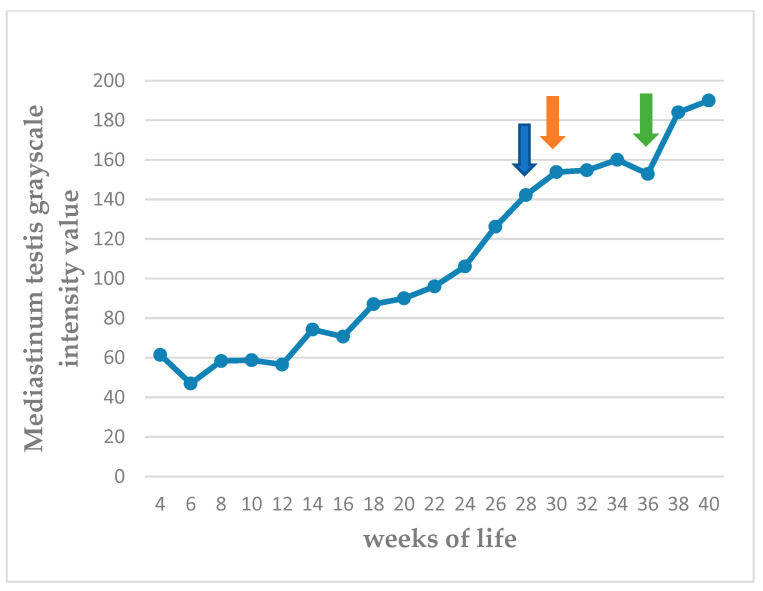
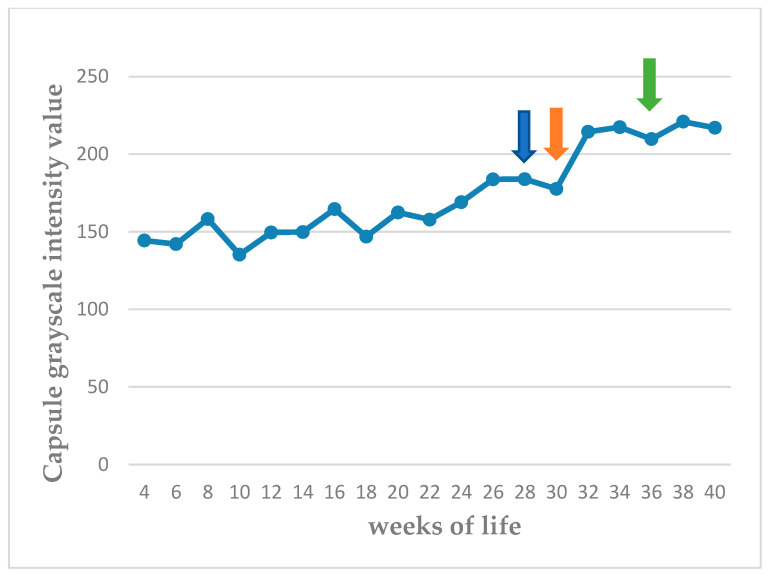
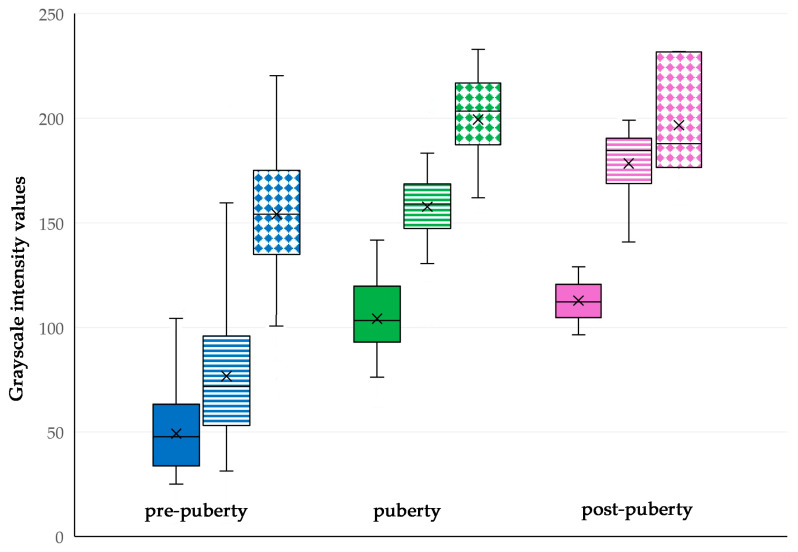
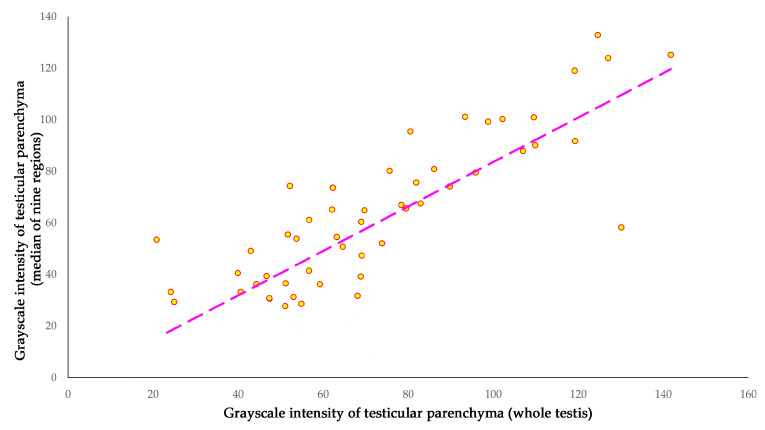
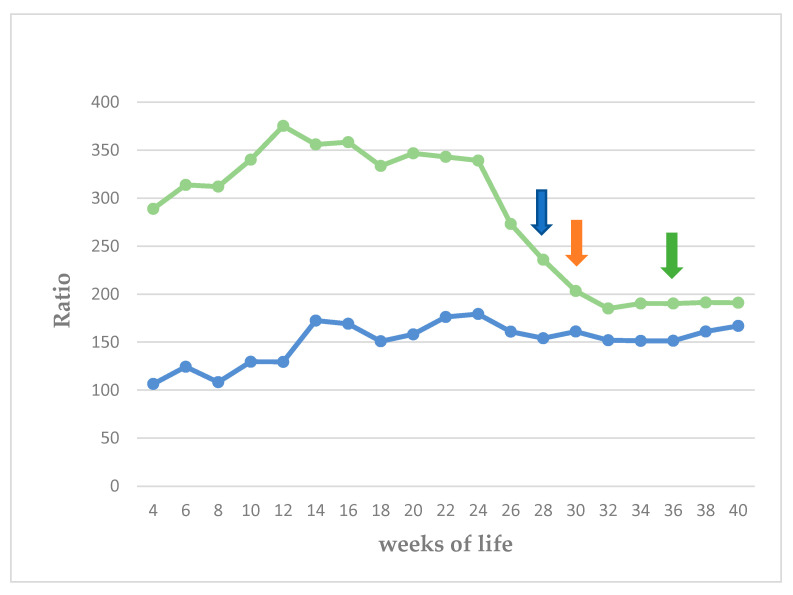
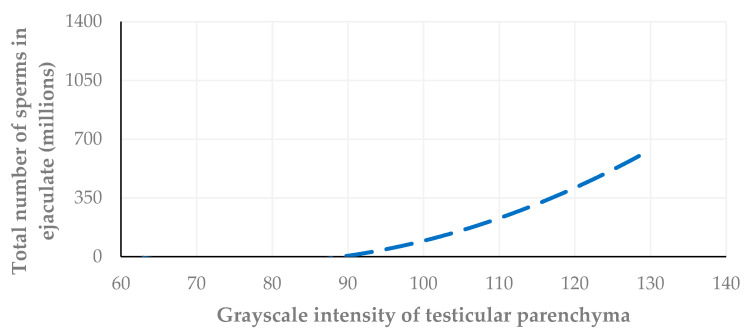
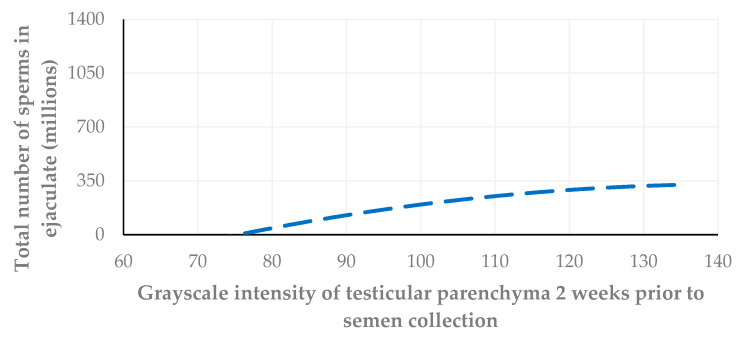
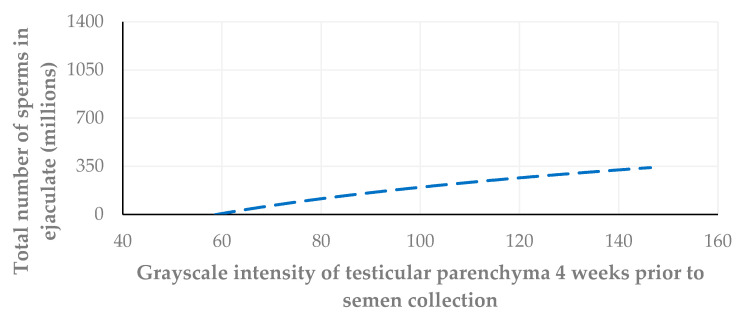
This prospective study investigated the ultrasonographic appearance of the canine testis from birth to adulthood. Eight purpose-bred laboratory Beagle-breed dogs were monitored from 4 to 40 weeks of life. The following parameters were evaluated every two weeks: bodyweight and height, scrotal and testicular volume, ultrasonographically measured testicular volume, echogenicity, heterogeneity, blood-flow score, ratio of the grayscale intensity value of the testis to the capsule, ejaculate volume, motility, viability, and number of spermatozoa. A correlation analysis was carried out between the various measurements obtained. Fertility was achieved in the 36th week of life. The echogenicity of the testicular parenchyma increased with age, and subsequently to the 30th week of life remained constant. The heterogeneity of the testicular parenchyma, as was evaluated by the standard deviation of the values of grayscale intensity of the parenchyma, also increased with age and was >19 at the onset of fertility. The ratio of grayscale intensity of testicular parenchyma had values < 200 at maturity. A colour Doppler evaluation first detected blood flow in the testis in the 22nd week. After the 32nd week, distinct signals were visible. In the 36th week, >80% of the testes imaged had visible vessels. A significant correlation was found between all the evaluation methods. The findings of the study may help clinicians detect the onset of fertility in dogs, especially when semen evaluation is not feasible; however, their applicability in all breeds or individuals might possibly vary due to genetic, physiological, and developmental differences. In summary, the study ultrasonographically explores the testicular maturity in dogs, with the aim to improve clinical assessments and health management in these animals.
Keywords: colour Doppler; dog; echogenicity; grayscale intensity; heterogeneity; maturity; puberty; semen; testis; ultrasound.
Conflict of interest statement
The authors declare no conflicts of interest.
Figures
Similar articles
-
Doppler Examination of the Testicular Artery of Beagle-Breed Dogs from Birth to Puberty.Tomography. 2023 Jul 23;9(4):1408-1422. doi: 10.3390/tomography9040112. Tomography. 2023. PMID: 37489480 Free PMC article.
-
Canine reproductive ultrasound examination for predicting future sperm quality.Reprod Domest Anim. 2017 Apr;52 Suppl 2:202-207. doi: 10.1111/rda.12825. Epub 2016 Nov 3. Reprod Domest Anim. 2017. PMID: 27807899
-
Digital image analysis of testicular and prostatic ultrasonographic echogencity and heterogeneity in dogs and the relation to semen quality.Anim Reprod Sci. 2015 Sep;160:112-9. doi: 10.1016/j.anireprosci.2015.07.012. Epub 2015 Aug 5. Anim Reprod Sci. 2015. PMID: 26282522
-
Ultrasonography for monitoring reproductive function in the bull.Reprod Domest Anim. 2012 Jun;47 Suppl 3:45-51. doi: 10.1111/j.1439-0531.2012.02042.x. Reprod Domest Anim. 2012. PMID: 22681298 Review.
-
Review: Testicular vascular cone development and its association with scrotal thermoregulation, semen quality and sperm production in bulls.Animal. 2018 Jun;12(s1):s133-s141. doi: 10.1017/S1751731118001167. Animal. 2018. PMID: 29882506 Review.
References
-
- Evans H.E., De Lahunta A., Miller M.E. Miller’s Anatomy of the Dog. 4th ed. Elsevier Saunders; St. Louis, MO, USA: 2013.
-
- Moxon R., Bright L., Pritchard B., Bowen I.M., de Souza M.B., da Silva L.D., England G.C. Digital image analysis of testicular and prostatic ultrasonographic echogencity and heterogeneity in dogs and the relation to semen quality. Anim. Reprod. Sci. 2015;160:112–119. doi: 10.1016/j.anireprosci.2015.07.012. - DOI - PubMed
LinkOut - more resources
Full Text Sources
