

A Perspective of the Epidemiology of Rabies in South Africa, 1998-2019
- PMID: 38922034
- PMCID: PMC11209162
- DOI: 10.3390/tropicalmed9060122
A Perspective of the Epidemiology of Rabies in South Africa, 1998-2019
Abstract
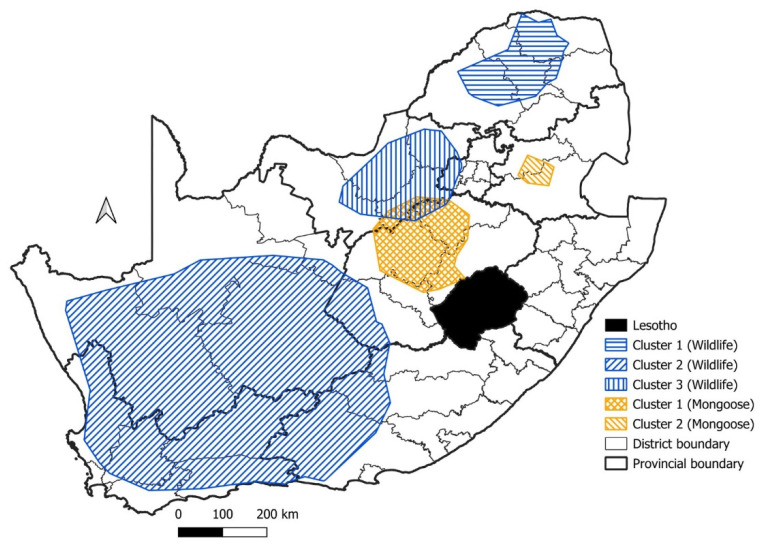
Despite the implementation of various control strategies aimed at eliminating canine-mediated rabies, the disease is still endemic in up to 150 countries across the world. Rabies remains endemic to South Africa, with various reservoir species (both wildlife species and domestic dogs) capable of maintaining rabies infection, and the epidemiology of the disease is yet to be adequately defined. As such, this study used surveillance data collected between 1998 and 2019 from the two diagnostic laboratories in the country for a statistical space-time analysis to determine regions where significant disease clusters could occur. In addition, the robustness of surveillance activities across the country was evaluated through the mathematical evaluation and visualization of testing rates based on the average number of samples tested per species group. In our study, various significant disease clusters were detected for domestic animals, wildlife and livestock. The significant disease clusters for domestic animals and livestock were primarily restricted to eastern South Africa, while the significant disease clusters in wildlife species were detected across northern and western South Africa. Furthermore, the testing rates identified districts from various provinces where surveillance activities could be considered inadequate, consequently influencing the geographical range of the observed clusters. These results could be used to direct intervention campaigns towards high-risk areas, while also allocating the required resources to improve surveillance in the surrounding areas where surveillance was deemed inadequate.
Keywords: South Africa; epidemiology; rabies burden; spatio-temporal analysis; surveillance.
Conflict of interest statement
The authors declare no conflict of interest.
Figures


Similar articles
-
Patterns of rabies cases in South Africa between 1993 and 2019, including the role of wildlife.Transbound Emerg Dis. 2022 Mar;69(2):836-848. doi: 10.1111/tbed.14080. Epub 2021 Apr 27. Transbound Emerg Dis. 2022. PMID: 33738979
-
Spatio-temporal epidemiology of animal and human rabies in northern South Africa between 1998 and 2017.PLoS Negl Trop Dis. 2022 Jul 29;16(7):e0010464. doi: 10.1371/journal.pntd.0010464. eCollection 2022 Jul. PLoS Negl Trop Dis. 2022. PMID: 35905140 Free PMC article.
-
Epidemiological Interface of Sylvatic and Dog Rabies in the North West Province of South Africa.Trop Med Infect Dis. 2022 Jun 5;7(6):90. doi: 10.3390/tropicalmed7060090. Trop Med Infect Dis. 2022. PMID: 35736969 Free PMC article.
-
Dog rabies control in West and Central Africa: A review.Acta Trop. 2021 Dec;224:105459. doi: 10.1016/j.actatropica.2020.105459. Epub 2020 May 11. Acta Trop. 2021. PMID: 32404295 Review.
-
Control and prevention of rabies in animals: paradigm shifts.Dev Biol (Basel). 2006;125:103-11. Dev Biol (Basel). 2006. PMID: 16878466 Review.
Cited by
-
Temporal and Spatial Analysis of Rabies Virus Lineages in South Africa.Viruses. 2025 Feb 28;17(3):340. doi: 10.3390/v17030340. Viruses. 2025. PMID: 40143269 Free PMC article.
References
-
- Baer G.M. In: 1—The History of Rabies. 2nd ed. Jackson A.C., Wunner W.H.B.T.-R., editors. Academic Press; Oxford, UK: 2007. pp. 1–22.
-
- WHO . WHO Expert Consultation on Rabies: Third Report. World Health Organization; Geneva, Switzerland: 2018. (WHO Technical Report Series). 1012.
-
- Zinsstag J., Lechenne M., Laager M., Mindekem R., Naïssengar S., Oussiguéré A., Bidjeh K., Rives G., Tessier J., Madjaninan S., et al. Vaccination of Dogs in an African City Interrupts Rabies Transmission and Reduces Human Exposure. Sci. Transl. Med. 2017;9:eaaf6984. doi: 10.1126/scitranslmed.aaf6984. - DOI - PubMed
Grants and funding
LinkOut - more resources
Full Text Sources
Research Materials
