

A prospective clinical study of the influence of oral protein intake on [18F]FET-PET uptake and test-retest repeatability in glioma
- PMID: 38922458
- PMCID: PMC11208353
- DOI: 10.1186/s13550-024-01119-0
A prospective clinical study of the influence of oral protein intake on [18F]FET-PET uptake and test-retest repeatability in glioma
Abstract
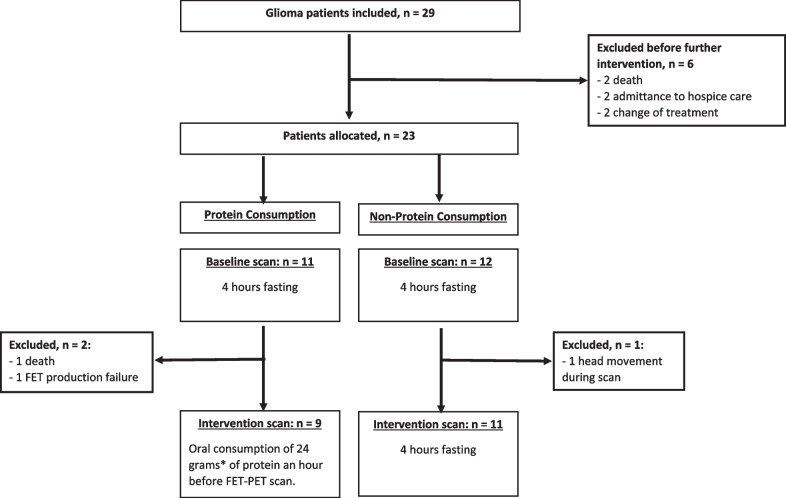
Background: O-(2-[18F]fluoroethyl)-L-tyrosine positron emission tomography ([18F]FET PET) scanning is used in routine clinical management and evaluation of gliomas with a recommended 4 h prior fasting. Knowledge of test-retest variation of [18F]FET PET imaging uptake metrics and the impact of accidental protein intake can be critical for interpretation. The aim of this study was to investigate the repeatability of [18F]FET-PET metrics and to assess the impact of protein-intake prior to [18F]FET PET scanning of gliomas.
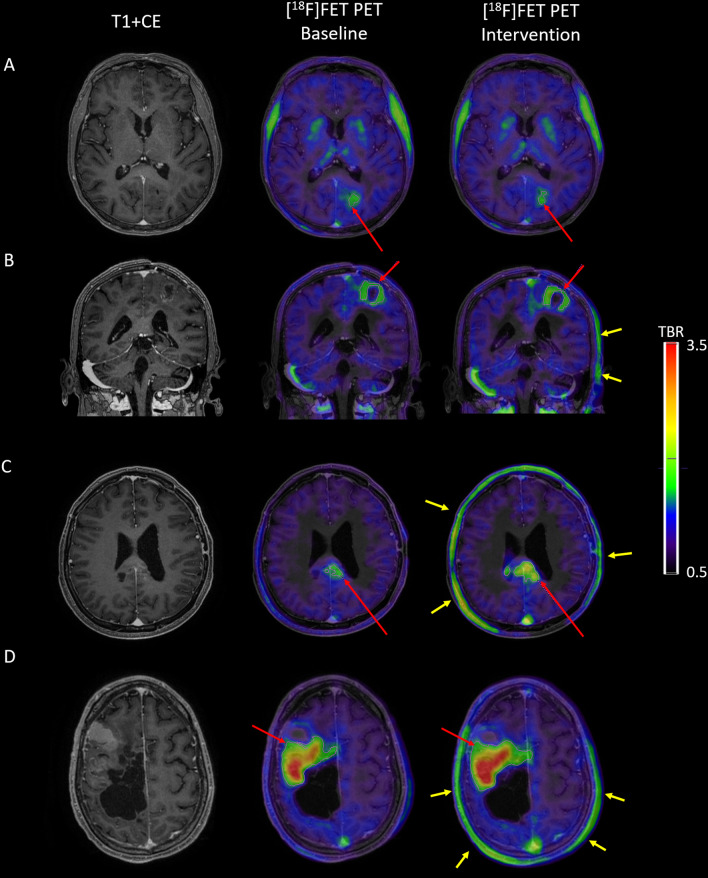
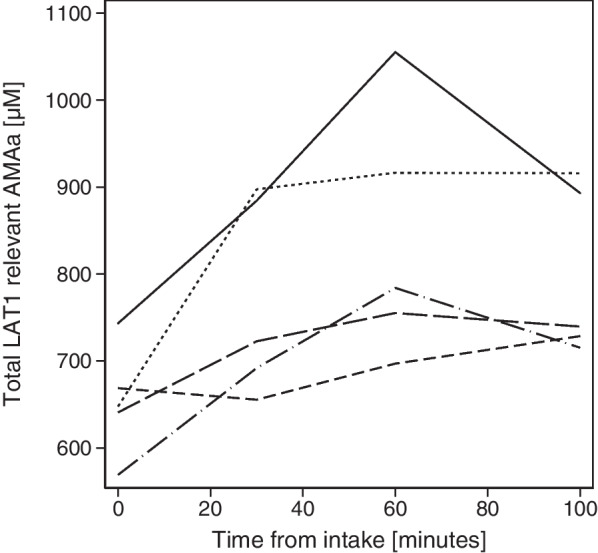
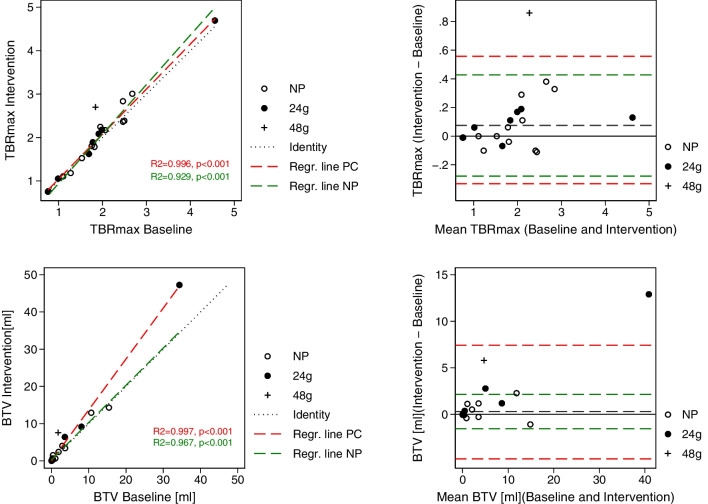
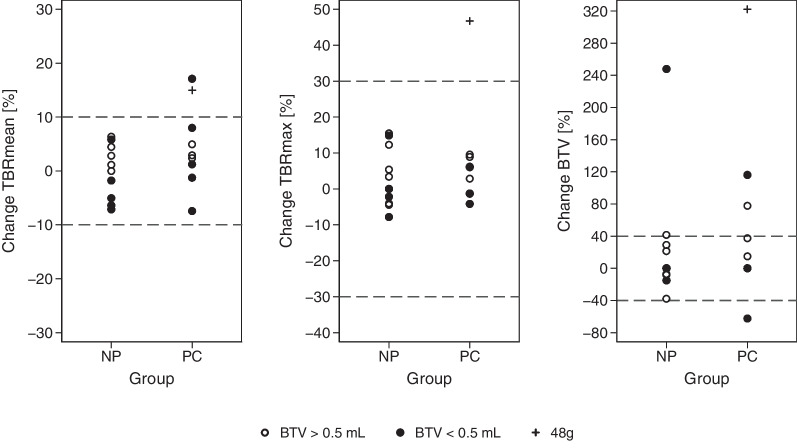
Results: Test-retest variability in the non-protein group was good with absolute (and relative) upper and lower limits of agreement of + 0.15 and - 0.13 (+ 9.7% and - 9.0%) for mean tumour-to-background ratio (TBRmean), + 0.43 and - 0.28 (+ 19.6% and - 11.8%) for maximal tumour-to-background ratio (TBRmax), and + 2.14 cm3 and - 1.53 ml (+ 219.8% and - 57.3%) for biological tumour volume (BTV). Variation was lower for uptake ratios than for BTV. Protein intake was associated with a 27% increase in the total sum of plasma concentration of the L-type amino acid transporter 1 (LAT1) relevant amino acids and with decreased standardized uptake value (SUV) in both healthy appearing background brain tissue (mean SUV - 25%) and in tumour (maximal SUV - 14%). Oral intake of 24 g of protein 1 h prior to injection of tracer tended to increase variability, but the effects on derived tumour metrics TBRmean and TBRmax were only borderline significant, and changes generally within the variability observed in the group with no protein intake.
Conclusion: The test-retest repeatability was found to be good, and better for TBRmax and TBRmean than BTV, with the methodological limitation that tumour growth may have influenced results. Oral intake of 24 g of protein one hour before a [18F]FET PET scan decreases uptake of [18F]FET in both tumour and in healthy appearing brain, with no clinically significant difference on the most commonly used tumour metrics.
Keywords: Amino acid positron emission tomography; Brain tumour; Glioma; Neuro-oncology; Test–retest.
© 2024. The Author(s).
Conflict of interest statement
The authors declare that they have no competing interests.
Figures
Similar articles
-
Repeatability of Quantitative 18F-FET PET in Glioblastoma.Biomed Phys Eng Express. 2021 Apr 30;7(3). doi: 10.1088/2057-1976/abfae9. Biomed Phys Eng Express. 2021. PMID: 33887712
-
Influence of Dexamethasone on O-(2-[18F]-Fluoroethyl)-L-Tyrosine Uptake in the Human Brain and Quantification of Tumor Uptake.Mol Imaging Biol. 2019 Feb;21(1):168-174. doi: 10.1007/s11307-018-1221-z. Mol Imaging Biol. 2019. PMID: 29845426
-
Delineation and agreement of FET PET biological volumes in glioblastoma: results of the nuclear medicine credentialing program from the prospective, multi-centre trial evaluating FET PET In Glioblastoma (FIG) study-TROG 18.06.Eur J Nucl Med Mol Imaging. 2023 Nov;50(13):3970-3981. doi: 10.1007/s00259-023-06371-5. Epub 2023 Aug 11. Eur J Nucl Med Mol Imaging. 2023. PMID: 37563351 Free PMC article.
-
18F-FET PET Uptake Characteristics in Patients with Newly Diagnosed and Untreated Brain Metastasis.J Nucl Med. 2017 Apr;58(4):584-589. doi: 10.2967/jnumed.116.180075. Epub 2016 Oct 6. J Nucl Med. 2017. PMID: 27754904
-
Imaging of amino acid transport in brain tumours: Positron emission tomography with O-(2-[18F]fluoroethyl)-L-tyrosine (FET).Methods. 2017 Nov 1;130:124-134. doi: 10.1016/j.ymeth.2017.05.019. Epub 2017 May 24. Methods. 2017. PMID: 28552264 Review.
Cited by
-
Magnetic resonance imaging and o-(2-[18F]fluoroethyl)-l-tyrosine positron emission tomography for early response assessment of nivolumab and bevacizumab in patients with recurrent high-grade astrocytic glioma.Neurooncol Adv. 2024 Oct 24;6(1):vdae178. doi: 10.1093/noajnl/vdae178. eCollection 2024 Jan-Dec. Neurooncol Adv. 2024. PMID: 39659835 Free PMC article.
-
Influence of oral protein intake on [18F]FET uptake in brain tumours.EJNMMI Res. 2025 Aug 20;15(1):109. doi: 10.1186/s13550-025-01304-9. EJNMMI Res. 2025. PMID: 40836171 Free PMC article. No abstract available.
References
-
- Albert NL, Weller M, Suchorska B, Galldiks N, Soffietti R, Kim MM, et al. Response assessment in neuro-oncology working group and European association for neuro-oncology recommendations for the clinical use of PET imaging in gliomas. Neuro Oncol. 2016;18:1199–1208. doi: 10.1093/neuonc/now058. - DOI - PMC - PubMed
LinkOut - more resources
Full Text Sources
Research Materials
