. 2024 Nov 1;14(11):2279-2299.
doi: 10.1158/2159-8290.CD-23-1212.

The N6-methyladenosine Epitranscriptomic Landscape of Lung Adenocarcinoma

Affiliations

The N6-methyladenosine Epitranscriptomic Landscape of Lung Adenocarcinoma

Shiyan Wang et al. Cancer Discov. .

Abstract

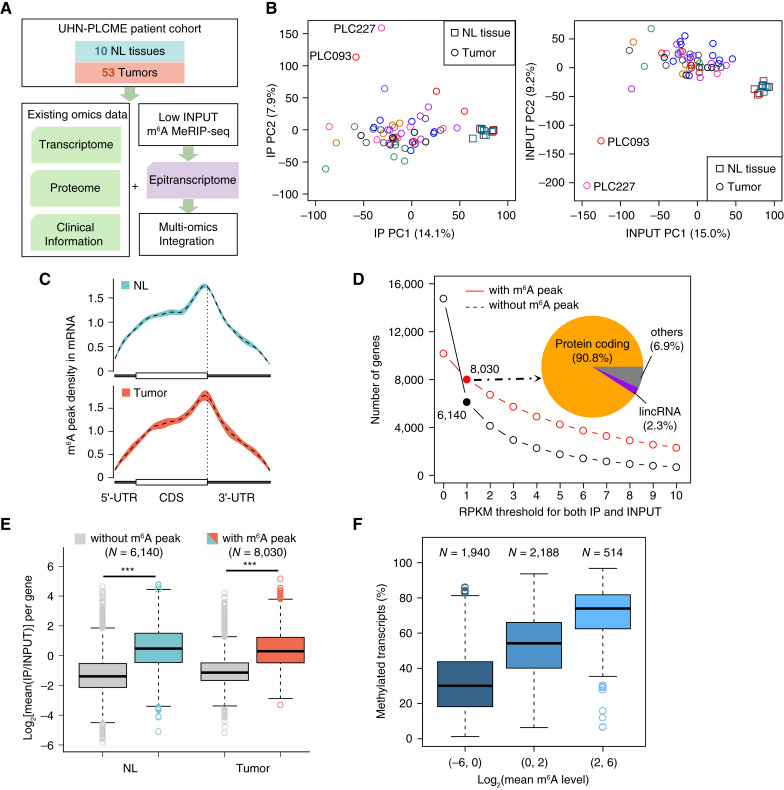
Comprehensive N6-methyladenosine (m6A) epitranscriptomic profiling of primary tumors remains largely uncharted. Here, we profiled the m6A epitranscriptome of 10 nonneoplastic lung tissues and 51 lung adenocarcinoma (LUAD) tumors, integrating the corresponding transcriptomic, proteomic, and extensive clinical annotations. We identified distinct clusters and genes that were exclusively linked to disease progression through m6A modifications. In comparison with nonneoplastic lung tissues, we identified 430 transcripts to be hypo-methylated and 222 to be hyper-methylated in tumors. Among these genes, EML4 emerged as a novel metastatic driver, displaying significant hypermethylation in tumors. m6A modification promoted the translation of EML4, leading to its widespread overexpression in primary tumors. Functionally, EML4 modulated cytoskeleton dynamics by interacting with ARPC1A, enhancing lamellipodia formation, cellular motility, local invasion, and metastasis. Clinically, high EML4 protein abundance correlated with features of metastasis. METTL3 small-molecule inhibitor markedly diminished both EML4 m6A and protein abundance and efficiently suppressed lung metastases in vivo. Significance: Our study reveals a dynamic and functional epitranscriptomic landscape in LUAD, offering a valuable resource for further research in the field. We identified EML4 hypermethylation as a key driver of tumor metastasis, highlighting a novel therapeutic strategy of targeting EML4 to prevent LUAD metastasis.


Conflict of interest statement

No disclosures were reported.

Figures

Figure 1.
Figure 1.
m6A epitranscriptomic profiling in nonneoplastic lung (NL) and lung adenocarcinoma (LUAD) tissues. A, Overview of m6A epitranscriptomic profiling and multiomics data integration in NL and LUAD tissues. B, Principal component analysis plots of m6A MeRIP-seq IP (left) and INPUT (right) libraries in NL and tumor samples postnormalization. The colors denote different experimental batches. C, Density distribution of m6A peaks across the 5′-UTR, CDS, and 3′-UTR regions of mRNA transcripts. The dashed line indicates the mean density, and the shaded area indicates SD. D, Count of methylated and unmethylated genes at indicated abundance levels in the IP and INPUT libraries. The inserted pie chart illustrates the gene-type proportions for the 8,030 methylated genes, of which IP and INPUT Reads Per Kilobase Million (RPKM) were more than 1 in at least half of NL or tumor samples. E, Whole-transcript m6A IP/INPUT ratios for genes with and without m6A peaks in NL and tumor samples (one-sided Z-test: both P < 2.2 × 10⁻¹⁶). F, Correlation between m6A percentages as measured by m6A-LAIC-seq in H1-hESC cells and log2(mean m6A level) derived from m6A MeRIP-seq in lung samples. Methylated genes with log2(mean m6A level) in the same range in both NL and tumor samples were included for the analysis.
Figure 2.
Figure 2.
Categorization of methylated genes based on their correlations between m6A levels and m6A regulator abundances. A, Heatmap illustrating the correlations between m6A levels of methylated genes and the mRNA abundances of m6A regulators. Hierarchical clustering identified three gene groups: G1, G2, and G3. The name of m6A regulators is indicated at the bottom of each column. The types of m6A regulators (writers and erasers) are indicated at the top of each column. The color in the heatmap indicates the correlation for each methylated gene across tumor samples: red denotes positive correlation; blue denotes negative correlation. B, Percentages of genes bound by the corresponding m6A regulators in G1, G2, and G3 gene groups in A549 cells characterized by RIP-seq. C, Mean of m6A levels (left) and RNA abundances (RPKM; right) of the genes in G1, G2, and G3 groups. D, Density distribution of m6A peaks across the 5′-UTR, CDS, and 3′-UTR regions of the genes in G1, G2, and G3 groups (Kolmogorov–Smirnov test). E, Comparisons of the number of the exons (left, Wilcoxon rank-sum one-sided test: G1 vs. G2: P < 2.2 × 10⁻¹⁶; G2 vs. G3: P = 3.45 × 10⁻¹⁴; G1 vs. G3: P < 2.2 × 10⁻¹⁶) and the length of the last CDS (right, Wilcoxon rank-sum one-sided test: G1 vs. G2: P < 2.2 × 10⁻¹⁶; G2 vs. G3: P = 5.22 × 10⁻⁴; G1 vs. G3: P < 2.2 × 10⁻¹⁶) among the G1, G2, and G3 groups. F, m6A signals and gene structures of representative genes in each group. G, Top two enriched Kyoto Encyclopedia of Genes and Genomes pathways in each group. Compared with the indicated group, **, P < 0.01; ***, P < 0.001; n.s., not significant.
Figure 3.
Figure 3.
m6A epitranscriptome-based LUAD subtyping. A, Consensus clustering using m6A levels from the top 20% of methylated genes by IQR ranking in tumors identified five patient subtypes, labeled P1 through P5. Clinical variables for each patient are depicted in the covariate bar to the right. B, Mean values of Z-transformed m6A levels from the top 20% methylated genes by IQR ranking are shown for each m6A level-derived patient group (Wilcoxon rank-sum two-sided test). C, Comparison of overall survival between the P2 group and the rest of the cohort. D, A volcano plot illustrates the statistical significance against the magnitude of changes in RNA abundances between the P2 group and the rest of the cohort. FC, fold change; FDR, false discovery rate. The differentially expressed genes (DEG) are labeled with darker colors. E, Top enriched GO/BP terms for the downregulated genes in the P2 group. Compared with the indicated group, ***, P < 0.001.
Figure 4.
Figure 4.
BLVRA m6A level is independently associated with patient survival outcome. A, Analysis of the associations between overall survival and genes’ m6A, mRNA, and protein levels. The P values from log-rank tests were plotted to illustrate these associations. B, Kaplan–Meier survival curves showing overall survival stratified by BLVRA m6A, mRNA, and protein levels in the UHN-PLCME cohort. The P values from log-rank tests are indicated at the bottom left side. C, Correlation between BLVRA m6A levels with its mRNA (left) and protein abundances (right) in the UHN-PLCME cohort. D, Correlation between BLVRA m6A levels and its m6A peak intensities (peak region IP/INPUT ratio). E, m6A IP and INPUT MeRIP-seq signals of three tumor samples representing low, medium, and high m6A levels in the UHN-PLCME cohort. The predicted motif close to the peak summit is indicated at the bottom. F, SELECT-based quantification of m6A levels at the predicted A site within the motif for the three tumor samples (Student t test). G, Kaplan–Meier survival curves showing overall survival rates stratified by the m6A levels at the A site as determined by SELECT (left) and BLVRA mRNA abundances as measured by microarray (right) in the validation cohort. H, Correlation between BLVRA m6A and mRNA levels in the validation cohort. All histogram data are presented as mean ± SD. Compared with the indicated group, ****, P < 0.0001.
Figure 5.
Figure 5.
EML4 upregulation through m6A hypermethylation in LUAD. A, Number of m6A peaks identified in NL and tumor samples (left) and intragroup pair-wise comparison of the overlapping percentage of m6A peaks (right). Peaks are considered overlapping if they share at least one nucleotide. B, Diagram illustrating the distribution of NL-specific, tumor-specific, and common peaks. C, Mean and coefficient of variation of m6A levels in NL and tumor samples. D, Volcano plot of statistical significance and changes of RNA abundances for hypo- and hyper-methylated genes. FC, fold change; FDR, false discovery rate. The DEGs are labeled with darker colors. E, Heatmap of hypo- and hyper-methylated genes. The color represents the Z score of m6A level in each sample. Sample types are indicated on top of the heatmap. Light blue, NL; coral, tumor. F, The statistical significance of m6A level difference was plotted against log2 transformed fold change of m6A level between tumor and NL samples for the 447 DMGs without significant changes at the RNA level. Red denotes hyper-methylated genes; blue denotes hypo-methylated genes. FC, fold change. G, m6A IP and INPUT MeRIP-seq signals near the stop codon of EML4 in representative NL and tumor samples in the UHN-PLCME cohort. The predicted motif nearest to the peak summit is indicated at the bottom. H, Mean of EML4 m6A peak intensities (peak region IP/INPUT ratio) in NL and tumor samples. I,EML4 mRNA levels (left, Student t test), EML4 m6A levels (middle left, peak level and middle right, single A site level; Student t test), METTL3 and EML4 protein levels (middle right), and EML4 translation efficiency (right, Student t test) upon METTL3 knockdown in A549 cells transfected with the indicated siRNAs. Forty-eight hours after siRNA transfection, cells were harvested for analysis. For EML4 m6A analysis, EML4 m6A levels around the peak region and at the “A” site within the predicted motif nearest to the peak summit were determined by m6A MeRIP qPCR and SELECT analysis in METTL3-knockdown and control A549 cells, respectively. TE, translation efficiency. J,EML4 mRNA levels (left), EML4 m6A levels at the “A” site within the predicted motif nearest to the peak summit (middle), and EML4 translation efficiency (right) in A549 cells transfected with dCas13b-ALKBH5 combined with control guide RNA (sgCtrl) or EML4-targeting guide RNA (sgEML4) plasmids for 48 hours (Student t test). TE, translation efficiency. K, Western blot analysis (top) and quantification of EML4 protein levels (bottom) in A549 cells transfected with dCas13b-ALKBH5 combined with sgCtrl or sgEML4 plasmids for 48 hours. The protein levels of EML4 were normalized to β-ACTIN. L,EML4 mRNA (left) and protein (right) abundances in 99 paired tumors and adjacent normal tissues in the CPTAC LUAD cohort. M, Representative images of EML4 protein expression in LUAD tumor and adjacent normal tissues by IHC (left). Protein levels of EML4 in 55 matched LUAD tumors and adjacent normal tissues assessed by IHC score (right). All histogram data are presented as mean ± SD. Compared with the indicated group, **, P < 0.01; ***, P < 0.001; ****, P < 0.0001; n.s., not significant.
Figure 6.
Figure 6.
EML4 promotes NSCLC cell migration and invasion in vitro and metastasis in vivo. A, Western blot analysis of EML4 protein expression in EML4-knockdown (left), EML4-overexpressing (middle), and KO (right) cells. For EML4-knockdown assay, 48 hours post siRNA transfection, A549 and H358 cells were harvested for analysis. B, Cell migration (left) and invasion (right) abilities of EML4-knockdown and control A549 and H358 cells. C, Cell migration abilities of EML4 KO and wild-type (WT) A549 and H358 cells. D, Cell migration abilities and migration rates of EML4-overexpressing and control A549 and H358 cells. E, Western blot analysis of EML4 protein expression upon shRNA-mediated EML4 knockdown in A549 and H358 cells. F, Impact of EML4 knockdown on lung metastasis in a tail vein metastasis model. Representative images of the formalin-fixed NOD/SCID mouse lungs (left) and hematoxylin and eosin (H&E) staining of lung tissues (middle) approximately 8 weeks after tail vein injection of 1 × 10⁶EML4-knockdown and control A549 and H358 cells. Quantification of the proportions of tumor metastases in mouse lungs based on H&E staining (right). G, Survival of NOD/SCID gamma (NSG) mice bearing EML4-knockdown and control H358 lung metastases (log-rank test). H,EML4 overexpression enhanced lung metastasis in a tail vein metastasis model. Representative images of the formalin-fixed NOD/SCID mouse lungs (left) and H&E staining of lung tissues (top middle) approximately 8 weeks after tail vein injection of 1 × 10⁶EML4-overexpressing and control H358 cells. Quantification of the proportions of tumor metastases in mouse lungs based on H&E staining (right). Representative IHC staining of EML4 (bottom middle) and quantification of EML4 protein expression (right) by IHC score in EML4-overexpressing and control lung metastases. I, F-actin staining in EML4 KO, EML4-overexpressing, and the corresponding control A549 and H358 cells. Nuclei were visualized with 4',6-diamidino-2-phenylindole (DAPI). J, IF staining of EML4 and α-tubulin in EML4-overexpressing and control cells. Nuclei were visualized with DAPI. K, Top enriched CC terms in LUAD tumors with high EML4 protein expression vs. LUAD tumors with low EML4 protein expression from the CPTAC cohort (top 50% vs. bottom 50%; left) and in EML4-overexpressing vs. control H358 cells (right). L, Co-IP assays showing the interactions of EML4 with ARPC1A in Flag-tagged EML4-overexpressing NSCLC cells. M, IF staining of Flag (Flag-tagged EML4) and ARPC1A in Flag-tagged EML4-overexpressing cells. Nuclei were visualized with DAPI. N, IF staining of Flag and ARPC1A in Flag-tagged EML4-overexpressing and control cells (left). Nuclei were visualized with DAPI. Quantification of the percentages of cells with ARPC1A enriched at the edge of lamellipodia in EML4-overexpressing and control cells (right). Protein expression levels of EML4 and ARPC1A (O), F-actin staining (P), cell migration abilities (Q, left), and the relative lamellipodia lengths (Q, right) of EML4-overexpressing and control cells transfected with the indicated siRNAs. Forty-eight hours after siRNA transfection, cells were harvested for the above analysis. All histogram data are presented as mean ± SD. Compared with the indicated group, ***, P < 0.001; ****, P < 0.0001.
Figure 7.
Figure 7.
Targeting EML4 with METLL3 small-molecule inhibitor reduces metastasis in vivo. A, Representative IHC staining of EML4 in primary tumor and matched lymph node metastases from one LUAD patient (left). Protein levels of EML4 in 39 matched LUAD tumors and metastases by IHC score (right). B and C, Impact of METTL3 knockdown on lung metastasis in a tail vein metastasis model. Representative images of the NSG mouse lungs (B, top) and H&E staining of lung tissues (B, bottom) approximately 7 weeks after tail vein injection of 1 × 10⁶METTL3-knockdown and control A549 cells. Quantification of the proportions of tumor metastases in mouse lungs based on H&E staining (C, left). Quantification of METTL3 (C, middle) and EML4 protein expression (C, right) by IHC score in METTL3-knockdown and control lung metastases. D, Relative m6A levels near the stop codon of EML4 gene in A549 cells with the indicated treatment, determined by m6A MeRIP qPCR. E, Rescue assay of STM2457 treatment. Western blot analysis of EML4 protein expression in control and EML4-overexpressing A549 cells with the indicated treatment (E, left). Cell migration abilities of control and EML4-overexpressing A549 cells with the indicated treatment (E, right). F, Rescue assay of METTL3 knockdown. Western blot analysis of METTL3 and EML4 protein expression in control and EML4-overexpressing A549 cells transfected with the indicated siRNAs (F, left). Cell migration abilities of control and EML4-overexpressing A549 cells transfected with the indicated siRNAs (F, right). Forty-eight hours after siRNA transfection, cells were harvested for Western blot and migration analysis. G, Experimental design of STM2457 treatment in the lung metastasis model (top). Representative images of the formalin-fixed NOD/SCID mouse lungs harvested 60 days after treatment with STM2457 (bottom). H, Representative images of H&E staining of mouse lung tissues (left), quantification of the numbers of metastatic nodules in mouse lungs based on H&E staining (middle), and body weight of the mice (right) at the experimental endpoint in the lung metastasis model. All histogram data are presented as mean ± SD. Compared with the indicated group, **, P < 0.01; ****, P < 0.0001; n.s., not significant.

References

    1. Bray F, Ferlay J, Soerjomataram I, Siegel RL, Torre LA, Jemal A. Global cancer statistics 2018: GLOBOCAN estimates of incidence and mortality worldwide for 36 cancers in 185 countries. CA Cancer J Clin 2018;68:394–424. - PubMed
    1. Cancer Genome Atlas Research Network . Comprehensive molecular profiling of lung adenocarcinoma. Nature 2014;511:543–50. - PMC - PubMed
    1. Gillette MA, Satpathy S, Cao S, Dhanasekaran SM, Vasaikar SV, Krug K, et al. . Proteogenomic characterization reveals therapeutic vulnerabilities in lung adenocarcinoma. Cell 2020;182:200–25.e35. - PMC - PubMed
    1. Zhao BS, Roundtree IA, He C. Post-transcriptional gene regulation by mRNA modifications. Nat Rev Mol Cell Biol 2017;18:31–42. - PMC - PubMed
    1. Shi H, Wei J, He C. Where, when, and how: context-dependent functions of RNA methylation writers, readers, and erasers. Mol Cell 2019;74:640–50. - PMC - PubMed