. 2024 Nov;92(5):1913-1932.
doi: 10.1002/mrm.30182. Epub 2024 Jun 23.

Free-breathing, fat-corrected T1 mapping of the liver with stack-of-stars MRI, and joint estimation of T1, PDFF, R 2 * , and B 1 +

Affiliations

Free-breathing, fat-corrected T1 mapping of the liver with stack-of-stars MRI, and joint estimation of T1, PDFF, R 2 * , and B 1 +

Yavuz Muslu et al. Magn Reson Med. 2024 Nov.

Abstract

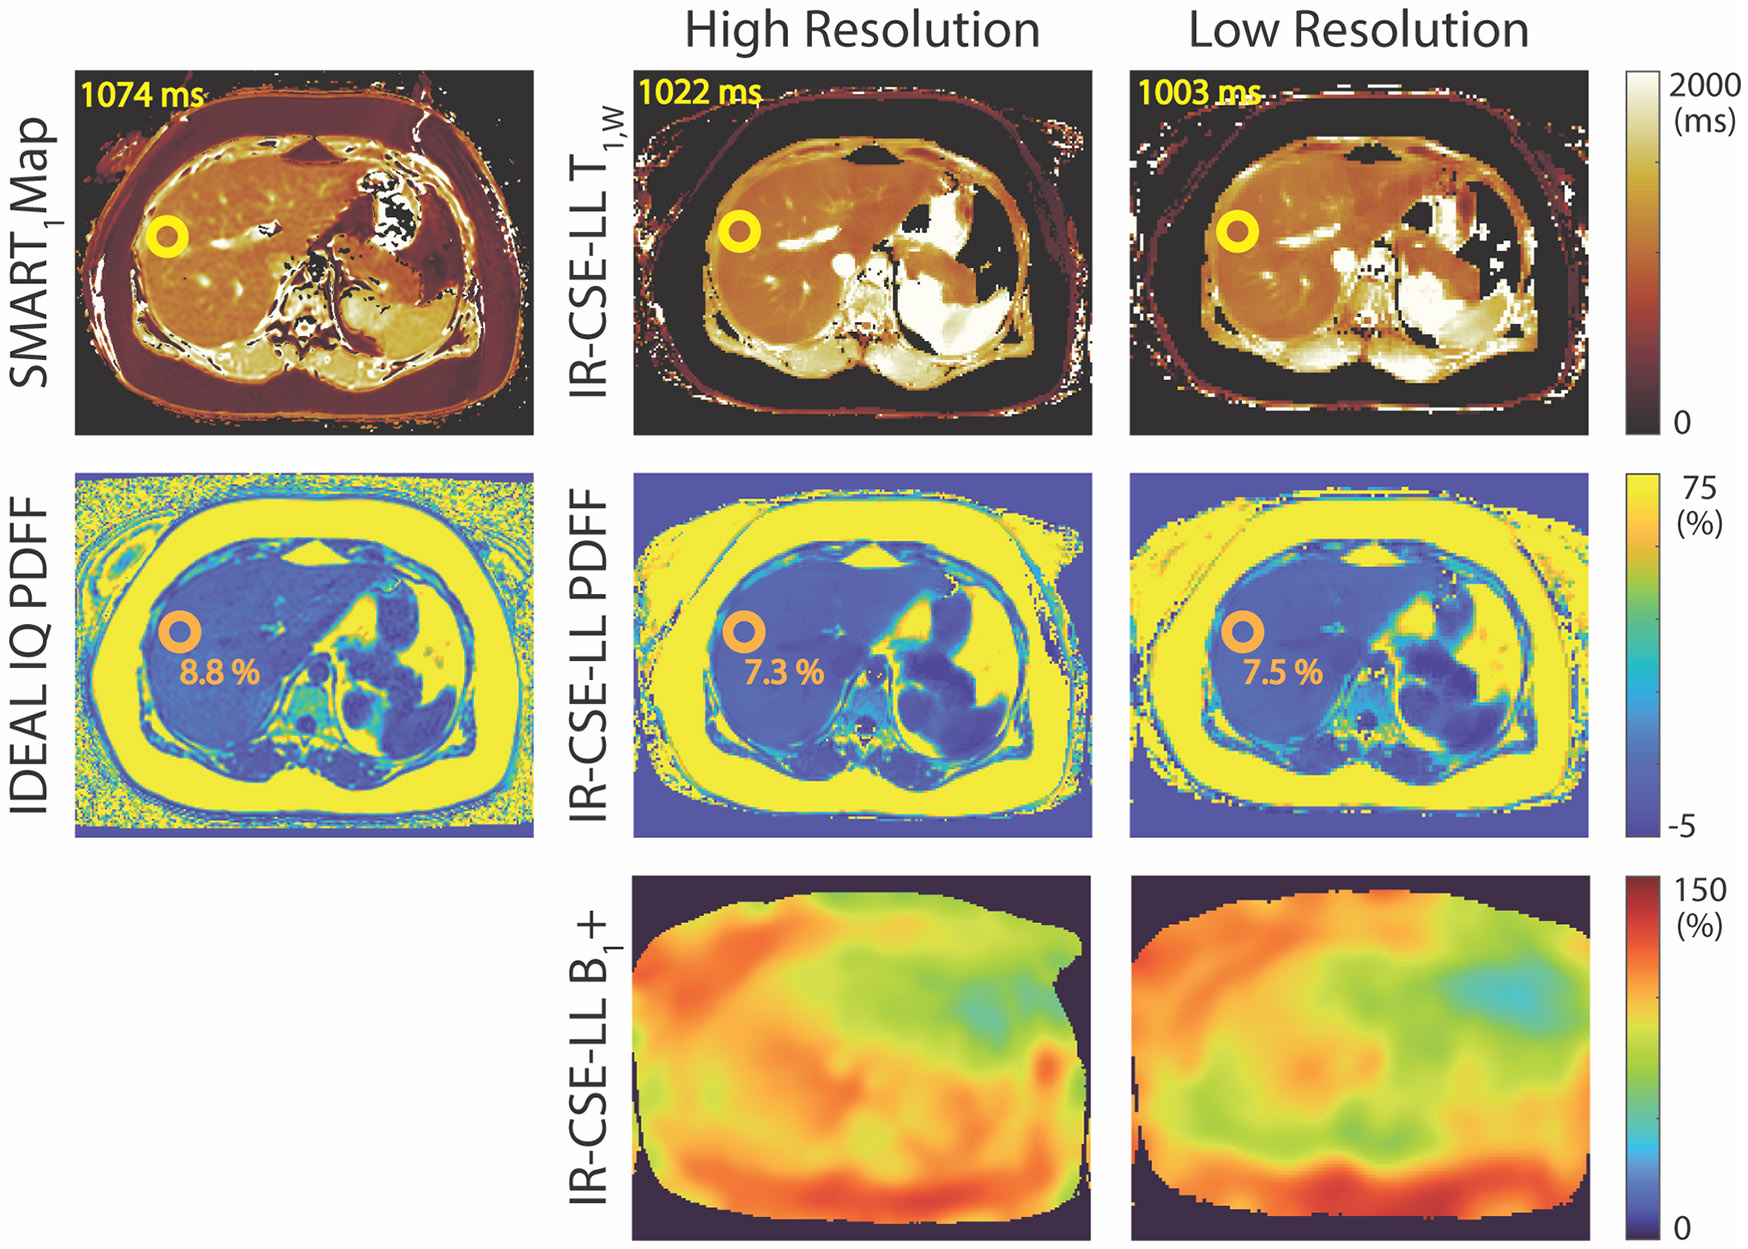
Purpose: Quantitative T1 mapping has the potential to replace biopsy for noninvasive diagnosis and quantitative staging of chronic liver disease. Conventional T1 mapping methods are confounded by fat and B 1 + $$ {B}_1^{+} $$ inhomogeneities, resulting in unreliable T1 estimations. Furthermore, these methods trade off spatial resolution and volumetric coverage for shorter acquisitions with only a few images obtained within a breath-hold. This work proposes a novel, volumetric (3D), free-breathing T1 mapping method to account for multiple confounding factors in a single acquisition.

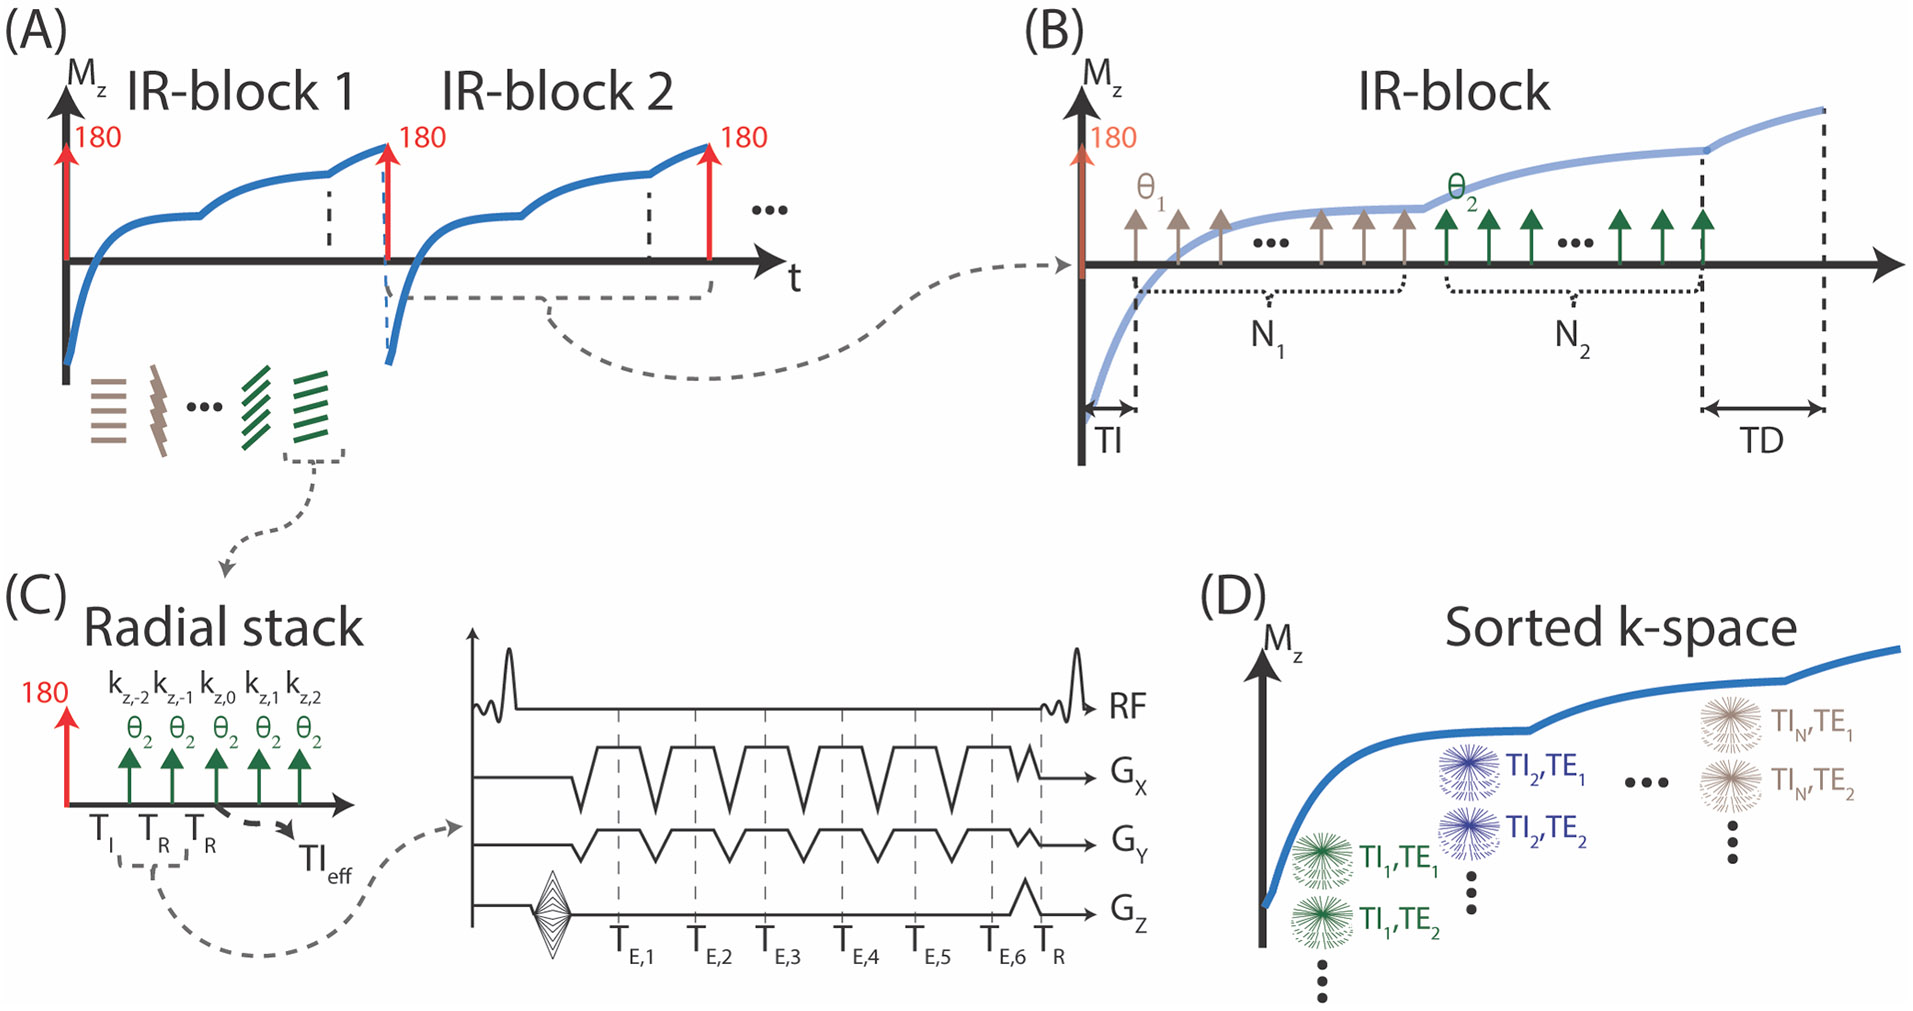
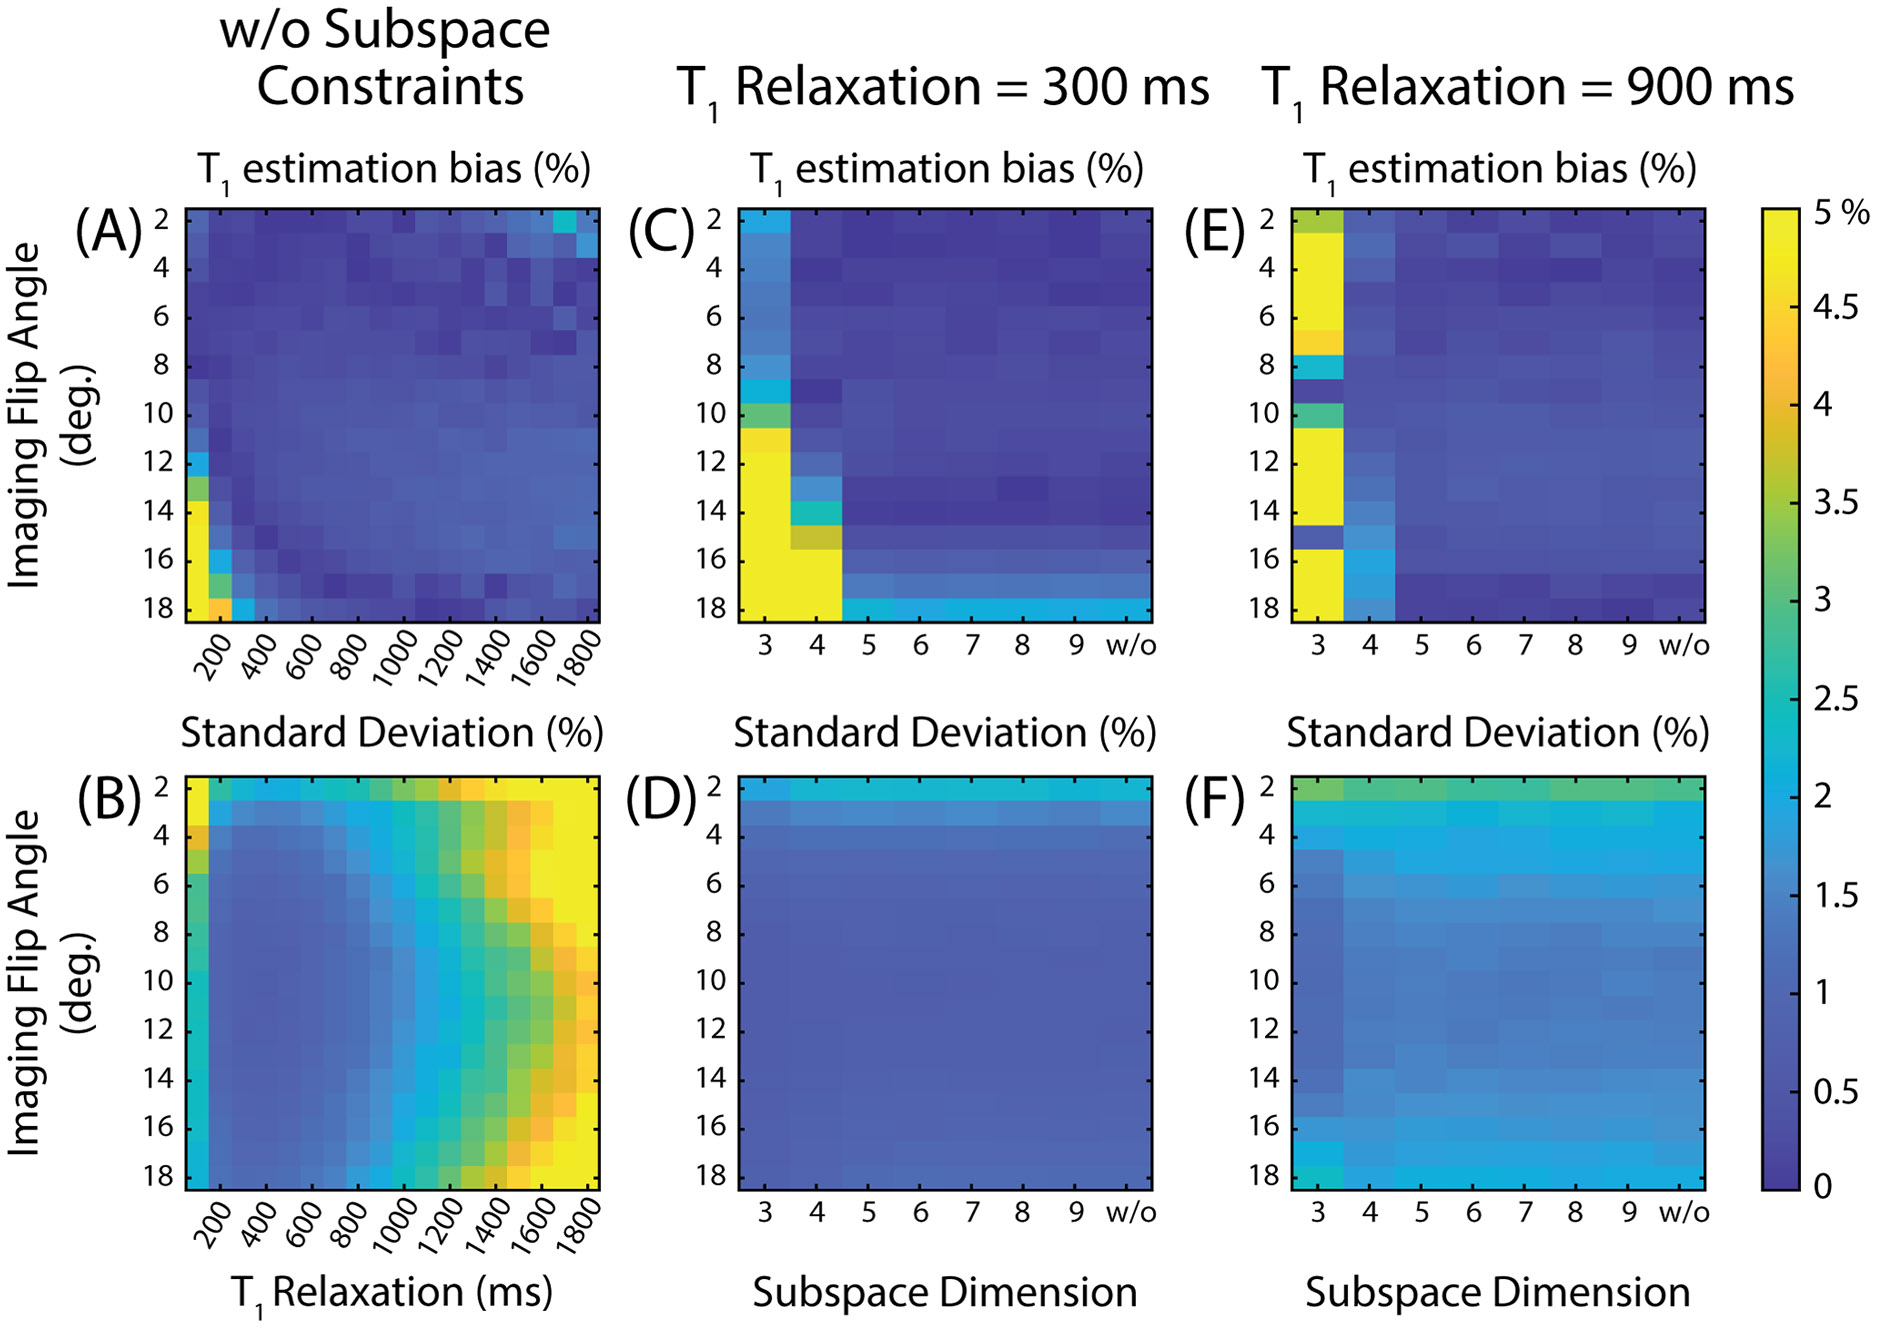
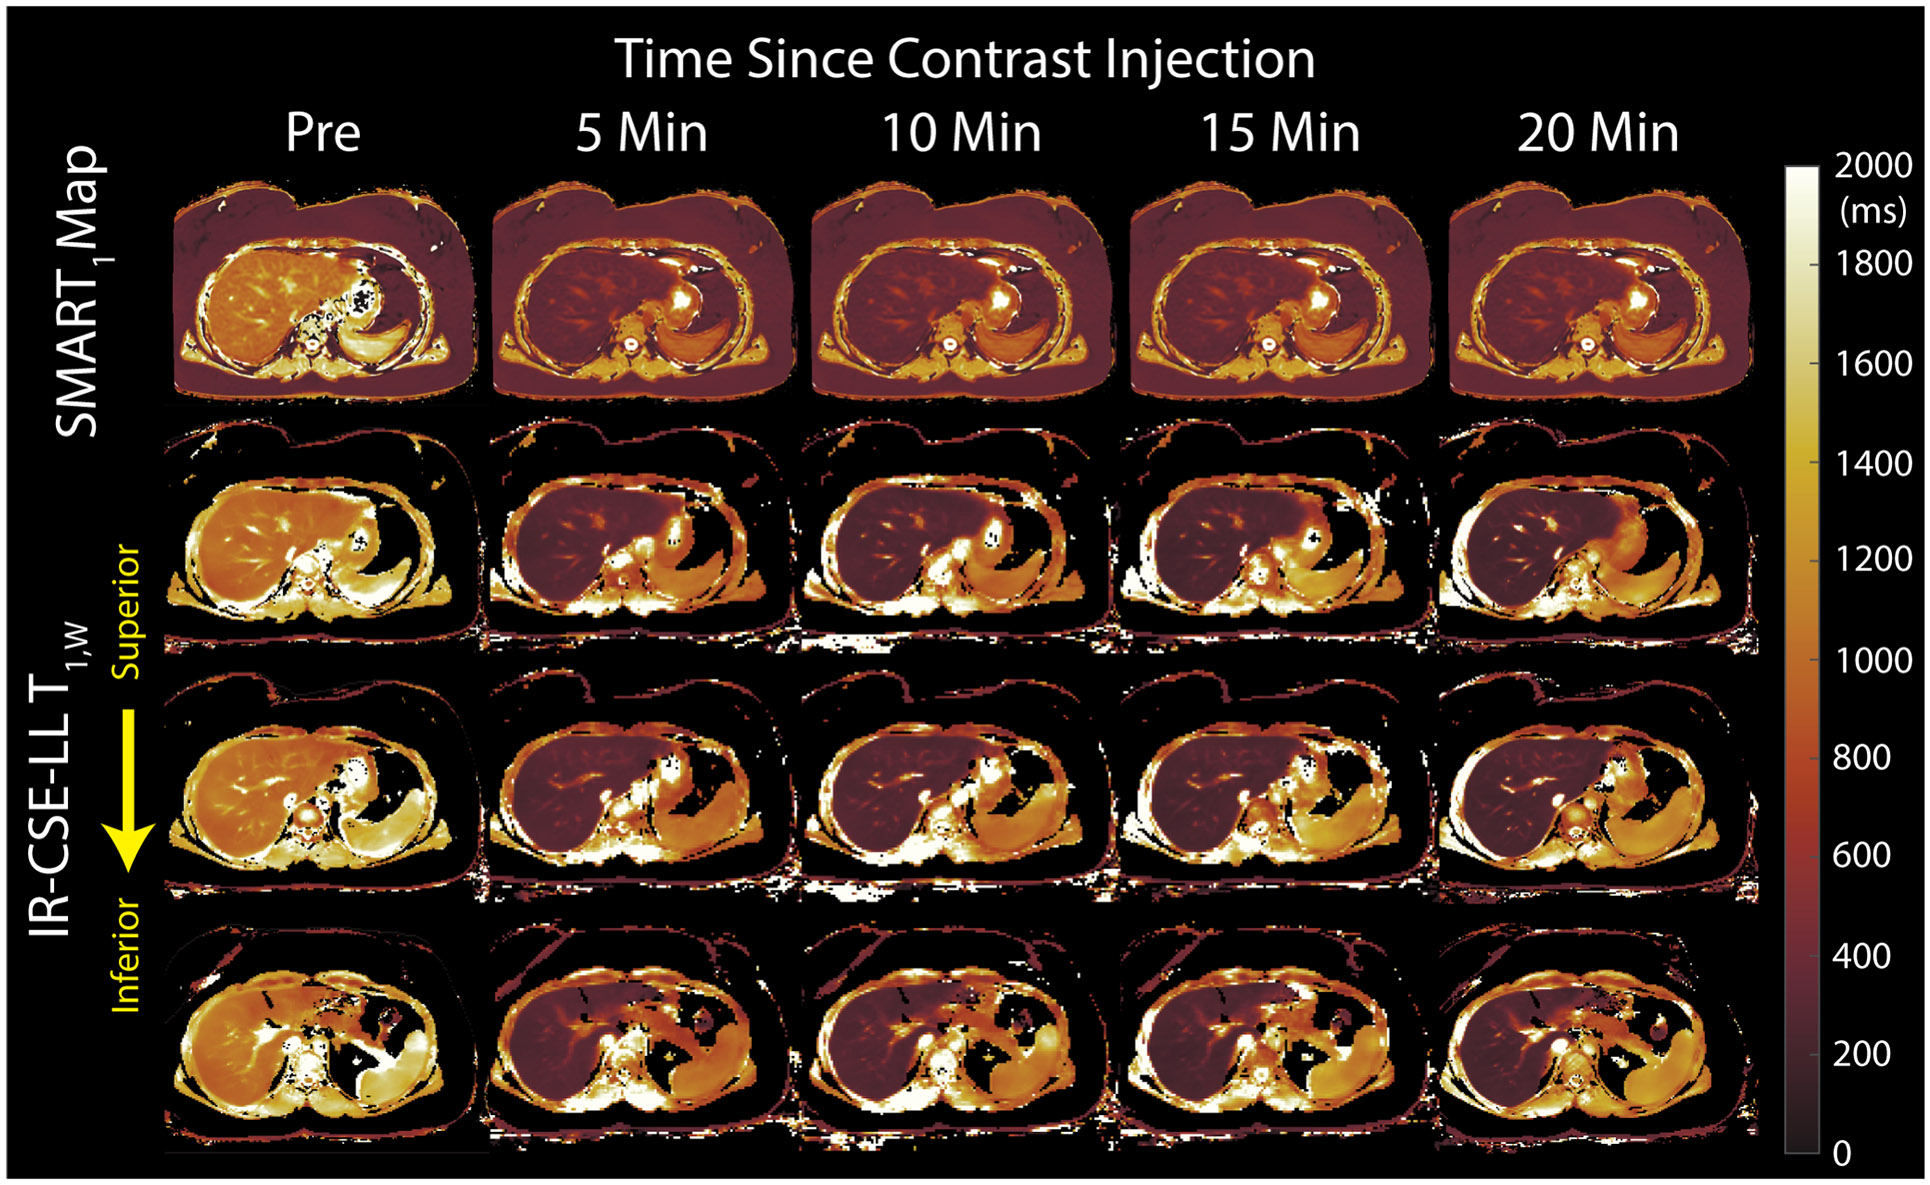
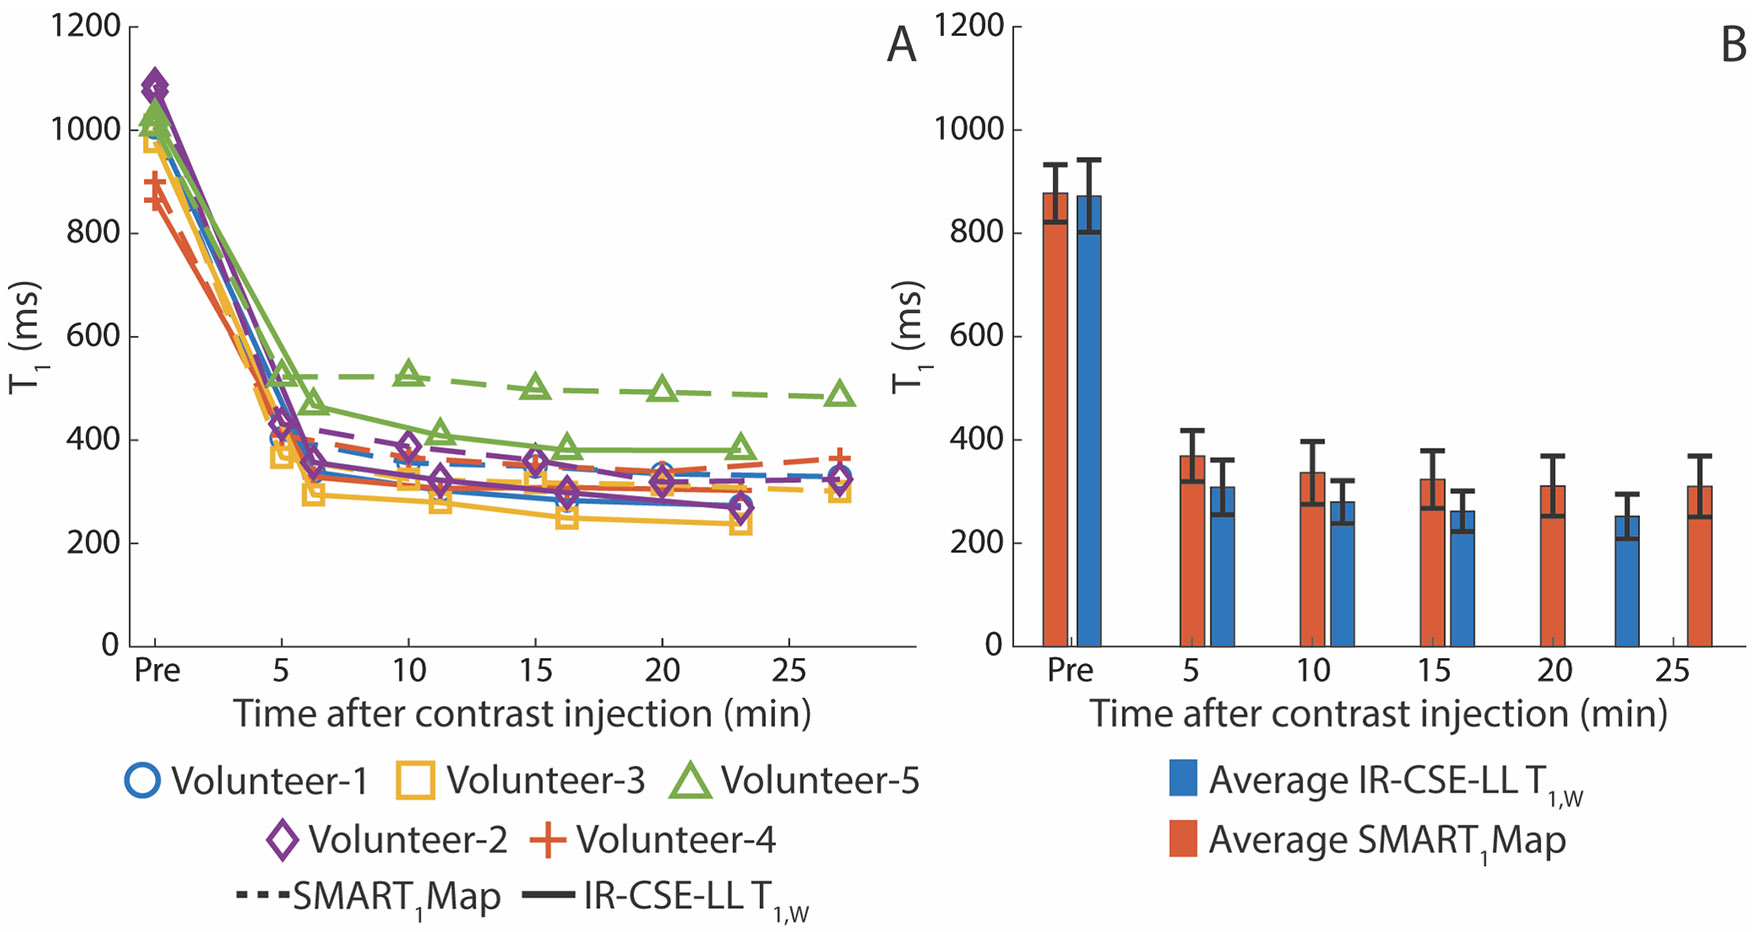
Theory and methods: Free-breathing, confounder-corrected T1 mapping was achieved through the combination of non-Cartesian imaging, magnetization preparation, chemical shift encoding, and a variable flip angle acquisition. A subspace-constrained, locally low-rank image reconstruction algorithm was employed for image reconstruction. The accuracy of the proposed method was evaluated through numerical simulations and phantom experiments with a T1/proton density fat fraction phantom at 3.0 T. Further, the feasibility of the proposed method was investigated through contrast-enhanced imaging in healthy volunteers, also at 3.0 T.

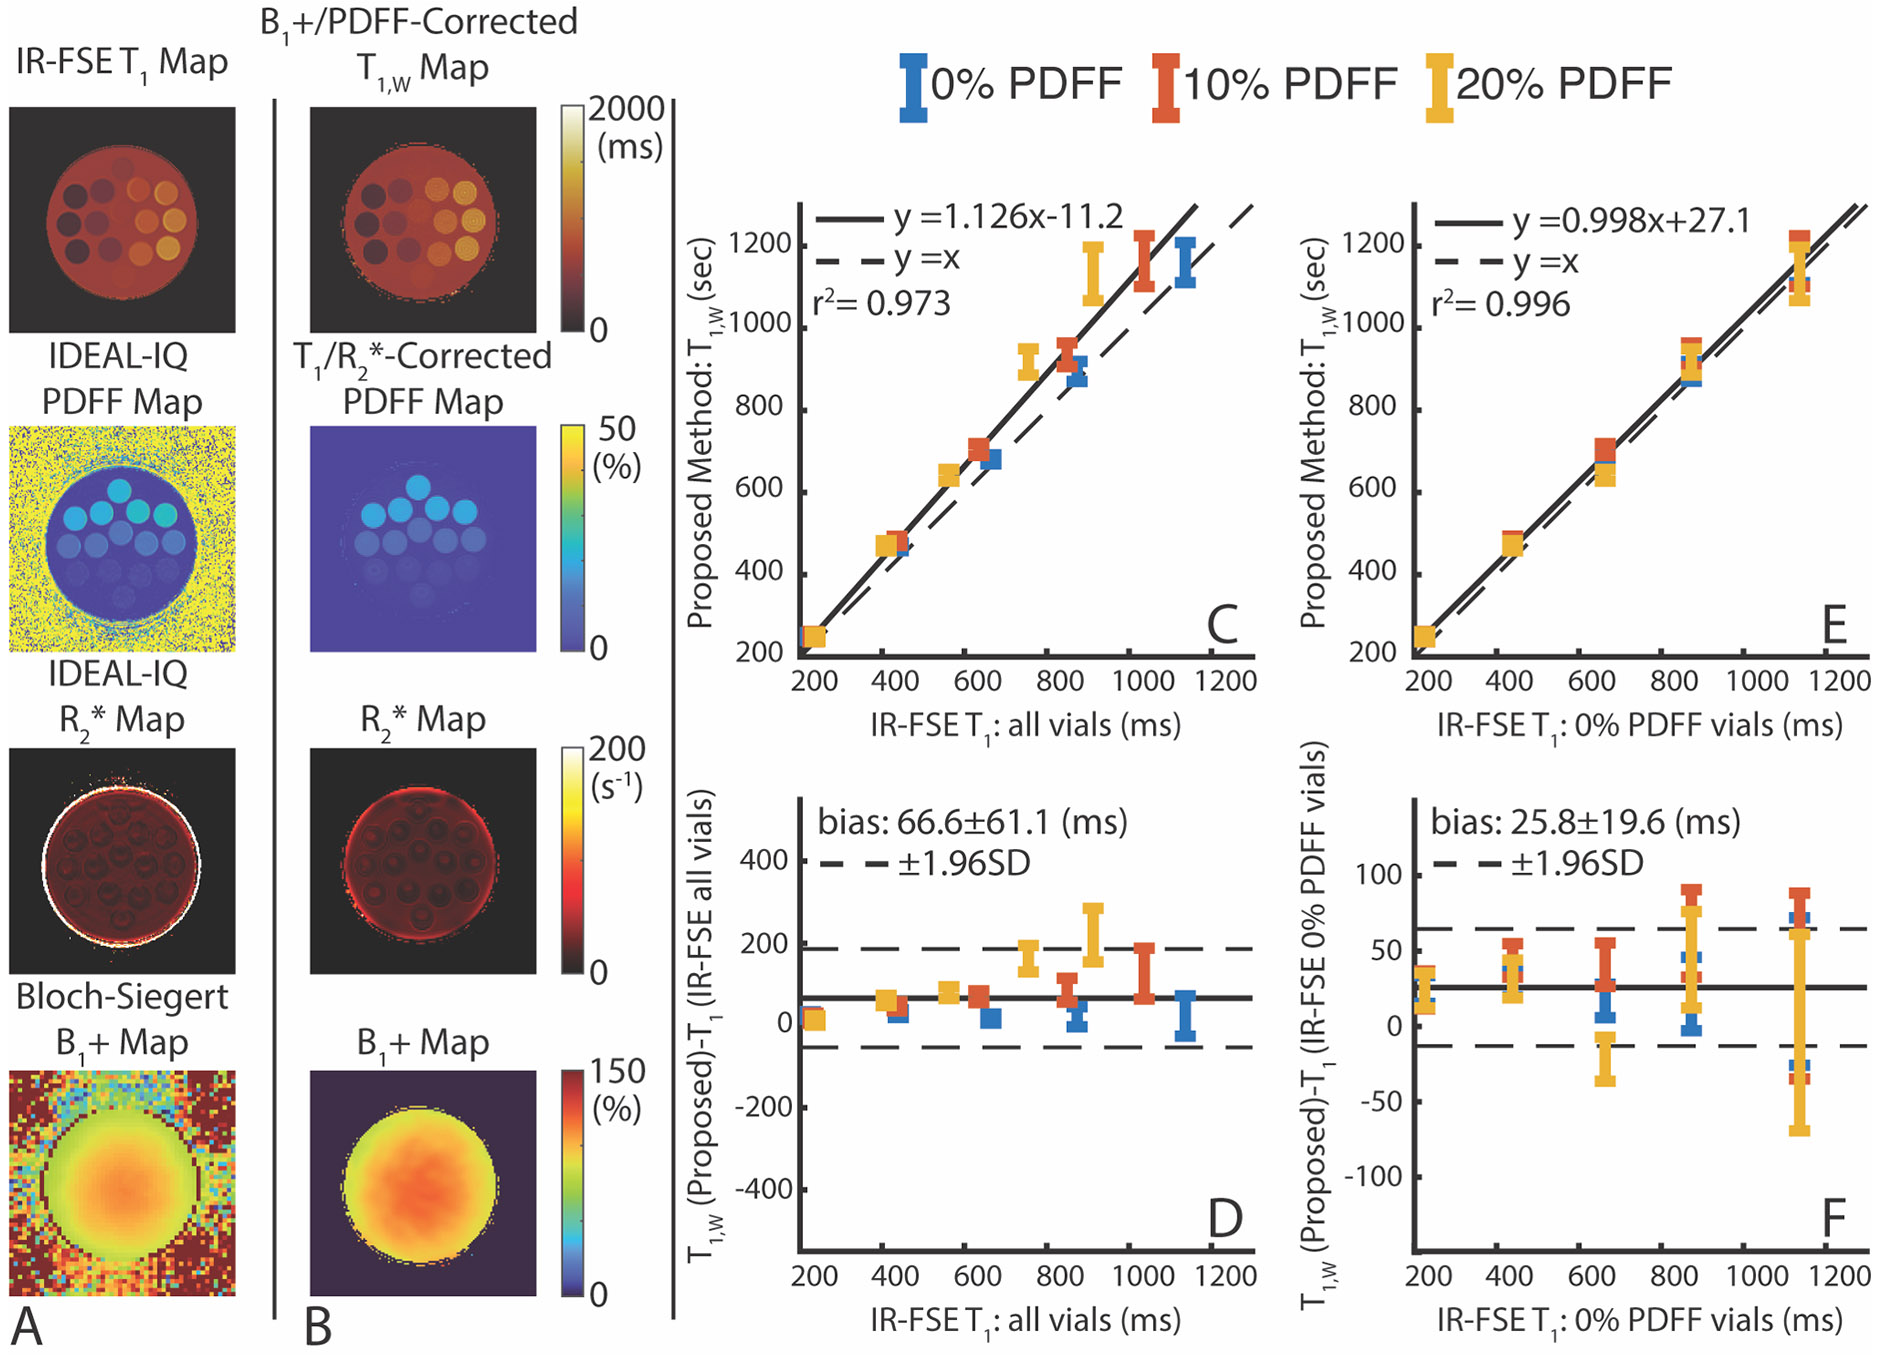
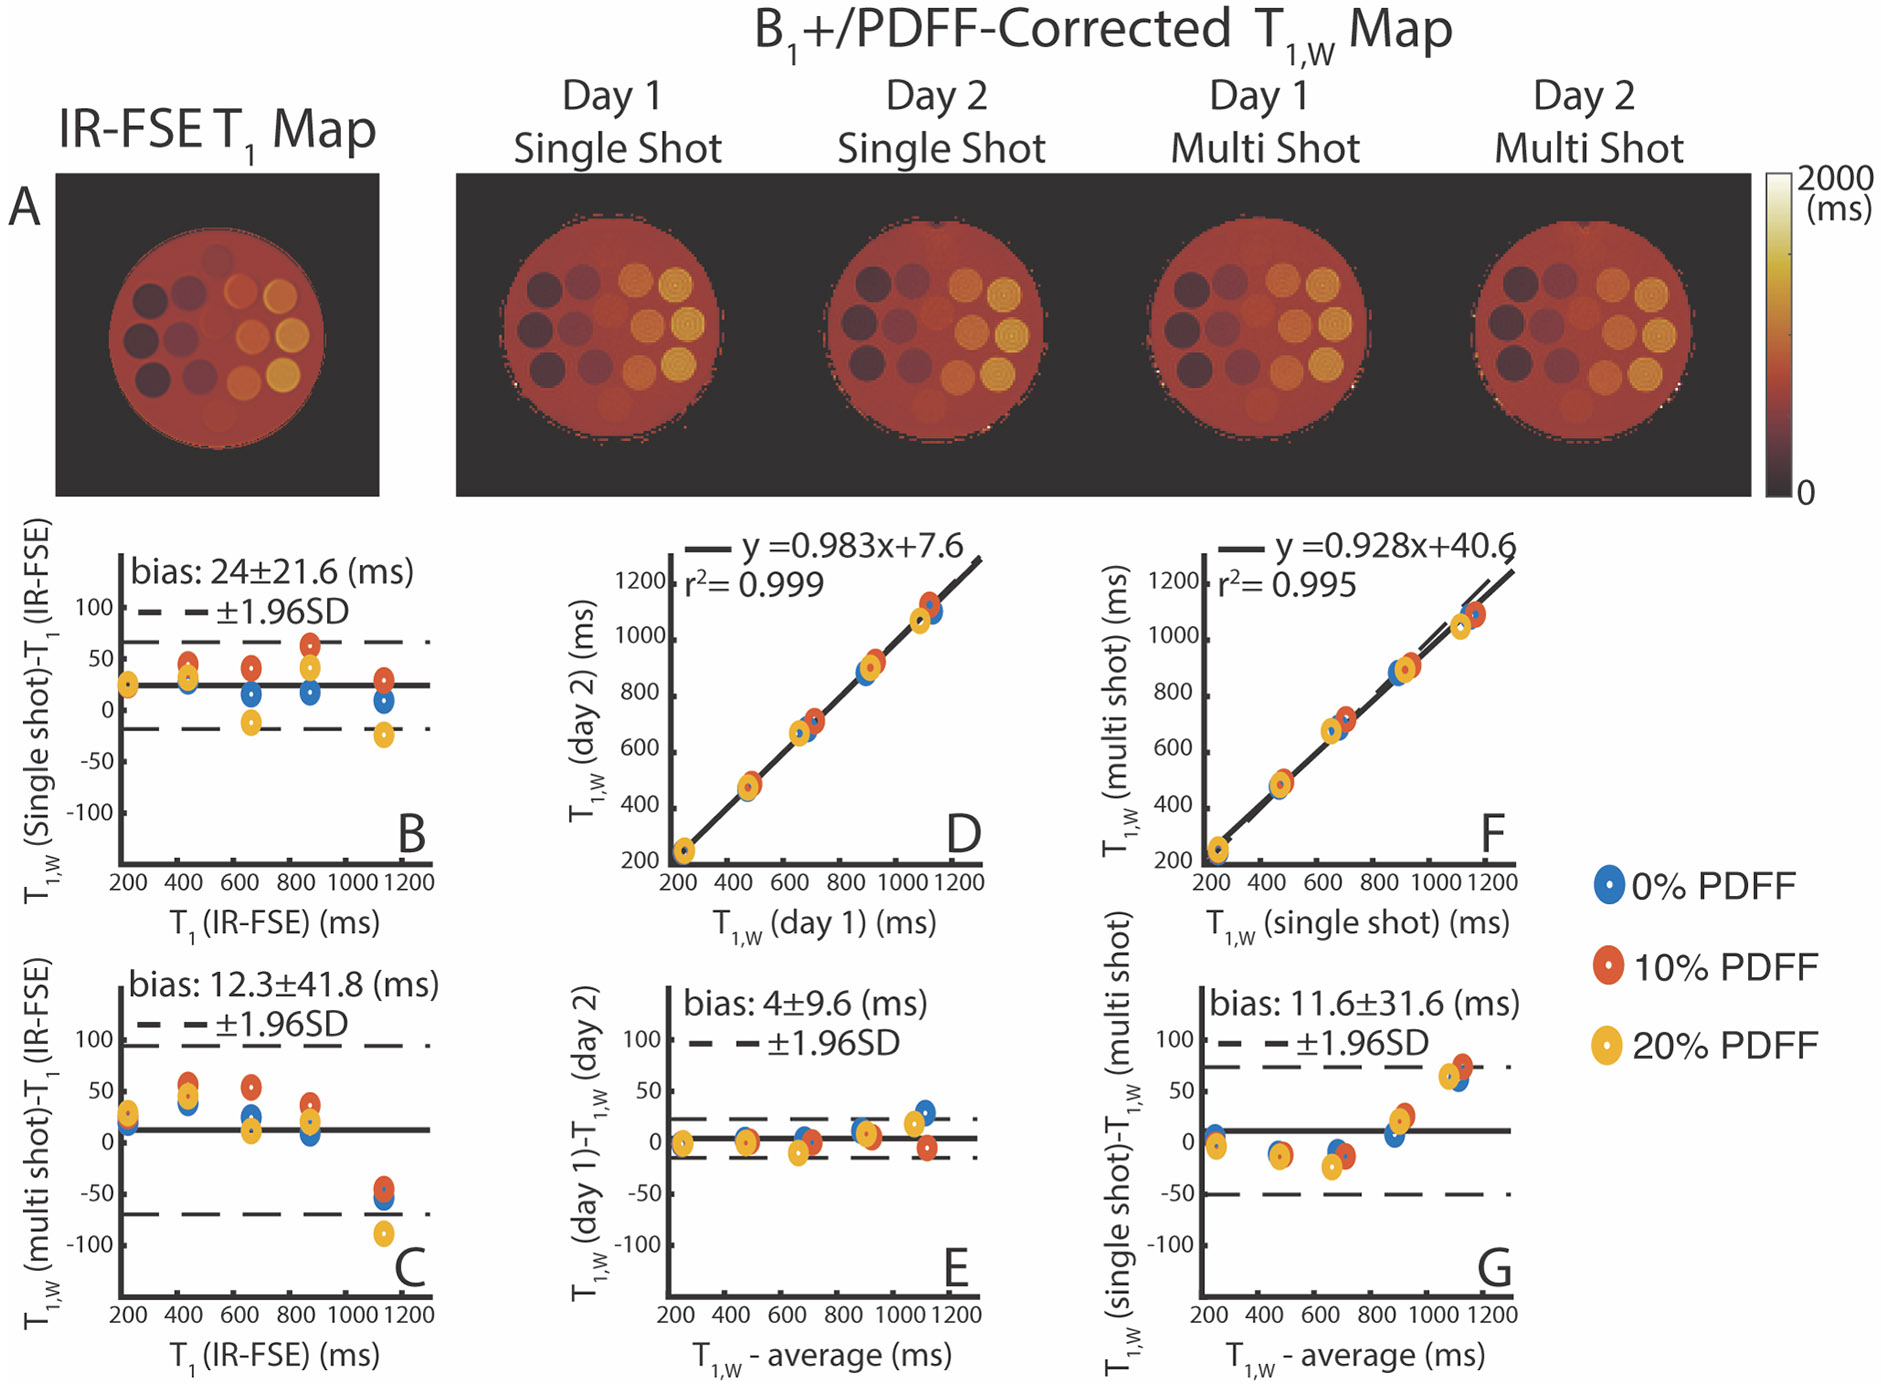
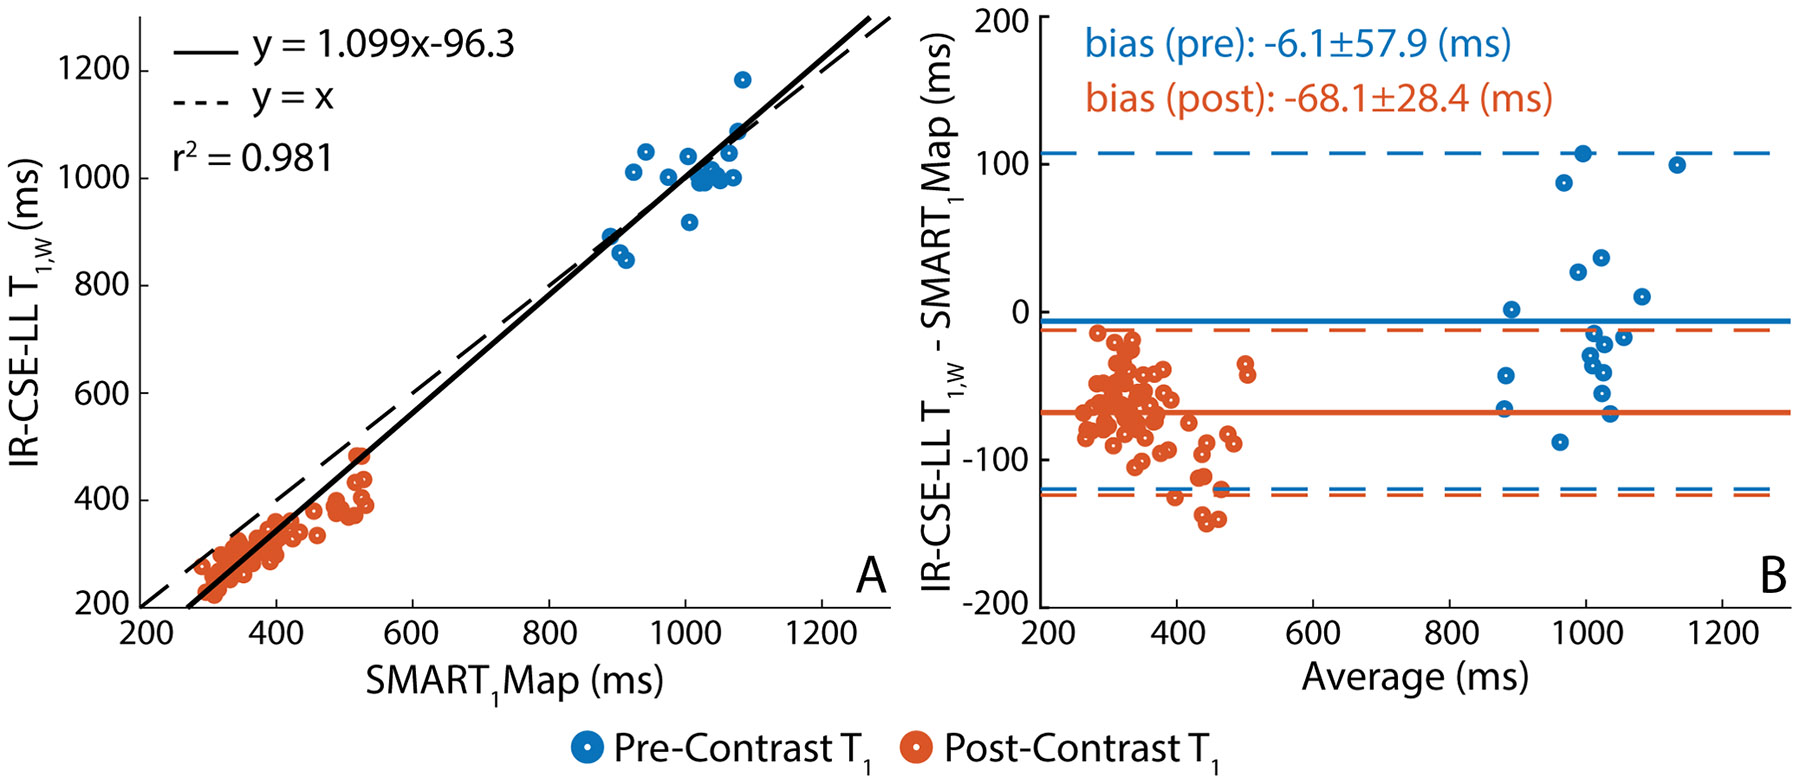
Results: The method showed excellent agreement with reference measurements in phantoms across a wide range of T1 values (200 to 1000 ms, slope = 0.998 (95% confidence interval (CI) [0.963 to 1.035]), intercept = 27.1 ms (95% CI [0.4 54.6]), r2 = 0.996), and a high level of repeatability. In vivo imaging studies demonstrated moderate agreement (slope = 1.099 (95% CI [1.067 to 1.132]), intercept = -96.3 ms (95% CI [-82.1 to -110.5]), r2 = 0.981) compared to saturation recovery-based T1 maps.

Conclusion: The proposed method produces whole-liver, confounder-corrected T1 maps through simultaneous estimation of T1, proton density fat fraction, and B 1 + $$ {B}_1^{+} $$ in a single, free-breathing acquisition and has excellent agreement with reference measurements in phantoms.

Keywords: T1 mapping; compressed‐sensing; free‐breathing imaging; inversion recovery; multi‐contrast; non‐Cartesian imaging.


Figures

Figure 1:
Figure 1:
The proposed data acquisition strategy provides volumetric images with T1 and chemical shift contrast. TIeff, TR, TE, and TD stand for effective inversion, repetition, echo, and idle time. (A, B) Each IR-Block consists of an adiabatic inversion pulse, radial stacks of multi-echo kz-readouts, and an idle period. The imaging flip angle (FA) changes throughout the T1 recovery to correct for T1 bias arising from B1+ inhomogeneity and inversion efficiency. (θ1, θ2) and (N1, N2) represent the FA pair, and the number of RF pulses corresponding to each FA used in imaging experiments. TI is the duration of the adiabatic inversion pulse. (C) TIeff is defined as the acquisition time of the center of the k-space for each radial stack. (D) The proposed image acquisition strategy delivers multi-contrast images acquired at different TIeff and TE points. Note that, the longitudinal magnetization (Mz) curves are representative of the θ1>θ2.
Figure 2:
Figure 2:
The Bloch equation simulations indicated that clinically relevant T1 times could be accurately estimated with moderate flip angles and a subspace dimension of four. (A, B) Larger FAs (θ1>12°) failed to produce accurate T1 estimations for T1<300ms, whereas longer T1 estimations (T1>1500ms) were prone to low SNR performance in the absence of subspace constraints. To investigate the impact of flip angle and subspace constraints on clinically relevant T1 values, 900 and 300 ms were chosen to represent pre- and post-contrast (hepatobiliary phase) T1 of the liver. (C, E) Within the clinically relevant range of T1 values, a minimum of 4-5 subspace dimensions were required to produce accurate T1 estimations, depending on the choice of flip angle. (D, F) For T1=300ms, small FAs (θ1<4°) were prone to low SNR performance. For T1=900ms, FAs between 8-12° produced more precise T1 estimations. Note that the flip angle axis only shows the first element of the flip angle pair, i.e., θ1. Note that “w/o” in (C, D, E, F) indicates the set of simulation results without subspace constraints. As a result of the simulation study, flip angle pair (θ1, θ2) of (8°,4°) and subspace dimension of 4 were used in the acquisition and reconstruction of the data.
Figure 3:
Figure 3:
The proposed T1 mapping method can correct for multiple confounding factors in a single acquisition, showing excellent agreement with the ground truth IR-FSE T1 measurements. (A) Reference T1, PDFF, R2, and B1+ maps. (B) Confounder corrected water-specific T1 (T1,W), PDFF, R2, and B1+ maps reconstructed with the proposed method. (C-D) The T1 map generated with the IR-FSE is confounded by the presence of fat, resulting in shorter apparent T1 in vials with 10 and 20% PDFF. (E-F) ROI measurements taken from vials with 0% PDFF in IR-FSE T1 maps reflect the true T1,W for a given NiCl2 concentration, which shows excellent linear agreement and a small bias of 25.8±19.6 ms with the proposed method.
Figure 4:
Figure 4:
The single- and multi-shot imaging protocols, acquired in different days, produced highly repeatable results that agree with the ground truth IR-FSE measurements. (A) Both imaging protocols acquired on different days produced similar T1,W maps. (B-C) Bland-Altman analysis against ground truth T1 measurements did not reveal significant bias for T1 estimations with the proposed method. (D-E) T1,W maps reconstructed with the proposed method on different days showed excellent agreement and negligible bias. (F-G) T1,W maps reconstructed with the single- and multi-shot protocols were highly correlated and did not show significant bias. A minor underestimation of longer T1,W (>1000 ms) was observed in the multi-shot protocol.
Figure 5:
Figure 5:
Confounder corrected T1,W maps from a healthy volunteer, acquired with two sets of imaging parameters are generally in agreement with the reference SMART1Map measurements. Confounder (PDFF and B1+) maps are also shown. B1+ inhomogeneity and inversion efficiency maps are smoothed in a multi-pass parameter estimation algorithm (see Sec. 2.3) to improve the noise performance of the final T1,W maps.
Figure 6:
Figure 6:
Both reference SMART1Map and the proposed T1,W maps were acquired pre- and post-contrast (5, 10, 15, and 20 min) injection to track T1,W shortening. While SMART1Map is capable of acquiring a single slice in a breath-hold, the proposed method can provide whole liver coverage in a free-breathing acquisition. Reference T1 and multiple slices from the proposed T1,W maps are displayed at different stages of the contrast-enhanced study.
Figure 7:
Figure 7:
The proposed method shows moderate agreement with the reference in vivo T1 measurements. (A) Regression analysis conducted on ROI measurements taken from pre- (blue) and post-contrast (red) T1 maps across all human subjects indicate a moderate agreement between the proposed method and the SMART1Map. (B) Bland-Altman analysis reveals an average difference of −6.1±57.9 and −68.1±28.4 ms between the proposed method and the SMART1Map for pre- and post-contrast measurements, respectively. Note that, blue and red dashed lines represent the 95% confidence intervals for pre- and post-contrast measurements, respectively.
Figure 8:
Figure 8:
T1,W times experienced statistically significant shortening following the administration of the contrast agent. (A) Data points show the average of a single ROI drawn in the proposed T1,W maps, and corresponding reference SMART1Maps, avoiding major veins. An additional SMART1Map is acquired following the acquisition of post-HBP T1,W map (~26 min) to ensure GA concentration remained approximately constant during the final 6-minute acquisition of the high-resolution T1,W map. (B) ROI measurements from SMART1Map and the proposed method averaged across volunteers, plotted against time after contrast injection, highlight that SMART1Map consistently estimates longer post-contrast T1 than the proposed method. Note that, due to longer imaging times, the mid-time point of the acquisition is reported as the effective measurement time for the proposed method.

Similar articles

Cited by

References

    1. Rinella ME, Lazarus JV, Ratziu V, et al. A multi-society Delphi consensus statement on new fatty liver disease nomenclature. Annals of Hepatology. Published online June 24, 2023:101133. doi: 10.1016/j.aohep.2023.101133 - DOI - PubMed
    1. Younossi Z, Tacke F, Arrese M, et al. Global Perspectives on Nonalcoholic Fatty Liver Disease and Nonalcoholic Steatohepatitis: Hepatology. Hepatology. 2019;69(6):2672–2682. doi: 10.1002/hep.30251 - DOI - PubMed
    1. Asrani SK, Devarbhavi H, Eaton J, Kamath PS. Burden of liver diseases in the world. Journal of Hepatology. 2019;70(1):151–171. doi: 10.1016/j.jhep.2018.09.014 - DOI - PubMed
    1. Loomba R, Wong R, Fraysse J, et al. Nonalcoholic fatty liver disease progression rates to cirrhosis and progression of cirrhosis to decompensation and mortality: a real world analysis of Medicare data. Aliment Pharmacol Ther. 2020;51(11):1149–1159. doi: 10.1111/apt.15679 - DOI - PubMed
    1. Younossi ZM, Stepanova M, Younossi Y, et al. Epidemiology of chronic liver diseases in the USA in the past three decades. Gut. 2020;69(3):564–568. doi: 10.1136/gutjnl-2019-318813 - DOI - PubMed