

Metformin treatment results in distinctive skeletal muscle mitochondrial remodeling in rats with different intrinsic aerobic capacities
- PMID: 38923664
- PMCID: PMC11488331
- DOI: 10.1111/acel.14235
Metformin treatment results in distinctive skeletal muscle mitochondrial remodeling in rats with different intrinsic aerobic capacities
Abstract
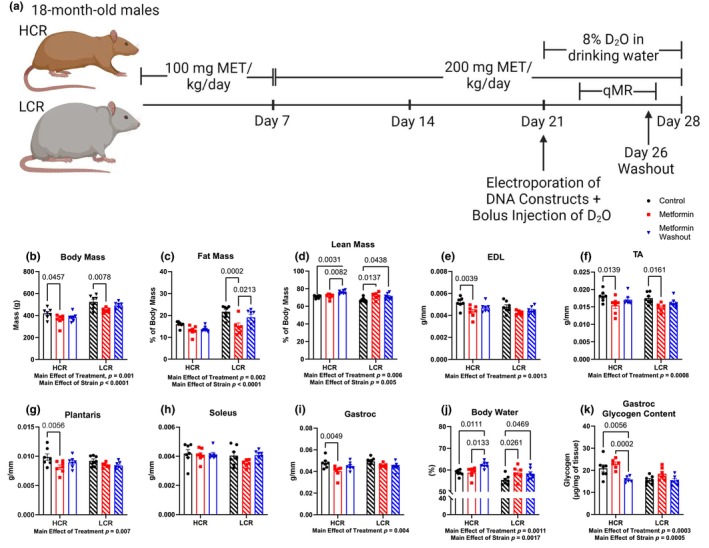
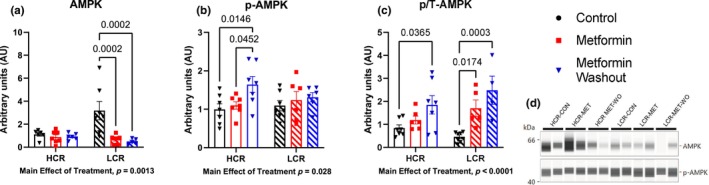
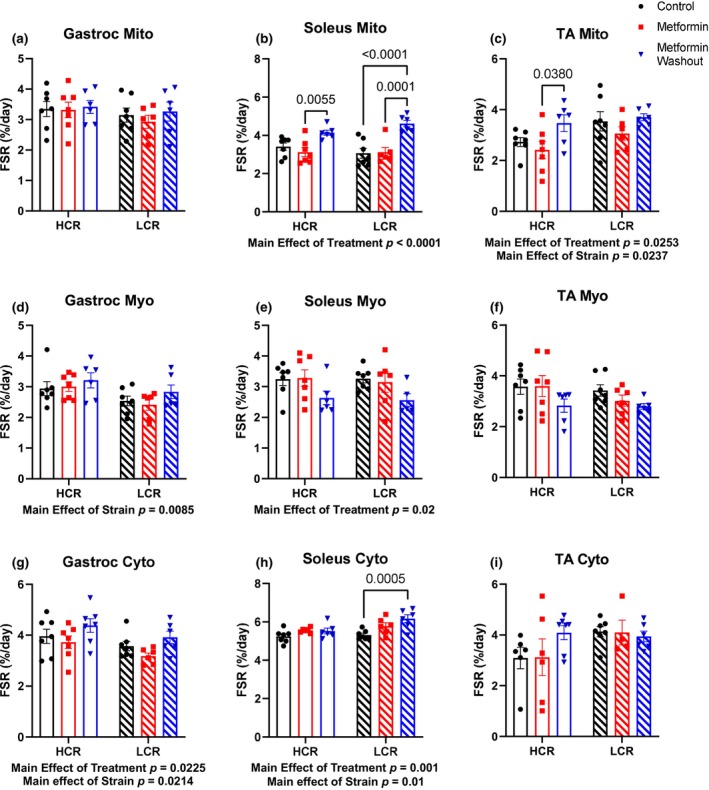
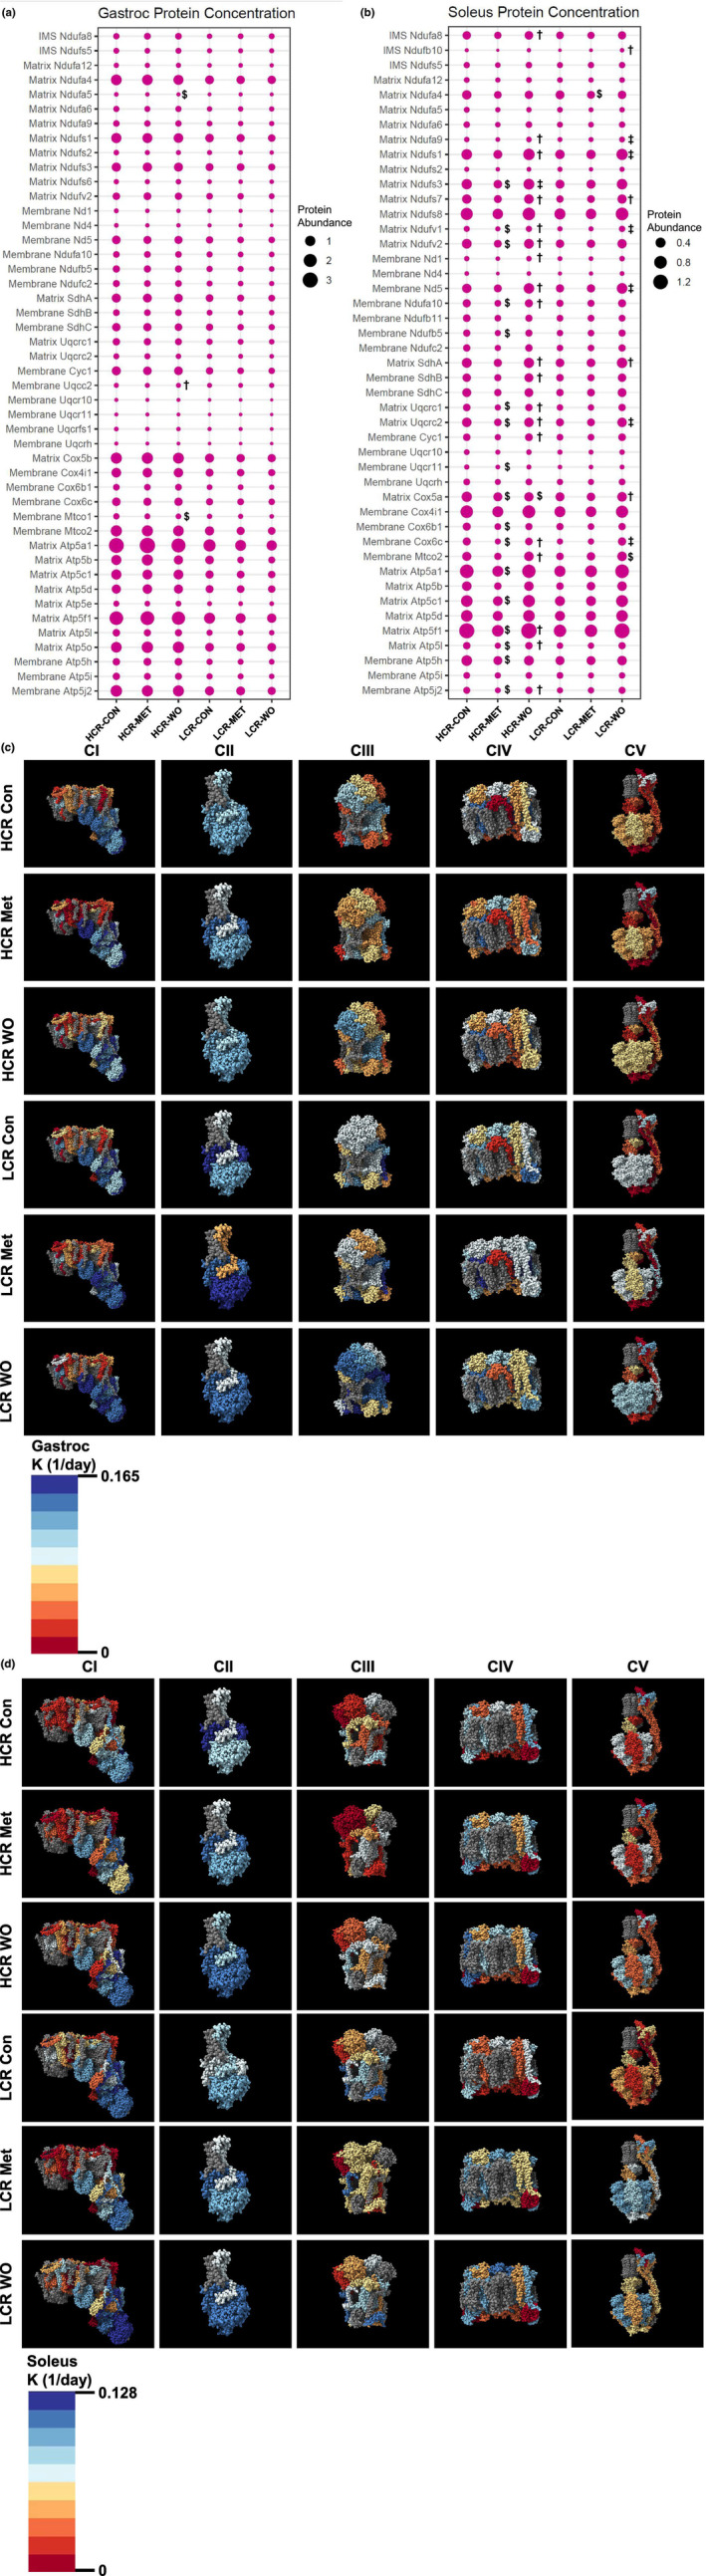
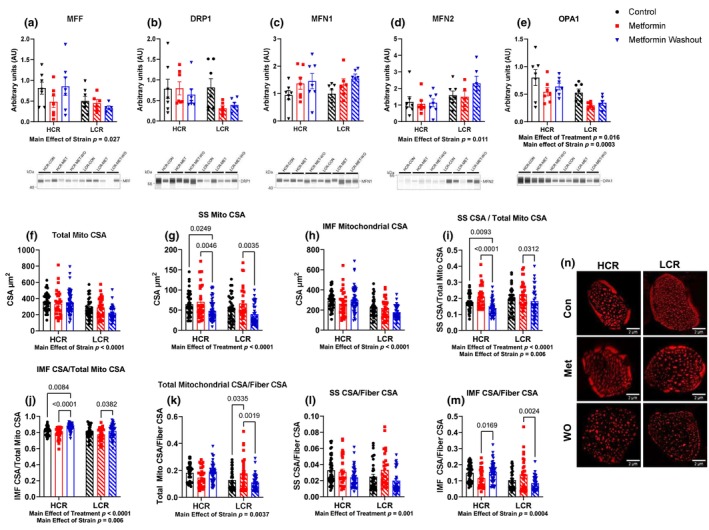
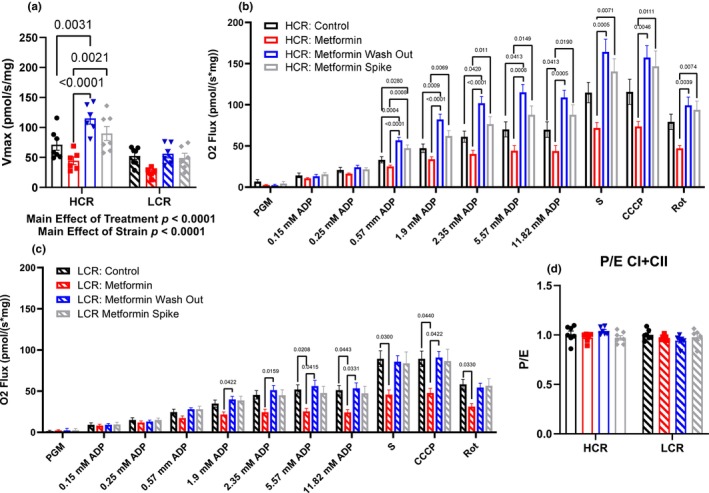
The rationale for the use of metformin as a treatment to slow aging was largely based on data collected from metabolically unhealthy individuals. For healthspan extension metformin will also be used in periods of good health. To understand the potential context specificity of metformin treatment on skeletal muscle, we used a rat model (high-capacity runner/low-capacity runner [HCR/LCR]) with a divide in intrinsic aerobic capacity. Outcomes of metformin treatment differed based on baseline intrinsic mitochondrial function, oxidative capacity of the muscle (gastroc vs soleus), and the mitochondrial population (intermyofibrillar vs. subsarcolemmal). Metformin caused lower ADP-stimulated respiration in LCRs, with less of a change in HCRs. However, a washout of metformin resulted in an unexpected doubling of respiratory capacity in HCRs. These improvements in respiratory capacity were accompanied by mitochondrial remodeling that included increases in protein synthesis and changes in morphology. Our findings raise questions about whether the positive findings of metformin treatment are broadly applicable.
Keywords: deuterium oxide; geroscience; healthspan; protein synthesis; proteomics.
© 2024 The Author(s). Aging Cell published by Anatomical Society and John Wiley & Sons Ltd.
Conflict of interest statement
The authors have no conflict of interests to disclose.
Figures
Update of
-
Metformin treatment results in distinctive skeletal muscle mitochondrial remodeling in rats with different intrinsic aerobic capacities.bioRxiv [Preprint]. 2024 Mar 4:2024.03.01.582957. doi: 10.1101/2024.03.01.582957. bioRxiv. 2024. Update in: Aging Cell. 2024 Sep;23(9):e14235. doi: 10.1111/acel.14235. PMID: 38496648 Free PMC article. Updated. Preprint.
References
-
- Abbott, C. B. , Lawrence, M. M. , Kobak, K. A. , Lopes, E. B. P. , Peelor, F. F. , Donald, E. J. , van Remmen, H. , Griffin, T. M. , & Miller, B. F. (2021). A novel stable isotope approach demonstrates surprising degree of age‐related decline in skeletal muscle collagen proteostasis. Function, 2(4), 1–11. 10.1093/function/zqab028 - DOI - PMC - PubMed
-
- Alfaras, I. , Mitchell, S. J. , Mora, H. , Lugo, D. R. , Warren, A. , Navas‐Enamorado, I. , Hoffmann, V. , Hine, C. , Mitchell, J. R. , Le Couteur, D. G. , Cogger, V. C. , Bernier, M. , & de Cabo, R. (2017). Health benefits of late‐onset metformin treatment every other week in mice. NPJ Aging and Mechanisms of Disease, 3(1), 16. 10.1038/s41514-017-0018-7 - DOI - PMC - PubMed
-
- Aon, M. A. , Cortassa, S. , Juhaszova, M. , González‐Reyes, J. A. , Calvo‐Rubio, M. , Villalba, J. M. , Lachance, A. D. , Ziman, B. D. , Mitchell, S. J. , Murt, K. N. , Axsom, J. E. C. , Alfaras, I. , Britton, S. L. , Koch, L. G. , de Cabo, R. , Lakatta, E. G. , & Sollott, S. J. (2021). Mitochondrial health is enhanced in rats with higher vs. lower intrinsic exercise capacity and extended lifespan. NPJ Aging and Mechanisms of Disease, 7(1), 1. 10.1038/s41514-020-00054-3 - DOI - PMC - PubMed
-
- Bannister, C. A. , Holden, S. E. , Jenkins‐Jones, S. , Morgan, C. L. , Halcox, J. P. , Schernthaner, G. , Mukherjee, J. , & Currie, C. J. (2014). Can people with type 2 diabetes live longer than those without? A comparison of mortality in people initiated with metformin or sulphonylurea monotherapy and matched, non‐diabetic controls. Diabetes, Obesity and Metabolism, 16(11), 1165–1173. 10.1111/DOM.12354 - DOI - PubMed
MeSH terms
Substances
Grants and funding
LinkOut - more resources
Full Text Sources
