. 2024 Aug;11(32):e2402856.
doi: 10.1002/advs.202402856. Epub 2024 Jun 25.

Electroacupuncture Promotes Liver Regeneration by Activating DMV Acetylcholinergic Neurons-Vagus-Macrophage Axis in 70% Partial Hepatectomy of Mice

Affiliations

Electroacupuncture Promotes Liver Regeneration by Activating DMV Acetylcholinergic Neurons-Vagus-Macrophage Axis in 70% Partial Hepatectomy of Mice

Liu Yang et al. Adv Sci (Weinh). 2024 Aug.

Abstract

Lack of liver regenerative capacity is the primary cause of hepatic failure and even mortality in patients undergoing hepatectomy, with no effective intervention strategies currently available. Therefore, identifying efficacious interventions to enhance liver regeneration is pivotal for optimizing clinical outcomes. Recent studies have demonstrated that vagotomy exerts an inhibitory effect on liver regeneration following partial hepatectomy, thereby substantiating the pivotal role played by the vagus nerve in the process of liver regeneration. In recent years, electroacupuncture (EA) has emerged as a non-invasive technique for stimulating the vagus nerve. However, EA on hepatic regeneration remains uncertain. In this study, a 70% partial hepatectomy (PH) mouse model is utilized to investigate the effects of EA on acute liver regeneration and elucidate its underlying molecular mechanisms. It is observed that EA at ST36 acutely activated cholinergic neurons in the dorsal motor nucleus of the vagus nerve (DMV), resulting in increased release of acetylcholine from hepatic vagal nerve endings and subsequent activation of IL-6 signaling in liver macrophages. Ultimately, these events promoted hepatocyte proliferation and facilitated liver regeneration. These findings provide insights into the fundamental brain-liver axis mechanism through which EA promotes liver regeneration, offering a novel therapeutic approach for post-hepatectomy liver regeneration disorders.

Keywords: acetylcholinergic neurons; dorsal motor nucleus of vagus; electroacupuncture; liver regeneration; vagus nerve.


Conflict of interest statement

The authors declare no conflict of interest.

Figures
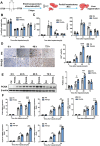
Figure 1
Figure 1
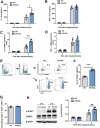
The effect of EA on liver regeneration was investigated in mice following 70% partial hepatectomy. A) A schematic diagram illustrating the procedure for electroacupuncture and 70% partial hepatectomy in mice. B) Liver/body weight ratio was measured at 0, 24, 48, and 72 h after the surgery to compare PH and EA+PH groups. C) Levels of alanine aminotransferase (ALT) and aspartate aminotransferase (AST) were assessed at different time points after the surgery to evaluate liver function in both groups. D) Immunohistochemical staining for Ki67 was performed to examine cell proliferation in the livers of PH and EA+PH mice at various time points post‐surgery. Scale bars, 20 µm. E) Western blot analysis was conducted to measure PCNA protein expression levels in liver tissue at different time points after the surgery. F) mRNA expression levels of PCNA, CyclinA2, CyclinB1, CyclinD1, and CyclinE1 genes were determined by qpcr in the livers at various time points following 70% PH. n = 5. Data are expressed as mean ± SD. *, P < 0.05; **, P < 0.01***; P < 0.001. The experiments above were repeated three times.
Figure 2
Figure 2
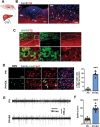
EA activated acetylcholinergic (Ach) neurons in DMV region of brain. A) Schematic with CTB injection. B) Fluorescence projection of CTB in DMV region of brain. Scale bars, 100 µm; Scale bars, 40 µm. C) Representative image of fluorescence colocalization of CTB signal with ChAT in the DMV region of the brain. Scale bars, 50 µm; Scale bars, 10 µm. D) Representative images of fluorescence colocalization of c‐Fos and ChAT in DMV, and the number of c‐Fos positive cells. Scale bars, 20 µm. E,F) Electrophysiological recordings of the spike number of DMV neurons. n = 5. Data are expressed as mean ± SD. ***, P < 0.001. The experiments above were repeated three times.
Figure 3
Figure 3
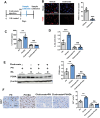
The effect of EA on liver regeneration is abolished after chemogenetic inhibition of Ach neurons in the DMV region. A) Schematic of chemogenetics and timeline of chemogenetic experiments. B,C) Representative DMV immunostaining of c‐Fos antibody in EGFP+PH+EA and hM4Di‐EGFP+ PH+EA mice 48 h after 70% PH and the quantification of c‐Fos+ neurons. Scale bars, 20 µm. D) Sample traces and action potential data of DMV neurons. E) liver/body weight ratio of PH, PH+EA, hM4Di+PH, and hM4Di+PH +EA groups 48 h after 70% PH. F) PCNA protein expression in liver tissue 48 h after 70% PH in four groups and the relative protein expression analysis. G) IHC staining of Ki67 48 h after 70% PH in four groups and the quantification of Ki67 positive cells. Scale bars, 20 µM. Data represent the mean ± SD. ns, P > 0.05; **, P < 0.01***; P < 0.001. The experiments above were repeated three times.
Figure 4
Figure 4
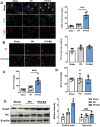
EA significantly activated the vagus nerve of liver, however had no effect on the sympathetic nerve. Immunostaining images and statistics of ChAT, F4/80 A) and TH B) in liver of sham, PH and PH+EA groups after 70% PH. Scale bars, 20 µm. Mass spectrometry detection of Ach C) and NE D) in liver of sham, PH and PH+EA groups after 70% PH. E)Western blot images and statistics of ChAT and TH in liver of sham, PH and PH+EA groups after 70% PH. Data represent the mean ± SD. ns, P > 0.05; ***; P < 0.001. The experiments above were repeated three times.
Figure 5
Figure 5
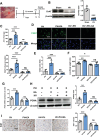
Hepatic branch vagotomy (HV) of mice eliminated the role of EA in promoting liver regeneration after 70% PH. A) Schematic of Hepatic branch HV in mice. B) The protein expression of ChAT and β−actinin in liver tissue were detected by western blot in sham and HV groups mice. C) Mass spectrometry detection of Ach in liver tissue of PH, PH+EA, HV+PH, HV+PH+EA groups after 70% PH. D) Representative immunostaining of ChAT antibody in PH, PH+EA, HV+PH, HV+PH+EA mice after 70% PH. Scale bars, 20 µm. E) The mRNA expression of chat at 48 h after 70% PH in mice from four PH, PH+EA, HV+PH, HV+PH+EA groups. F) liver/body weight ratio of mice in PH, PH+EA, HV+PH, HV+PH+EA groups after 48 h 70% PH. G) The mRNA expression of pcna at 48 h after 70% PH in mice from four PH, PH+EA, HV+PH, HV+PH+EA groups. H) PCNA protein expression in liver tissue 48 h after 70% PH in four groups and the relative protein expression analysis. I) IHC staining of Ki67 48 h after 70% PH in four groups and the quantification of Ki67 positive cells. Scale bars, 20 µm. Data represent the mean ± SD. ns, P > 0.05; *, P < 0.05; **, P < 0.01***; P < 0.001. The experiments above were repeated three times.
Figure 6
Figure 6
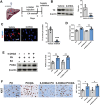
After the sympathetic nerve was removed, EA did not affect the promotion of liver regeneration after 70% PH. A) Schematic of 6‐OHDA administration in mice. B) Western blot test of TH in liver tissue in vehicle and 6‐OHDA administration mice. C) Representative immunostaining of TH antibody in vehicle and 6‐OHDA administration mice. Scale bars, 20 µm. D) liver/body weight ratio of mice in PH, PH+EA, 6‐OHDA+PH, 6‐OHDA+PH+EA groups after 48 h 70% PH. E) PCNA protein expression in liver tissue at 48 h after 70% PH in four groups by western blot and the relative protein expression analysis. F) IHC staining of Ki67 at 48 h after 70% PH in four groups and the quantification of Ki67 positive cells. Scale bars, 20 µm. Data represent the mean ± SD. *, P < 0.05; **, P < 0.01. The experiments above were repeated three times.
Figure 7
Figure 7
EA promotes IL‐6 release from macrophages in early liver regeneration after 70% PH. A,B) The secretion of IL‐6 and TNF‐α were detected by elisa in the remnant liver at 3 h after 70% PH. C,D) The mRNA expression of IL‐6 and TNF‐α genes in the liver tissue at 0, and 3 h after 70% PH. E) Representative FACS plots of hepatic leukocyte populations analyzed by flow cytometry analysis. The following gating strategies were used to identify various immune cells: hepatic macrophages (CD45+F4/80+), IL‐6 secretion of hepatic macrophages (CD45+F4/80+IL‐6+). Representative FACS plots of IL‐6+ hepatic macrophages and hepatic macrophages from PH and PH+EA mice at 3 h after PH and F,G) quantification of the proportion of these immune cell subtypes. H) Representative images of liver extract immunoblottings with anti‐phospho‐STAT3, total STAT3, and actin. Relative intensities of phospho/total STAT3 in livers from sham operation for PH and PH+EA mice. Data represent the mean ± SD. *, P < 0.05; **, P < 0.01; ***, P < 0.001. The experiments above were repeated three times.
Figure 8
Figure 8
The enhancement effect of EA on IL‐6 disappeared after HV. A) Schematic of hepatic branch vagotomy in mice. B) The secretion of IL‐6 was detected by elisa from PH, PH+EA, HV+PH, HV+PH+EA mice in the remnant liver at 3 h after 70% PH. C) The mRNA expression of IL‐6 at 3 h after 70% PH in mice from PH, PH+EA, HV+PH, HV+PH+EA groups. D,E) Western blot assay for phospho‐STAT3, total STAT3, and β−actin protein expression in liver tissue at 48 h after 70% PH in four groups and the relative protein expression analysis.
Figure 9
Figure 9
Clodronate administration eliminated the effect of EA on increasing IL‐6 secretion in the early stage of liver regeneration after 70% PH in mice. A) Schematic of crodronate injection in mice. B) Representative immunostaining of the hepatic macrophage marker F4/80 antibody in vehicle and clodronate liposome administration mice after 70% PH. Scale bars, 20 µM. C) The secretion of IL‐6 was detected from PH, PH+EA, clodronate+PH, and clodronate+PH+EA mice by elisa in the remnant liver at 3 h after 70% PH. D) The mRNA expression of IL‐6 at 3 h after 70% PH in mice from PH, PH+EA, clodronate+PH, and clodronate+PH+EA mice. E) PCNA protein expression in liver tissue at 48 h after 70% PH in four groups by western blot and the relative protein expression analysis. F) IHC staining of Ki67 at 48 h after 70% PH in four groups and the quantification of Ki67 positive cells. Scale bars, 20 µm. Data represent the mean ± SD. ns, P > 0.05; *, P < 0.05; **, P < 0.01; ***, P < 0.001. The experiments above were repeated three times.
Figure 10
Figure 10
EA promotion of liver regeneration depends on liver cholinergic signaling. A) Schematic of aprotine injection in mice. B) The secretion of IL‐6 was detected from PH, PH+EA, Aprotine+PH, and Aprotine+PH+EA mice by elisa in the remnant liver at 3 h after 70% PH. C) The mRNA expression of IL‐6 at 3 h after 70% PH in mice from PH, PH+EA, Aprotine+PH, and Aprotine+PH+EA mice. D) Western blot assay for phospho‐STAT3, total STAT3, and β−actin protein expression in liver tissue at 48 h after 70% PH in four groups and the relative protein expression analysis. E) PCNA protein expression in liver tissue at 48 h after 70% PH in four groups by western blot and the relative protein expression analysis. F) IHC staining of Ki67 at 48 h after 70% PH in four groups and the quantification of Ki67 positive cells. Scale bars, 20 µM. Data represent the mean ± SD. ns, P > 0.05; **, P < 0.01; ***, P < 0.001. The experiments above were repeated three times.
Figure 11
Figure 11
Summary mechanism diagram illustrating EA at ST36 acutely activates cholinergic neurons in the DMV of the brain, resulting in increased release of acetylcholine from hepatic vagus nerve endings and subsequent activation of IL‐6 signaling in liver macrophages.

Comment in

References

    1. Michalopoulos G. K., Bhushan B., Nat. Rev. Gastroenterol. Hepatol. 2021, 18, 40. - PubMed
    1. Huang R., Zhang X., Gracia‐Sancho J., Xie W. F., Liver Int. 2022, 42, 1486. - PubMed
    1. a) Bhushan B., Apte U., Am. J. Pathol. 2019, 189, 719; - PMC - PubMed
    2. b) Clemens M. M., McGill M. R., Apte U., Adv. Pharmacol. 2019, 85, 241. - PMC - PubMed
    1. Ozaki M., Semin. Cell Dev. Biol. 2020, 100, 62. - PubMed
    1. Forbes S. J., Newsome P. N., Nat. Rev. Gastroenterol. Hepatol. 2016, 13, 473. - PubMed

LinkOut - more resources