. 2024 Jul 2;121(27):e2320727121.
doi: 10.1073/pnas.2320727121. Epub 2024 Jun 26.

A distal enhancer of GATA3 regulates Th2 differentiation and allergic inflammation

Affiliations

A distal enhancer of GATA3 regulates Th2 differentiation and allergic inflammation

Takashi Kumagai et al. Proc Natl Acad Sci U S A. .

Abstract

Asthma is a widespread airway disorder where GATA3-dependent Type-2 helper T (Th2) cells and group 2 innate lymphoid cells (ILC2s) play vital roles. Asthma-associated single nucleotide polymorphisms (SNPs) are enriched in a region located 926-970 kb downstream from GATA3 in the 10p14 (hG900). However, it is unknown how hG900 affects the pathogenesis of allergic airway inflammation. To investigate the roles of the asthma-associated GATA3 enhancer region in experimental allergic airway inflammation, we first examined the correlation between GATA3 expression and the activation of the hG900 region was analyzed by flow cytometry and ChIP-qPCR. We found that The activation of enhancers in the hG900 region was strongly correlated to the levels of GATA3 in human peripheral T cell subsets. We next generated mice lacking the mG900 region (mG900KO mice) were generated by the CRISPR-Cas9 system, and the development and function of helper T cells and ILCs in mG900KO mice were analyzed in steady-state conditions and allergic airway inflammation induced by papain or house dust mite (HDM). The deletion of the mG900 did not affect the development of lymphocytes in steady-state conditions or allergic airway inflammation induced by papain. However, mG900KO mice exhibited reduced allergic inflammation and Th2 differentiation in the HDM-induced allergic airway inflammation. The analysis of the chromatin conformation around Gata3 by circular chromosome conformation capture coupled to high-throughput sequencing (4C-seq) revealed that the mG900 region interacted with the transcription start site of Gata3 with an influencing chromatin conformation in Th2 cells. These findings indicate that the mG900 region plays a pivotal role in Th2 differentiation and thus enhances allergic airway inflammation.

Keywords: GATA3; ILC2; Th2 cell; asthma; enhancer.


Conflict of interest statement

Competing interests statement:The authors declare no competing interest.

Figures

Fig. 1.
Fig. 1.
The activation of the human G900 region is associated with GATA3 expression in Th2 cells. (A and B) Asthma-associated SNPs of UK Biobank resource (A) and GWAS catalog (B). The yellow rectangle indicates the hG900 region. Line colors in (B) indicate the individual reports; see SI Appendix, Fig. S1. (C and D) UCSC tracks of H3K4me2 ChIP-seq analysis for the indicated T cell subsets (naïve CD4+ T cells, Th1 cells, and Th2 cells) derived from PBMCs of asthma patients (GSE53646) (19). The average of ChIP-seq counts was calculated from subjects 1, 5, 7, 8, and 9. Black bars indicate peaks, and the triangles indicate control regions. (E) GATA3 expression of naive CD4+ T cells, Th1 cells, CRTH2 Th2 cells, and CRTH2+ Th2 cells in PBMCs harvested from healthy subjects. (F) Helper T cell subsets were sorted based on (E) and subjected to ChIP-qPCR. Line plots of %Input of H3K27ac levels on the peaks and control regions are shown as mean ± SE. (G and H) The correlation coefficient between H3K27ac levels (%Input) and GATA3 expression. (G) Left: the correlation at chr2:8,954,485 [black arrowhead in (F)]. Right: the correlation at chr2:9,015,196 [red arrowhead in (F)]. Dot shapes indicate each subject, and dot colors indicate the Th cell subsets in (E). Filled dots indicate male and open dots indicate female. Multiple comparisons were corrected by Holm’s method. (H) R2 at each peak. Empty circle: adjusted P-value ≥ 0.05, filled circle: adjusted P-value < 0.05. (EH) Data are representative of six subjects in three independent experiments.
Fig. 2.
Fig. 2.
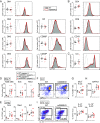
The mG900 region is dispensable for lymphocyte development and ILC2 function. (AC) The numbers and GATA3 expression of thymocyte subpopulations (A), splenic lymphocytes (B), and lung ILC (C) in steady-state conditions. DN1: Lin1Thy1+CD44+CD25 cells, DN2: Lin1Thy1+CD44+CD25+ cells, DN3: Lin1Thy1+CD44CD25+ cells, DN4: Lin1Thy1+CD44CD25 cells, DP:CD4+CD8+ cells, CD8SP: CD4CD8+ cells, CD4SP: CD4+ CD8 cells. Lin1: CD3ε, CD4, CD8, TCRγδ, DX5. CD4: CD3ε+CD4+CD8CD19 cells, CD8: CD3ε+CD4CD8+CD19 cells, CD19: CD3εCD19+ cells. ILC: CD45+Lin2CD90+ cells. Lin2: B220, CD3ε, CD4, CD5, CD8, CD11b, CD11c, CD19, Gr-1, NK1.1, Ter119. (DH) mG900KO mice and littermate WT mice were subjected to papain-induced allergic airway inflammation as described in SI Appendix, Fig. S4A. The cell distribution of the BALF (D) and lung (EG) and GATA3 levels of lung ST2+ILC2s (H) were shown. (I) Single-cell suspensions of the lung were stimulated with PMA/ionomycin in the presence of monensin for 3 h. Intracellular cytokine staining for IL-5 and IL-13 in ILC2 was performed. The data were representative of two independent experiments. n = 5, each genotype (AC), and n = 3 for untreated mice, n = 4 for papain-induced WT mice, n = 8 for papain-induced mG900KO mice (DI). Dot plots are shown as mean ± SE. Statistical analysis was performed with Welch’s t test.
Fig. 3.
Fig. 3.
The mG900 region is crucial for HDM-induced allergic airway inflammation and Th2 differentiation in vivo. mG900KO mice and littermate WT mice were sensitized and challenged with HDM as described in SI Appendix, Fig. S4B. (A and B) Cell distribution in the BALF (A) and lung (B). The data for untreated mice were shared with Fig. 2 D and E. (C) Serum total IgE and HDM-specific IgE at day 13. (D and E) Hematoxylin–eosin (D) and PAS (E) staining of the left lower lobe and quantitative data. (F and G) Master transcription factor expression in lung CD4+ T cells. Red: mG900KO; black: littermate WT. (H) Single-cell suspensions of the lung were stimulated with PMA/ionomycin in the presence of monensin for 5 h. Representative intracellular IL-4 vs. IL-17A staining of lung CD4+ T cells and the frequencies of IFN-γ-, IL-4-, and IL-17A-producing cells are shown. (A, B, F, and G) The data were representative of three independent experiments, n = 7. (C) The data were representative of two independent experiments, n = 3 to 4. (D, E, and H) The data were representative of two independent experiments. n = 3 for untreated mice, n = 4 for HDM-induced WT mice, and n = 5 for HDM-induced mG900KO mice. (AH) Dot plots are shown as mean ± SE. Statistical analysis was performed with Welch’s t test, *P < 0.05, **P < 0.01, and ***P < 0.001.
Fig. 4.
Fig. 4.
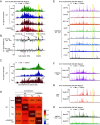
(A-D) The mG900 region contacts the GATA3 promoter and enhancers in Th2 cells. 4C-seq analysis for naive CD4+ T cells and cultured Th0/Th2 cells using the Gata3-TSS (A and B) and the region 932 kb downstream from Gata3-TSS, which is located in the mG900 region (C) as indicated baits. (A and C) UCSC tracks of 4C signal interaction. Black bars indicate significant interacting regions identified using w4Cseq. (B) Subtracted 4C-signal differences. (D) Similarity of 4C-signal interactions of (A) assessed by Spearman’s correlation. Cis-interaction: within chromosome 2. (E) UCSC tracks of ChIP-seq of GATA3 (GSE109109), STAT6 (GSE22104), BCL11B (GSE109109), BATF (GSE85172), IRF4 (GSE85172), ETS1 (GSE20898), cohesion (GSE66343), and CTCF(GSE66343) in cultured Th2 cells. (F) UCSC tracks of H3K27ac ChIP-seq of Gata3-WT and Gata3-KO Th2 cells (GSE237916). (G) UCSC tracks of p300 ChIP-seq of Stat6-WT and Stat6-KO Th2 cells (GSE40463). (H) UCSC tracks of MED12 ChIP-seq of Batf-WT and Batf-KO T cells under Th0 + IL-6 conditions (GSE123198). (AC) Red rectangles indicate the bait position. (AC and EH) Yellow rectangles indicate the mG900 region.

References

    1. Papi A., Brightling C., Pedersen S. E., Reddel H. K., Asthma. Lancet 391, 783–800 (2018). - PubMed
    1. Tindemans I., Serafini N., DiSanto J. P., Hendriks R. W., GATA-3 function in innate and adaptive immunity. Immunity 41, 191–206 (2014). - PubMed
    1. Zhu J., GATA3 regulates the development and functions of innate lymphoid cell subsets at multiple stages. Front. Immunol. 8, 1–8 (2017). - PMC - PubMed
    1. Nakayama T., et al. , Th2 cells in health and disease. Annu. Rev. Immunol. 35, 53–84 (2017). - PubMed
    1. Walker J. A., McKenzie A. N. J., TH2 cell development and function. Nat. Rev. Immunol. 18, 121–133 (2018). - PubMed