. 2024 Jun 28;10(26):eadk1296.
doi: 10.1126/sciadv.adk1296. Epub 2024 Jun 26.

The annotation of GBA1 has been concealed by its protein-coding pseudogene GBAP1

Affiliations

The annotation of GBA1 has been concealed by its protein-coding pseudogene GBAP1

Emil K Gustavsson et al. Sci Adv. .

Abstract

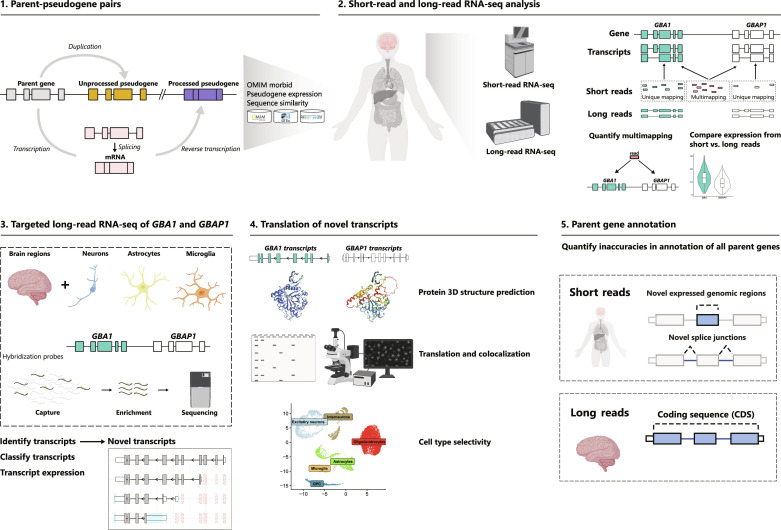
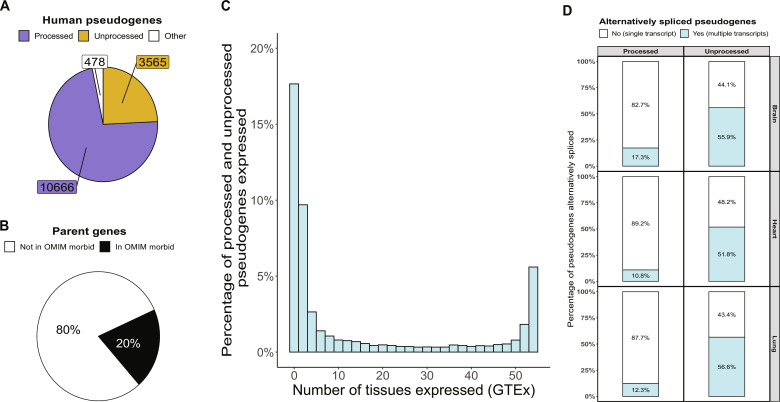
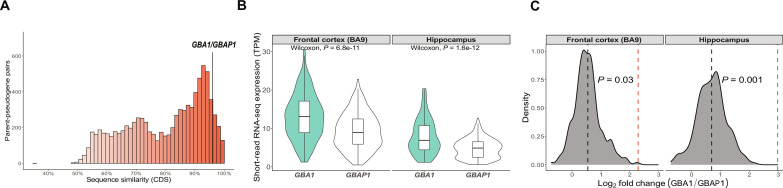
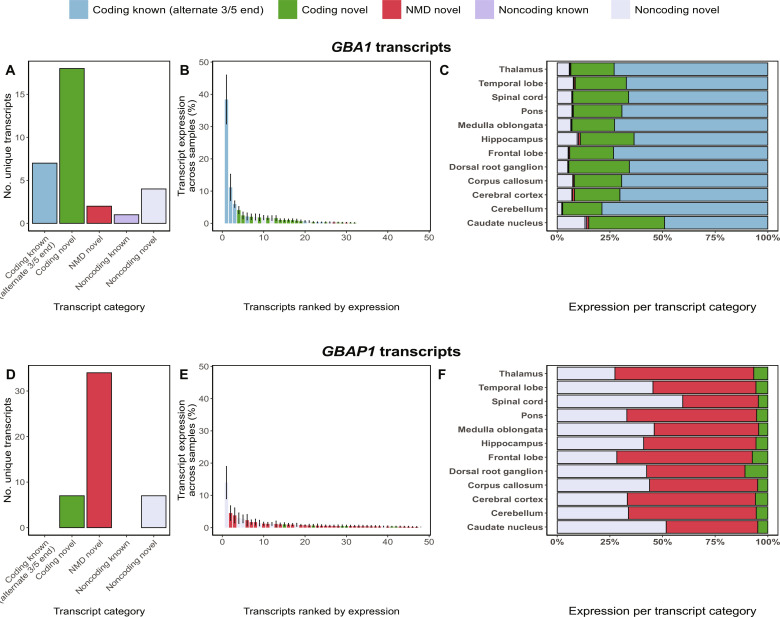
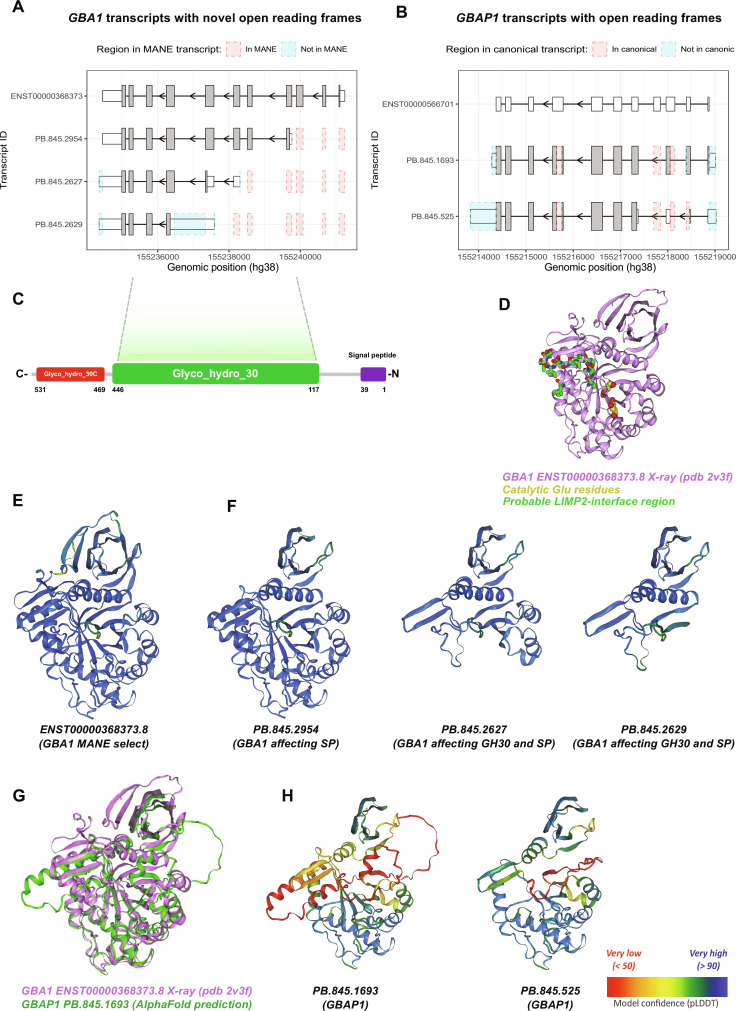
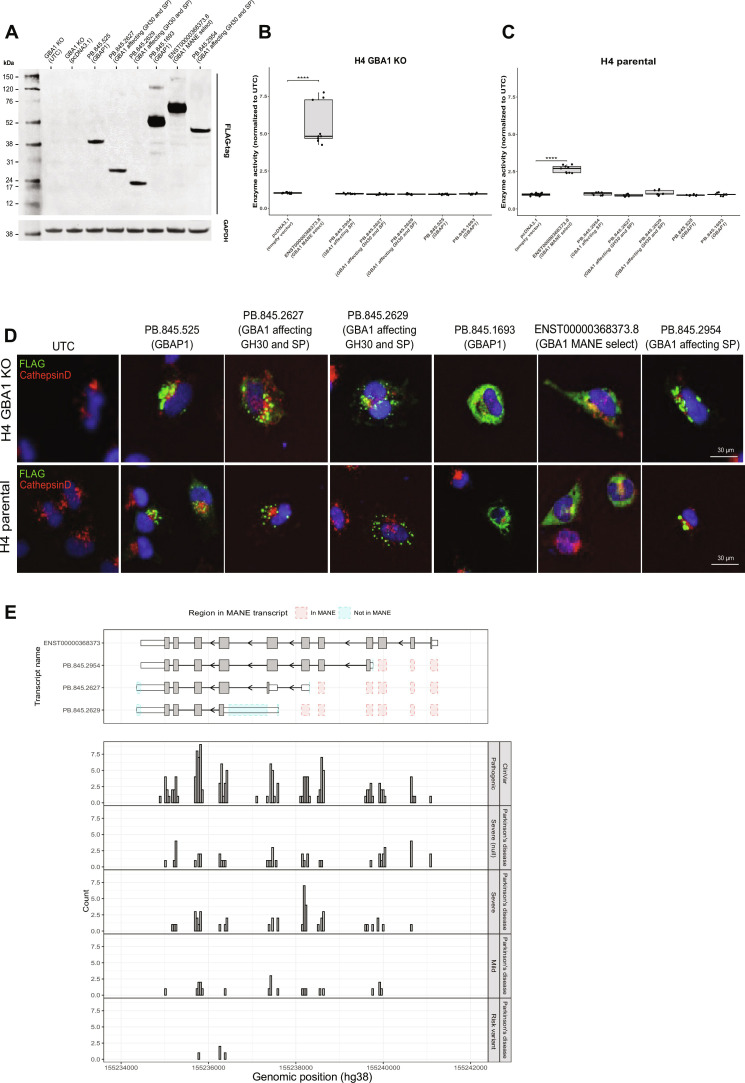
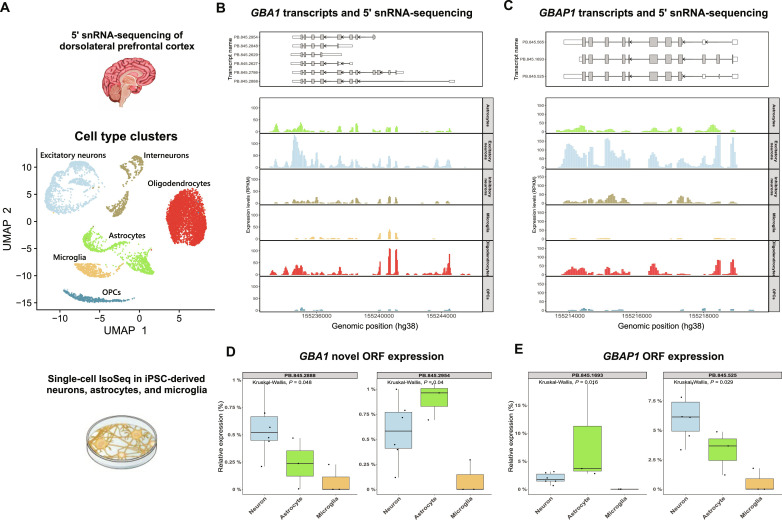
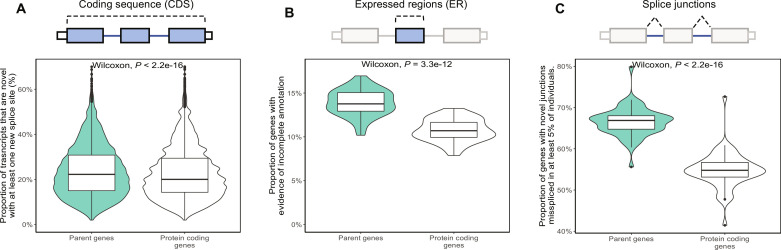
Mutations in GBA1 cause Gaucher disease and are the most important genetic risk factor for Parkinson's disease. However, analysis of transcription at this locus is complicated by its highly homologous pseudogene, GBAP1. We show that >50% of short RNA-sequencing reads mapping to GBA1 also map to GBAP1. Thus, we used long-read RNA sequencing in the human brain, which allowed us to accurately quantify expression from both GBA1 and GBAP1. We discovered significant differences in expression compared to short-read data and identify currently unannotated transcripts of both GBA1 and GBAP1. These included protein-coding transcripts from both genes that were translated in human brain, but without the known lysosomal function-yet accounting for almost a third of transcription. Analyzing brain-specific cell types using long-read and single-nucleus RNA sequencing revealed region-specific variations in transcript expression. Overall, these findings suggest nonlysosomal roles for GBA1 and GBAP1 with implications for our understanding of the role of GBA1 in health and disease.


Figures

Fig. 1.
Fig. 1.. Scheme of data generation and analysis overview.
Schematics outlining the methodological framework used in this study.
Fig. 2.
Fig. 2.. Pseudogenes are frequent and expressed across human tissues.
(A) Pie chart showing the number of annotated pseudogenes that represent processed, unprocessed, or other pseudogenes. Other pseudogenes include unitary, IG (inactivated immunoglobulin), and TR (T cell receptor) pseudogenes. (B) Pie chart depicting the percentage of parent genes that are OMIM disease genes (https://omim.org). (C) Histogram showing tissue expression of pseudogenes as assessed using uniquely mapping reads (generated by the GTEx Consortium, v8). (D) Stacked bar chart depicting alternative splicing of pseudogenes using untargeted long-read RNA-seq data from ENCODE (https://www.encodeproject.org/rna-seq/long-read-rna-seq/), including 29 samples from brain (n = 9), heart (n = 16), and lung (n = 6).
Fig. 3.
Fig. 3.. High sequence similarity causes inaccuracies in GBA1 and GBAP1 expression.
(A) Histogram depicting sequence similarity of parent-pseudogene pairs across coding sequences (CDSs). GBA1 and GBAP1 96% sequence similarity. (B) Expression in transcripts per million (TPM) of GBA1 and GBAP1 from GTEx using gene-level expression measures (10 November 2021, v8). (C) Density plot of log2 fold change of GBA1 (numerator) and GBAP1 (denominator) from GTEx using gene-level expression measures (10 November 2021, v8). The black dotted line represents the mean log2 fold change of GBA1 and GBAP1 using GTEx-derived data, while the red dotted line represents the log2 fold change generated through direct cDNA Oxford Nanopore Technologies (ONT) sequencing from pooled human frontal cortex (n = 26) and hippocampus (n = 27) (total library size: 42.7 million and 48.04 million reads, respectively).
Fig. 4.
Fig. 4.. Targeted long-read RNA-seq of GBA1 and GBAP1 identifies frequent novel transcription.
(A) Bar chart depicting the number of unique GBA1 transcripts identified per transcript category through targeted long-read RNA-seq across 12 human brain regions. (B) Normalized expression per GBA1 transcript corresponding to the percentage of expression per transcript out of total expression of the loci. (C) Stacked bar chart showing expression per transcript category of GBA1 across 12 human brain regions. (D) Bar chart depicting the number of unique GBAP1 transcripts identified per transcript category through targeted long-read RNA-seq across 12 human brain regions. (E) Normalized expression per GBAP1 transcript corresponding to the percentage of expression per transcript out of total expression of the loci. (F) Stacked bar chart showing the expression per transcript category of GBAP1 across 12 human brain regions.
Fig. 5.
Fig. 5.. Novel proteincoding transcripts of GBA1 and GBAP1 share a similar structure at the C terminus but with partial or full loss of key domains.
(A) Novel coding GBA1 transcripts plotted using ggtranscript with differences as compared to MANE select (ENST00000368373) highlighted in blue and red. (B) Novel predicted coding GBAP1 transcripts plotted using ggtranscript with differences as compared to ensemble canonical (ENST00000566701) highlighted in blue and red. (C) Schematic representation of GBA1 with the signal peptide (amino acids 1 to 39), glyco_hydro_30 (amino acids 117 to 446), and glycol_hydro_30C (amino acids 469 to 531). (D) X-ray structure of GBA1 (PDB 2v3f), with catalytic Glu residues highlighted in yellow and probable LIMP-2 interface region highlighted in purple. (E) AlphaFold2 predictions of GBA1 MANE select (ENST00000368373) and (F) the three most highly expressed novel protein-coding GBA1 isoforms colored by prediction confidence score (pLDDT). (G) X-ray structure of GBA1 (PDB 2v3f) (violet) superimposed on AlphaFold2 predicted structure of the longer ORF generated by GBAP1 PB.845.1693 (green). (H) AlphaFold2 predictions of the two most highly expressed novel protein-coding GBAP1 isoforms colored by prediction confidence score (pLDDT).
Fig. 6.
Fig. 6.. Novel GBA1 and GBAP1 transcripts are translated with no GCase activity and impaired lysosomal colocalization with implications for variant interpretation.
(A) Immunoblot of H4 GBA1(−/−/−) knockout cells transiently transfected with GBA1 and GBAP1 constructs containing a C-terminal FLAG-tag. GBA1 and GBAP1 expression was detected using FLAG-tag antibody. GAPDH was used as a loading control. The predicted protein sizes are as follows: PB.845.525 (GBAP1; 321 amino acids; 35 kDa), PB.845.2627 (GBA1 affecting GH30 and SP; 219 amino acids; 24 kDa), PB.845.2629 (GBA1 affecting GH30 and SP; 164 amino acids; 18 kDa), PB.845.1693 (GBAP1; 399 amino acids; 44 kDa), ENST00000368373 (GBA1 MANE select; 537 amino acids; 62 kDa), and PB.845.2954 (GBA1 affecting GH30 and SP; 414 amino acids; 46 kDa). (B) Lysosomal enzyme assay of H4 GBA(−/−/−) knockout cells transiently transfected with GBA1 and GBAP1 constructs (C) and in H4 parental. GCase enzyme activity was significantly increased only in H4 parental and GBA(−/−/−) knockout cells transiently transfected with the GBA1 full-length construct (ENST00000368373), compared to the empty vector control (n = 3). (D) Lysosomal colocalization is impaired in novel GBA1 and GBAP1 transcripts. Immunohistochemistry of H4 parental and GBA1(−/−/−) knockout (KO) cells transiently transfected with GBA1 and GBAP1 constructs containing a C-terminal FLAG-tag. Colocalization of GBA1-FLAG and GBAP1-FLAG (green) with CathepsinD (red) was detected using FLAG-tag antibody. (E) Pathogenic GBA1 variants from ClinVar and risk variants from the GBA1-PD browser, which include variants described in PD, annotated onto novel coding GBA1 transcripts plotted using ggtranscript with differences as compared to MANE select (ENST00000368373) highlighted in blue and red.
Fig. 7.
Fig. 7.. Novel protein coding transcripts of GBA1 and GBAP1 show cell type–selective usage.
(A) Uniform manifold approximation and projection labeled by characterized cell types in human DLPFC. (B) GBA1 expression from 5′ snRNA-seq of human DLPFC. (C) GBAP1 expression from 5′ snRNA-seq of human DLPFC. (D) Expression of GBA1 ORFs from PacBio Iso-Seq data generated from human iPSC-derived cortical neuron (n = 6), astrocyte (n = 3), and microglia (n = 3) cultures. (E) Expression of GBAP1 ORFs from PacBio Iso-Seq data generated from human iPSC-derived cortical neuron (n = 6), astrocyte (n = 3), and microglia (n = 3) cultures.
Fig. 8.
Fig. 8.. Inaccuracies in annotation are common for parent genes on a genome-wide scale.
(A) Proportion of transcripts per parent gene and per protein-coding gene without a pseudogene with a novel splice site from long-read RNA-seq data of nine frontal cortex samples. (B) Proportion of genes with evidence of incomplete annotation based on the identification of novel expressed genomic regions from short-read RNA-seq data. (C) Proportion of genes with evidence of incomplete annotation based on the identification of novel splice junctions found in at least 5% of samples from short-read RNA-seq data.

References

    1. Ebbert M. T. W., Jensen T. D., Jansen-West K., Sens J. P., Reddy J. S., Ridge P. G., Kauwe J. S. K., Belzil V., Pregent L., Carrasquillo M. M., Keene D., Larson E., Crane P., Asmann Y. W., Ertekin-Taner N., Younkin S. G., Ross O. A., Rademakers R., Petrucelli L., Fryer J. D., Systematic analysis of dark and camouflaged genes reveals disease-relevant genes hiding in plain sight. Genome Biol. 20, 1–23 (2019). - PMC - PubMed
    1. Pei B., Sisu C., Frankish A., Howald C., Habegger L., Mu X. J., Harte R., Balasubramanian S., Tanzer A., Diekhans M., Reymond A., Hubbard T. J., Harrow J., Gerstein M. B., The GENCODE pseudogene resource. Genome Biol. 13, 1–26 (2012). - PMC - PubMed
    1. Toffoli M., Chen X., Sedlazeck F. J., Lee C. Y., Mullin S., Higgins A., Koletsi S., Garcia-Segura M. E., Sammler E., Scholz S. W., Schapira A. H. V., Eberle M. A., Proukakis C., Comprehensive short and long read sequencing analysis for the Gaucher and Parkinson’s disease-associated GBA gene. Commun. Biol. 5, 1–10 (2022). - PMC - PubMed
    1. Deschamps-Francoeur G., Simoneau J., Scott M. S., Handling multi-mapped reads in RNA-seq. Comput. Struct. Biotechnol. J. 18, 1569–1576 (2020). - PMC - PubMed
    1. Weinreb N. J., Brady R. O., Tappel A. L., The lysosomal localization of sphingolipid hydrolases. Biochim. Biophys. Acta 159, 141–146 (1968). - PubMed

Publication types