. 2024 Jun 28;10(26):eadn4508.
doi: 10.1126/sciadv.adn4508. Epub 2024 Jun 26.

Lactate transported by MCT1 plays an active role in promoting mitochondrial biogenesis and enhancing TCA flux in skeletal muscle

Affiliations

Lactate transported by MCT1 plays an active role in promoting mitochondrial biogenesis and enhancing TCA flux in skeletal muscle

Lingling Zhang et al. Sci Adv. .

Abstract

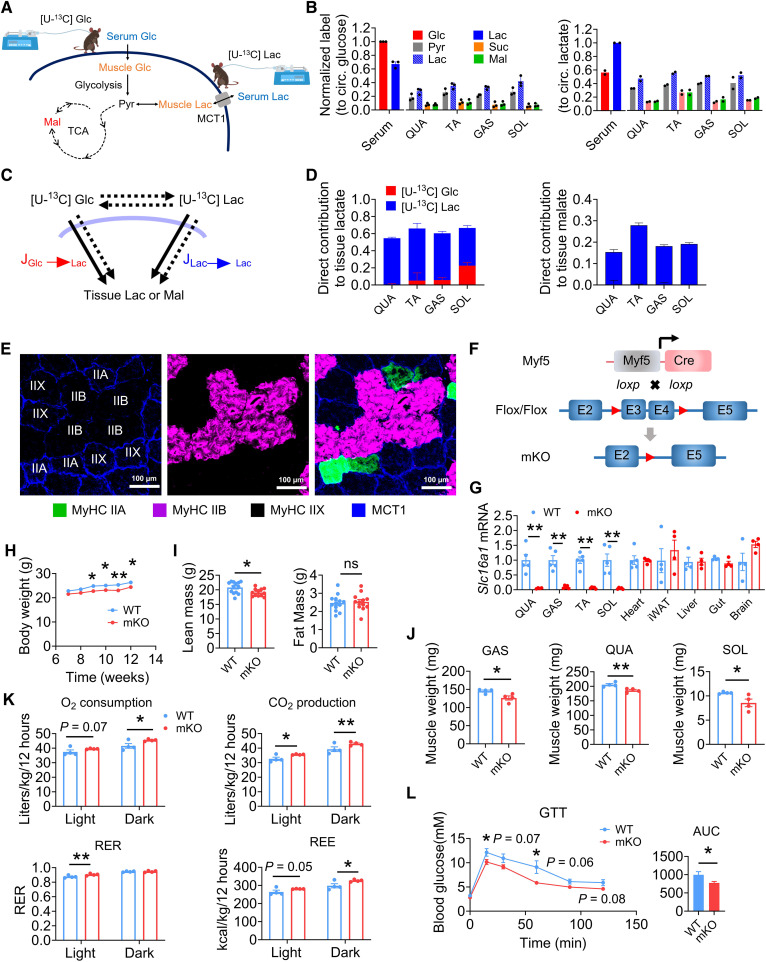
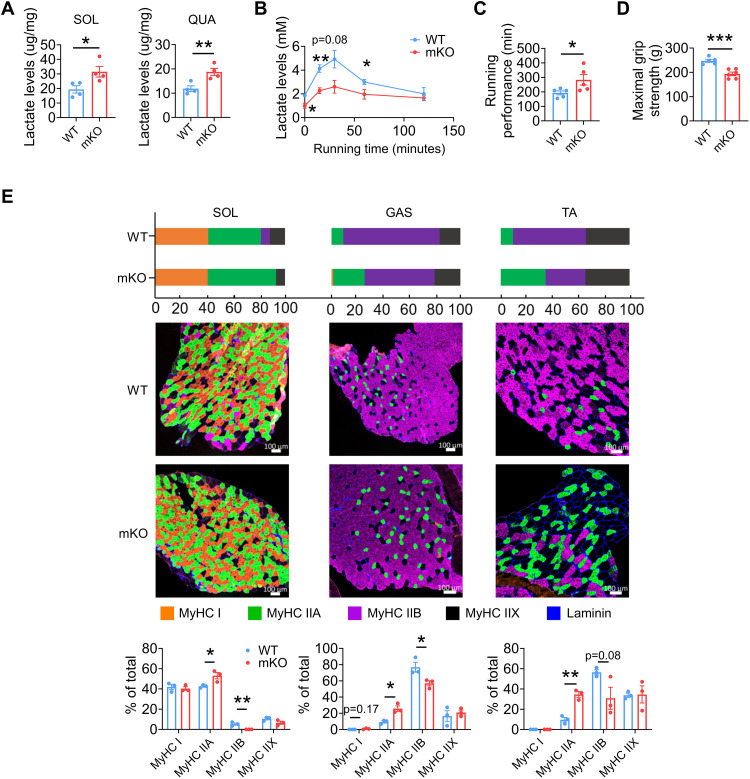
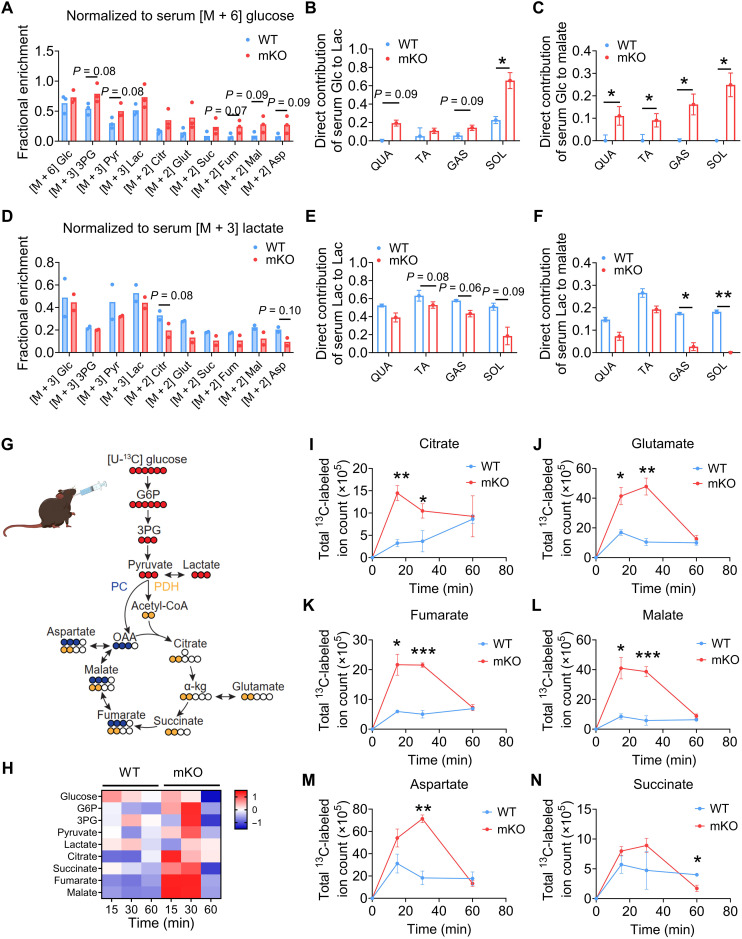
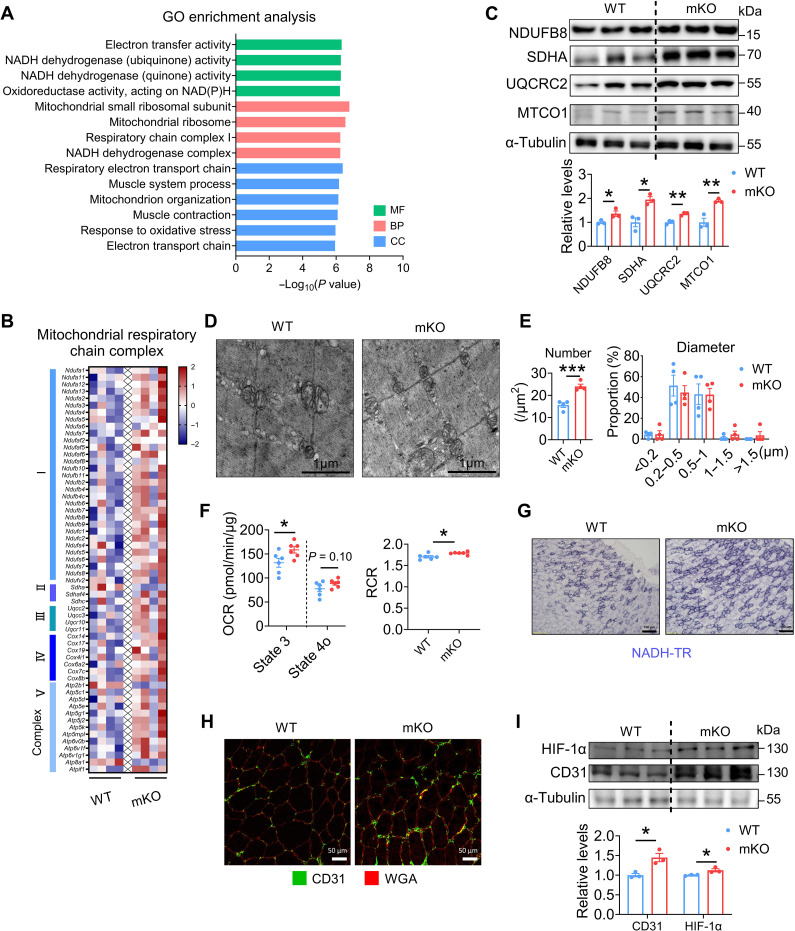
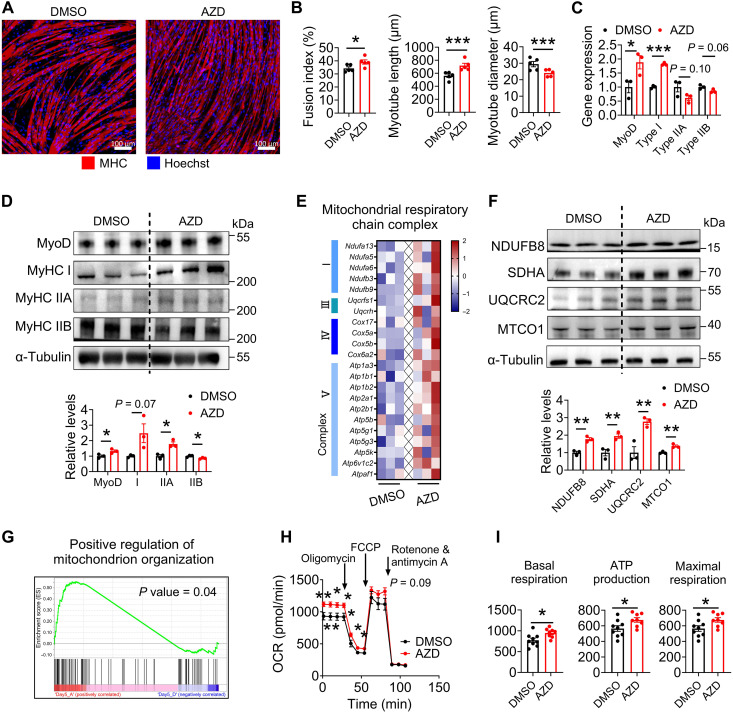
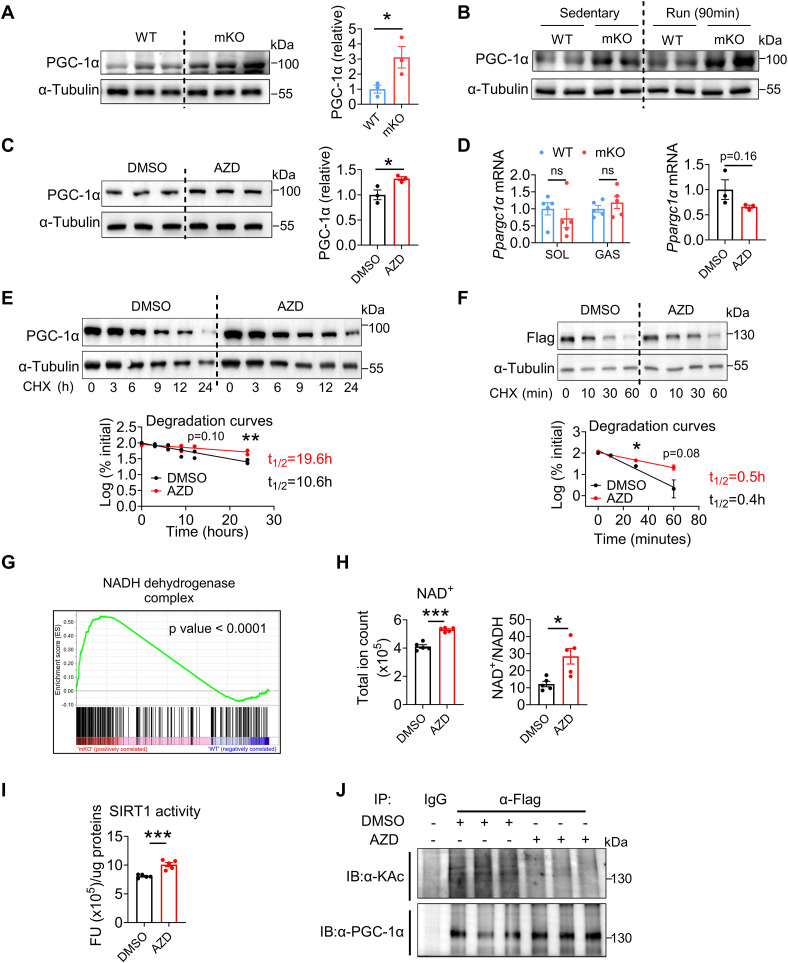
Once considered as a "metabolic waste," lactate is now recognized as a major fuel for tricarboxylic acid (TCA) cycle. Our metabolic flux analysis reveals that skeletal muscle mainly uses lactate to fuel TCA cycle. Lactate is transported through the cell membrane via monocarboxylate transporters (MCTs) in which MCT1 is highly expressed in the muscle. We analyzed how MCT1 affects muscle functions using mice with specific deletion of MCT1 in skeletal muscle. MCT1 deletion enhances running performance, increases oxidative fibers while decreasing glycolytic fibers, and enhances flux of glucose to TCA cycle. MCT1 deficiency increases the expression of mitochondrial proteins, augments cell respiration rate, and elevates mitochondrial activity in the muscle. Mechanistically, the protein level of PGC-1α, a master regulator of mitochondrial biogenesis, is elevated upon loss of MCT1 via increases in cellular NAD+ level and SIRT1 activity. Collectively, these results demonstrate that MCT1-mediated lactate shuttle plays a key role in regulating muscle functions by modulating mitochondrial biogenesis and TCA flux.


Figures

Fig. 1.
Fig. 1.. Metabolic phenotype of mice with deletion of Slc16a1 in skeletal muscle.
(A) Schematic showing metabolic pathways of glucose and lactate between blood and skeletal muscle in mice after infusion of [U-13C] glucose or [U-13C] lactate. (B) Normalized labeling from 2.5-hour [U-13C] glucose or [U-13C] lactate infusion of glycolytic products in QUA, TA, GAS, and SOL. n = 2 to 3. (C) Schematic of TCA intermediates, for example, malate, produced from [U-13C] glucose or [U-13C] lactate by jugular vein catheterizing in tissues. (D) Direct sources of muscle lactate and malate from circulatory labeled glucose and lactate. n = 2 to 3. (E) Immunofluorescence staining of MCT1 (blue) with muscle fiber markers for type IIA (green, recognized by anti-MyHC IIA), type IIB (purple, recognized by anti-MyHC IIB), and type IIX (unstained). Scale bars, 100 μm. (F) Scheme showing the strategy of generating mouse with Slc16a1 deletion in skeletal muscle (mKO). (G) Slc16a1 mRNA levels in different tissues of the mice. n = 5 for each group. (H) Body weight curves of the mice fed with normal chow diet. n = 10 to 11 for each group. (I) Quantification of body lean mass and fat mass by magnetic resonance imaging. n = 12 to 13 for each group. (J) Weight of different skeletal muscles. n = 4 for each group. (K) Results of metabolic cages to quantitate O2 consumption, CO2 production, respiratory exchange ratio (RER), and resting energy expenditure (REE) of the mice in light period (7:00 a.m. to 19:00 p.m.) and dark period (19:00 p.m. to 7:00 a.m.). n = 4 for each group. (L) Glucose tolerance test (GTT) of the mice with corresponding area under curve (AUC). n = 6 to 8 for each group. All data are shown as mean ± SEM. *P < 0.05, **P < 0.01, and ns for nonsignificant. Glc, glucose; Pyr, pyruvate; Lac, lactate; Citr, citrate; Suc, succinate; Mal, malate.
Fig. 2.
Fig. 2.. Deletion of Slc16a1 in skeletal muscle affects lactate level, improves running performance, and promotes formation of oxidative myofibers.
(A) Lactate level in SOL and QUA muscles. n = 4 for each group. (B) Blood lactate level in running mice. n = 5 for each group. (C) Total running time of exhausted exercise. n = 5 for each group. (D) Maximal grip strength of the mice. n = 5 to 6 for each group. (E) Immunofluorescence staining of fiber types in SOL, GAS, and TA muscles. The top histogram represents mean proportions of each type of fibers. The middle are representative immunostaining images for MyHC I (type I, orange), MyHC IIA (type IIA, green), MyHC IIB (type IIB, purple), and MyHC IIX (type IIX, unstained). Laminin (blue) was stained for visualization of the myofiber boundaries. Quantitation of the data is shown in the bottom. Scale bars, 100 μm. n = 3 for each group. All data are shown as mean ± SEM. *P < 0.05, **P < 0.01, and ***P < 0.001.
Fig. 3.
Fig. 3.. Deletion of Slc16a1 in skeletal muscle promotes glycolytic and TCA fluxes of the mice.
(A) Fractional enrichment of glycolytic and TCA intermediates in SOL muscle after infusion of the tracer, as normalized to serum [U-13C] glucose (with [U-13C] glucose infusion). n = 3 for each group. (B and C) Direct contribution of serum [U-13C] glucose to lactate (B) and malate (C) in different skeletal muscles. n = 3 for each group. (D) Fractional enrichment of glycolytic and TCA intermediates in SOL muscle after infusion of the tracer, as normalized to [U-13C] lactate (with [U-13C] lactate infusion). n = 2 for each group. (E and F) Direct contribution of serum [U-13C] lactate to lactate (E) and malate (F) of different skeletal muscles. n = 2 for each group. (G) Schematic of glucose flux via glycolysis and TCA cycle in skeletal muscles via gavaging 13C-labeled glucose. (H) Heatmap showing total 13C-labled ion count of major metabolites from glycolysis and TCA cycle in SOL muscle of the mice. n = 3 for each group. (I to N) Total ion counts of 13C-labeled metabolites of TCA cycle in SOL muscle, including citrate (I), glutamate (J), fumarate (K), malate (L), aspartate (M), and succinate (N). n = 3 for each group. All data are shown as mean ± SEM. *P < 0.05, **P < 0.01, and ***P < 0.001. Glc, glucose; 3PG, 3-phosphoglycerat; Pyr, pyruvate; Lac, lactate; Citr, citrate; Glut, glutamate; Suc, succinate; Fum, fumarate; Mal, malate; Asp, aspartate.
Fig. 4.
Fig. 4.. Inhibition of MCT1 in C2C12 myotubes by AZD3965 enhances glycolytic and TCA fluxes.
(A) Intracellular and extracellular lactate levels of C2C12 myoblasts treated with 1 μM AZD3965 or 0.1% of dimethyl sulfoxide (DMSO). n = 6 for each group. (B) Schematic showing metabolic fate of [U-13C] glucose. (C to F) Total ion counts of [M + 6] and [M + 3] glycolytic intermediates/products from [U-13C] glucose tracing in C2C12 myotubes at different time points. The metabolites include [M + 6] G6P (C), [M + 3] 3PG (D), [M + 3] pyruvate (E), and [M + 3] lactate (F). n = 3 for each group. (G) Schematic showing metabolic fate of pyruvate originated from [U-13C] glucose in TCA cycle via PDH. (H to M) Total ion counts of [M + 2] TCA intermediates in C2C12 myotubes, including citrate (H), alpha-ketoglutarate (α-kg) (I), succinate (J), fumarate (K), malate (L), and aspartate (M). n = 3 for each group. (N) Schematic showing metabolic fate of pyruvate originated from [U-13C] glucose in TCA cycle via PC. (O to Q) Total ion counts of [M + 3] TCA intermediates, including fumarate (O), malate (P), and aspartate (Q). n = 3 for each group. All data are shown as mean ± SEM. *P < 0.05, **P < 0.01, and ***P < 0.001. AZD, AZD3965; Glc, glucose; G6P, glucose-6-phosphate; 3PG, 3-phosphoglycerat; Pyr, pyruvate; Lac, lactate.
Fig. 5.
Fig. 5.. Slc16a1-deleted skeletal muscle has enhanced mitochondrial biogenesis.
(A) GO enrichment analysis of all differentially expressed genes in GAS muscle between WT and mKO mice. n = 4 for each group. BP, biological process; CC, cellular component; MF, molecular function. (B) Heatmap of differentially expressed genes related to respiratory complex in GAS muscle. n = 4 for each group. (C) Immunoblots of representative proteins involved in mitochondrial electron transport chain. Quantitation of the data is shown in the bottom. (D and E) TEM analysis of GAS muscle. Representative images of TEM are shown in (D), and the calculated number and diameter of the mitochondria are shown in (E). Scale bar, 1 μm. n = 4 for each group. (F) Analysis of oxidative capacity of isolated mitochondria in GAS from the mice. OCR of isolated mitochondria is shown following the treatment (left). Relative state 3 (adenosine diphosphate–stimulated OCR), state 4o (oligomycin inhibited OCR), as well as the respiratory control ratio (RCR) are indicated (right). n = 6 for each group. (G) NADH dehydrogenase activity stains in GAS muscles of WT and mKO mice. Scale bars, 100 μm. (H) Immunostaining for capillary density using CD31 (green) in TA muscle. Wheat germ agglutinin (WGA; red) was stained for visualization of myofiber boundary. Scale bars, 50 μm. (I) Immunoblots of CD31 and HIF-1α. Quantitation of the result is shown on the right. All data are shown as mean ± SEM. *P < 0.05, **P < 0.01, and ***P < 0.001.
Fig. 6.
Fig. 6.. Inhibition of MCT1 in C2C12 cells improves mitochondrial functions.
(A) Immunostaining for MHC (red) and nuclei (blue) in differentiated C2C12 cells treated with 1 μM AZD3965 or 0.1% of DMSO. Scale bars, 100 μm. (B) Measurement of myotube parameters with the C2C12 myotubes as in (A). n = 5 for each group. (C) mRNA levels of myotube differentiation marker (MyoD) and isoforms of MyHC in differentiated C2C12 cells. Fiber markers of type I, type IIA, and type IIB are Myh7, Myh2, and Myh4, respectively. n = 3 for each group. (D) Immunoblots of MyoD and MyHC isoforms in differentiated C2C12 myotubes. Fibers of type I, type IIA, and type IIB were identified antibodies against MyHC I, MyHC IIA, and MyHC IIB, respectively. Quantitation of the result is shown in the bottom. (E) Heatmap to show differentially expressed genes of the respiratory complex in differentiated C2C12 cells. n = 3 for each group. (F) Immunoblots of representative proteins of the respiratory complex in differentiated C2C12 cells. Quantitation of the result is shown in the bottom. (G) GSEA of the differentially expressed genes with a GO term “positive regulation of mitochondrion organization.” (H and I) Analysis of oxidative capacity of C2C12 myotubes. OCR is shown following addition of different compounds (H). Basal respiration, ATP production, and maximal respiration are shown individually (I). n = 8 to 9 for each group. All data are shown as mean ± SEM. *P < 0.05, **P < 0.01, and ***P < 0.001. AZD, AZD3965.
Fig. 7.
Fig. 7.. Elevation of PGC-1α protein by loss/inhibition of MCT1 in skeletal muscle and C2C12 myotubes.
(A) Immunoblot of PGC-1α in GAS muscle. Quantitation of the result is shown on the right. n = 3 for each group. (B) Immunoblot of PGC-1α in GAS muscle of the mice under sedentary and running conditions. n = 2 for each group. (C) Immunoblot of PGC-1α in C2C12 myotubes. Quantitation of the result is shown in the right panel. n = 3 for each group. (D) Ppargc1a mRNA level in mice muscles (left) and C2C12 myotubes (right). (E) Degradation rate of endogenous PGC-1α protein in C2C12 myoblasts upon treatment with CHX for different length of times. (F) Degradation rate of exogenously expressed PGC-1α protein in C2C12 myoblasts. The pixels for each band were adjusted by α-tubulin. Adjusted data were measured and normalized so that the number of pixels at t = 0 was 100%. The log10 value of the percentage of pixels was plotted versus time for each time point, and the half-time (t1/2) was calculated from the log of 50% [bottom for (E and F)]. (G) GSEA of the differentially expressed genes between WT and mKO GAS muscles with a GO term “NADH dehydrogenase complex.” (H) NAD+ level and ratio of NAD+/NADH in C2C12 myotubes treated with or without AZD3965. (I) SIRT1 activity in C2C12mtoblasts treated with or without AZD3965. (J) Acetylation of exogenous PGC-1α in C2C12 myoblasts with or without AZD3965 treatment detected by coimmunoprecipitation. IB, immunoblotting; IP, immunoprecipitation. All data are shown as mean ± SEM. *P < 0.05, **P < 0.01, and ***P < 0.001. AZD, AZD3965; CHX, cycloheximide; KAc, lysine acetylation. IgG, immunoglobulin G.
Fig. 8.
Fig. 8.. A working model to depict functions of MCT1 in lactate shuttles in skeletal muscle (generated by BioRender).
Different muscle fibers have distinct lactate transporters with MCT4 expressing in glycolytic muscle fibers and MCT1 expressing in both plasma membrane and mitochondria in oxidative fibers. Cell-cell lactate shuttle between glycolytic fibers and oxidative fibers is mediated by MCT4 and MCT1, while cytosol-mitochondria lactate shuttle in oxidative fibers is mediated by MCT1. Lactate is an important fuel source for the TCA cycle in the mitochondria via MCT1 and mLOC in oxidative fibers. Inside mitochondria, lactate is oxidized to pyruvate by mLDH. Intracellular lactate shuttle is important for modulating NAD+/NADH ratio in the cell. When MCT1 is lost and lactate cannot be shuttled to the mitochondria, conversion of pyruvate to lactate would lead to a net increase of NAD+, as observed in this study. Intracellular lactate shuttle is linked to the compensatory response of mitochondria biogenesis. When cytosol-mitochondria shuttle of lactate is blocked, the fuel supply from the lactate route is insufficient. The cell would sense the insufficiency of fuel to initiate mitochondria biogenesis for compensation. One mechanism could be the increase of NAD+ leading activation of SIRT1 and PGC-1α pathway. In addition, lactate shuttle in the skeletal muscle is associated with exercise performance due to its modulation on mitochondria biogenesis. glu, glucose; pyr, pyruvate; lac, lactate; LDH, lactate dehydrogenase; mLDH, mitochondrial lactate dehydrogenase; mLOC, mitochondrial lactate oxidation complex; MPC, mitochondrial pyruvate carrier.

References

    1. Ferguson B. S., Rogatzki M. J., Goodwin M. L., Kane D. A., Rightmire Z., Gladden L. B., Lactate metabolism: Historical context, prior misinterpretations, and current understanding. Eur. J. Appl. Physiol. 118, 691–728 (2018). - PubMed
    1. Brooks G. A., The lactate shuttle during exercise and recovery. Med. Sci. Sports Exerc. 18, 360–368 (1986). - PubMed
    1. Brooks G. A., The science and translation of lactate shuttle theory. Cell Metab. 27, 757–785 (2018). - PubMed
    1. Brooks G. A., Arevalo J. A., Osmond A. D., Leija R. G., Curl C. C., Tovar A. P., Lactate in contemporary biology: A phoenix risen. J. Physiol. 600, 1229–1251 (2022). - PMC - PubMed
    1. Hui S., Ghergurovich J. M., Morscher R. J., Jang C., Teng X., Lu W., Esparza L. A., Reya T., Le Z., Yanxiang Guo J., White E., Rabinowitz J. D., Glucose feeds the TCA cycle via circulating lactate. Nature 551, 115–118 (2017). - PMC - PubMed

Publication types

MeSH terms

Substances