. 2024 Jul:105:105222.
doi: 10.1016/j.ebiom.2024.105222. Epub 2024 Jun 25.

Exploratory multi-omics analysis reveals host-microbe interactions associated with disease severity in psoriatic skin

Affiliations

Exploratory multi-omics analysis reveals host-microbe interactions associated with disease severity in psoriatic skin

Ying Yang et al. EBioMedicine. 2024 Jul.

Abstract

Background: Psoriasis (Pso) is a chronic inflammatory skin disease that poses both physical and psychological challenges. Dysbiosis of the skin microbiome has been implicated in Pso, yet a comprehensive multi-omics analysis of host-microbe interactions is still lacking. To bridge this gap, we conducted an exploratory study by adopting the integrated approach that combines whole metagenomic shotgun sequencing with skin transcriptomics.

Methods: This was a cross-sectional study, adult patients with plaque-type Psoriasis (Pso) and healthy volunteers were included. Skin microbiota samples and biopsies were collected from both lesional and non-lesional skin areas on the lower back. Weighted Gene Correlation Network Analysis (WGCNA) was employed for co-expression network analysis, and cell deconvolution was conducted to estimate cell fractions. Taxonomic and functional features of the microbiome were identified using whole metagenomic shotgun sequencing. Association between host genes and microbes was analyzed using Spearman correlation.

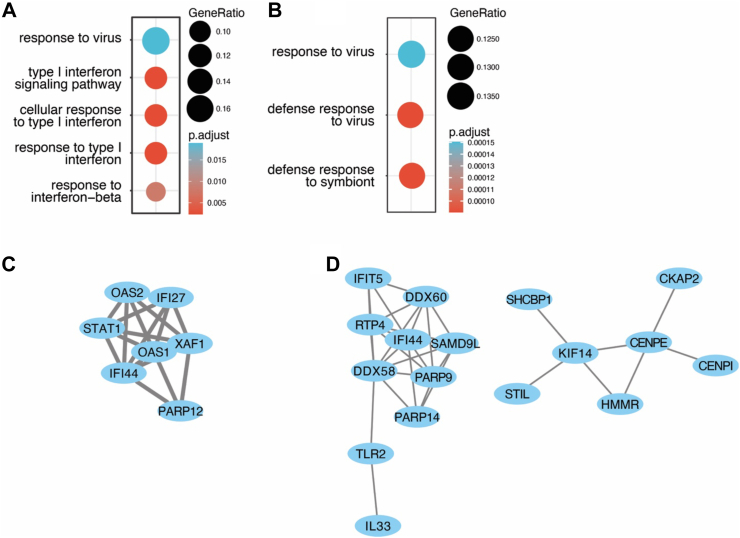
Findings: Host anti-viral responses and interferon-related networks were identified and correlated with the severity of psoriasis. The skin microbiome showed a greater prevalence of Corynebacterium simulans in the PASI severe-moderate groups, which correlated with interferon-induced host genes. Two distinct psoriatic clusters with varying disease severities were identified. Variations in the expression of cell apoptosis-associated antimicrobial peptides (AMPs) and microbial aerobic respiration I pathway may partly account for these differences in disease severity.

Interpretation: Our multi-omics analysis revealed for the first time anti-viral responses and the presence of C. simulans associated with psoriasis severity. It also identified two psoriatic subtypes with distinct AMP and metabolic pathway expression. Our study provides new insights into understanding the host-microbe interaction in psoriasis and lays the groundwork for developing subtype-specific strategies for managing this chronic skin disease.

Funding: The research has received funding from the FP7 (MAARS-Grant 261366) and the Innovative Medicines Initiative 2 Joint Undertaking (JU) under grant agreement No 821511 (BIOMAP). The JU receives support from the European Union's Horizon 2020 research and innovation programme and EFPIA. This publication reflects only the author's view and the JU is not responsible for any use that may be made of the information it contains. GAM was supported by a scholarship provided by CAPES-PRINT, financed by the Coordenação de Aperfeiçoamento de Pessoal de Nível Superior - CAPES (Brazilian Government Agency). The authors thank all patients who participated in our study.

Keywords: Microbiome; Multi-omics; Psoriasis; Skin; Transcriptome.


Conflict of interest statement

Declaration of interests Prof. Homey declared a conflict of interests as described in the ICMJE DISCLOSURE FORM. All the other authors declare no competing interests.

Figures

Fig. 1
Fig. 1
Study outline. Skin tissues and microbiome samples were collected from psoriasis patients and healthy volunteers. Microbial species and functional features were generated using whole-genome metagenomic shotgun sequencing. Gene co-expression and cell fraction matrices were generated using transcriptomic data derived from microarray assays. Integration analysis was performed across different omics layers to better understand host-microbe interactions during the pathogenesis of psoriasis.
Fig. 2
Fig. 2
Gene co-expression network construction for psoriasis lesional, non-lesional, and healthy volunteers. (A) Topological overlap matrix plot and the cluster dendrogram of 1000 randomly selected genes. This plot displays the correlation degree of each module. (B) Modules were further analyzed for functional enrichment using Gene Ontology (GO). (C) Modules were associated with clinical traits. The color indicates the correlation coefficient. Only correlations with a p-value <0.001 are displayed. (D) Modules that correlated positively with the traits were further examined for Protein–Protein Interaction (PPI) networks using the STRING database (V11.5) and visualized with Cytoscape. Hub genes detected by CytoHubba are highlighted in orange. All PPI networks exhibited an enrichment value of p < 1 × 10−10.
Fig. 3
Fig. 3
Host genes correlated with PASI score in psoriasis non-lesional only and lesional only groups. Host genes correlating with the PASI score were further analyzed for functional enrichment using Gene Ontology (GO), by using host genes with absolute Spearman correlation coefficient >0.3 and p-value (FDR adjusted) < 0.05 in the non-lesional only group (A) and by using host genes with p-value (FDR adjusted) < 0.05 in the lesional only group (B). Protein–Protein Interaction (PPI) networks were generated using the same data matrix in the non-lesional only group (C), and the lesional only group (D), by using the STRING database (V11.5) and visualized with Cytoscape. All PPI networks displayed an enrichment value of p < 1 × 10−10.
Fig. 4
Fig. 4
Leukocyte composition and correlation with gene co-expression modules. (A) Prediction of cell fractions from the microarray gene expression matrix was done using CIBERSORTx. The DerM22 cell signature database served as the reference. (B) Boxplots depict differences in immune cell expression deconvoluted via the Cibersort (CS) algorithm, comparing PSO lesional to both non-lesional and healthy volunteers. Within each boxplot, horizontal lines denote median values; boxes extend from the 25th to the 75th percentile of each group's distribution of values. (C) Gene co-expression modules were associated with cell fractions. The color indicates the correlation coefficient. Only correlations with a p-value <0.001 are displayed. PSO LES, psoriasis lesional skin; PSO NLES, psoriasis non-lesional skin; HV: healthy volunteer.
Fig. 5
Fig. 5
C. simulans is enriched in psoriatic lesional skin and associated with host genes related to psoriasis pathomechanisms. (A) The association between skin microbiota and PASI score levels (upper), as well as clinical groups (lower), is presented. This association was assessed using multivariate analysis by linear models (MaAsLin; FDR <0.05). The size and shading of the squares indicate the magnitude of the association. PSO LES, psoriasis lesional skin; PSO NLES, psoriasis non-lesional skin; HV: healthy volunteer. PASI mild: PASI score <7, PASI moderate: 6< PASI score <11, and PASI severe: PASI score >10. See also Figure S6A. (B) Boxplots display differences in C. simulans and C. acnes across varying PASI levels and clinical groups. Within each boxplot, horizontal lines denote median values; boxes extend from the 25th to the 75th percentile of each group's distribution of values. (C) The Spearman correlation between C. acnes and C. simulans with immune cells derived from the Cibersort analysis. The grey shadow refers to the 95% confidence interval. (D) The association between the abundance of C. simulans and C. acnes with the central genes of the turquoise module is shown. The width of edges was proportional to the correlation coefficient, where blue lines indicate inverse correlations and red lines indicate positive correlations. Only edges with a p-value <0.05 are displayed.
Fig. 6
Fig. 6
Psoriasis clusters with distinct microbial metabolic pathways and host genes. (A) The hierarchical dendrogram displays two distinct psoriasis clusters based on microbial gene families. Different colors denote the clusters. Heatmaps summarize microbial functional features (B) and host genes (C) changes within each PSO cluster. Microbial features with more than one count in at least 50% of samples were plotted on the. Features with higher relative abundances are shaded in red, while those with lower relative abundances are shaded in blue. (D) Upregulated host genes within each cluster were further analyzed for functional enrichment using Gene Ontology (GO). (E) Visualization of the host genes, from a comparison between clusters, that exhibited the highest value of mean decrease Gini in the Random Forest (RF) classification. (F) Boxplots illustrate differences in immune cell expression between cluster 1 and cluster 2 by Mann–Whitney U test (p < 0.05). Within each boxplot, horizontal lines denote median values; boxes extend from the 25th to the 75th percentile of each group's distribution of values. (G) Boxplot displays variations in the PASI score between cluster 1 and cluster 2, as assessed by Welch's t-test (p < 0.05). Within each boxplot, horizontal lines denote median values; boxes extend from the 25th to the 75th percentile of each group's distribution of values. (H) Spearman correlation between the metabolic pathway pwy-3781 and host genes. The grey shadow refers to the 95% confidence interval.
Fig. 7
Fig. 7
Psoriasis clusters with distinct enzyme commission categories. (A) Heatmaps summarize the changes in microbial EC categories within each PSO cluster. Microbial features with more than one count in at least 50% of samples were plotted on the. Features with higher relative abundances are shaded in red, while those with lower relative abundances are shaded in blue. Boxplot shows differences in NADH: ubiquinone reductase (H(+)-translocating) (EC 7.1.1.2) (B), Human endogenous retrovirus K endopeptidase (EC 3.4.23.50.) (C), and Ubiquitinyl hydrolase 1 (EC 3.4.19.12.) (D) between cluster 1 and cluster 2. Within each boxplot, horizontal lines denote median values; boxes extend from the 25th to the 75th percentile of each group's distribution of values. (E) Spearman correlation between the EC categories and host genes. The grey shadow refers to the 95% confidence interval.

References

    1. Bu J., Ding R., Zhou L., Chen X., Shen E. Epidemiology of psoriasis and comorbid diseases: a narrative review. Front Immunol. 2022;13 - PMC - PubMed
    1. Parisi R., Symmons D.P., Griffiths C.E., et al. Global epidemiology of psoriasis: a systematic review of incidence and prevalence. J Invest Dermatol. 2013;133(2):377–385. - PubMed
    1. Elder J.T., Bruce A.T., Gudjonsson J.E., et al. Molecular dissection of psoriasis: integrating genetics and biology. J Invest Dermatol. 2010;130(5):1213–1226. - PubMed
    1. Pompili M., Bonanni L., Gualtieri F., Trovini G., Persechino S., Baldessarini R.J. Suicidal risks with psoriasis and atopic dermatitis: systematic review and meta-analysis. J Psychosom Res. 2021;141 - PubMed
    1. Chang H.W., Yan D., Singh R., et al. Alteration of the cutaneous microbiome in psoriasis and potential role in Th17 polarization. Microbiome. 2018;6(1):154. - PMC - PubMed

MeSH terms