. 2024 Jul 11;84(13):2436-2454.e10.
doi: 10.1016/j.molcel.2024.05.030. Epub 2024 Jun 25.

pLxIS-containing domains are biochemically flexible regulators of interferons and metabolism

Affiliations

pLxIS-containing domains are biochemically flexible regulators of interferons and metabolism

Lauren M Landau et al. Mol Cell. .

Abstract

Signal transduction proteins containing a pLxIS motif induce interferon (IFN) responses central to antiviral immunity. Apart from their established roles in activating the IFN regulator factor (IRF) transcription factors, the existence of additional pathways and functions associated with the pLxIS motif is unknown. Using a synthetic biology-based platform, we identified two orphan pLxIS-containing proteins that stimulate IFN responses independent of all known pattern-recognition receptor pathways. We further uncovered a diversity of pLxIS signaling mechanisms, where the pLxIS motif represents one component of a multi-motif signaling entity, which has variable functions in activating IRF3, the TRAF6 ubiquitin ligase, IκB kinases, mitogen-activated protein kinases, and metabolic activities. The most diverse pLxIS signaling mechanisms were associated with the highest antiviral activities in human cells. The flexibility of domains that regulate IFN signaling may explain their prevalence in nature.

Keywords: GMIP; IRSp53; MAVS; MyD88; STING; TASL; TBK1; TRAF6; TRIF; infection; interferon; macrophages; synthetic biology.


Conflict of interest statement

Declaration of interests J.C.K. consults and holds equity in Corner Therapeutics, Larkspur Biosciences, MindImmune Therapeutics, and Neumora Therapeutics. M.H. received research funding from Agilent Technologies and Roche Pharmaceuticals and is on advisory boards for Alixia, MitoQ, and Minovia. M.H. is on the advisory boards of Molecular Cell and Cell Metabolism.

Figures

Figure 1.
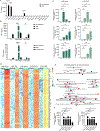
Figure 1.. A synthetic biology-based approach defines the domains of STING, TRIF, MAVS, and TASL sufficient for IFN signaling.
(A) Schematics of: (left) nanomachine containing 4 copies of FKBP fused to pLxIS-containing domain, which is assembled into multimers via B/B to generate IFN responses, and (right) pLxIS-containing domains of STING, TRIF, MAVS, and TASL used in the nanomachines. (B) iBMDMs expressing the FKBP-STING nanomachine were treated with B/B for 0 to 60 min and phospho-TBK1 was analyzed by western blot. (C) iBMDMs expressing the FKBP-STING nanomachine were treated with B/B or transfected poly(dA:dT) for 16 hr and IP-10, IFN-β, or IFN-α release was analyzed by ELISA. (D) iBMDMs expressing the indicated nanomachines were treated with B/B for 16 hr and IP-10 release was analyzed by ELISA or viperin, phospho-STAT1, total STAT1, and FKBP levels were analyzed by western blot. (E-F) iBMDMs expressing the truncated versions of the FKBP-TRIF and FKBP-MAVS nanomachines were treated with B/B for 16 hr and IP-10 release was analyzed by ELISA. (G-H) iBMDMS expressing nanomachines appended with different versions of TASL were treated with B/B for 16 hr and IP-10 release was analyzed by ELISA or viperin, phospho-STAT1, total STAT1, and FKBP levels were analyzed by western blot. (I) iBMDMs expression the TASL-PLPLR chimeric nanomachine were treated with B/B for 30 min and phospho-TBK1 was analyze by western blot. (J) TASL-deficient iBMDMs were reconstituted with WT TASL and treated with R848 or CpG (ODN 1826) for 16 hr and IP-10 release was analyzed by ELISA. (K) MyD88-deficient iBMDMs were reconstituted with FLAG-tagged WT or chimeric versions of TASL and treated with R848 or CpG (ODN 1826) for 16 hr and viperin, phospho-STAT1, total STAT1, and FLAG levels were analyzed by western blot. Each panel is a representative experiment of at least 3 independent repeated experiments. Data in bar graphs are represented as mean ± SEM.
Figure 2.
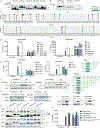
Figure 2.. A genetic screen identifies functional pLxIS-containing domains from IRSp53 and GMIP.
(A) iBMDMs expressing nanomachines containing putative pLxIS-containing domains from the indicated proteins were treated with B/B for 16 hr and IP-10 release was analyzed by ELISA. (B) iBMDMs expressing the FKBP-IRSp53 or FKBP-GMIP nanomachines were treated with B/B, LPS, or CpG ODN 1585 (transfected with DOTAP) for 16 hr and IFN-β or IFN-α release was analyzed by ELISA. (C) iBMDMs expressing the FKBP-IRSp53 or FKBP-GMIP nanomachines were treated with B/B for 0 to 8 hr and Ifnb1, Rsad2, and Cxcl10 expression was analyzed by qPCR. (D-E) iBMDMs expressing the indicated nanomachines were treated with B/B for 0 or 8 hr and analyzed for gene expression by RNA-sequencing. Differential gene expression analysis was performed and (D) the top 70 DEGs for each nanomachine were combined into a union set and visualized via heat map. (E) Over-representation analysis was performed on the DEG lists and common significantly represented pathways were identified and plotted as an emap. (F) iBMDMs expressing the indicated nanomachines were treated with B/B for 8 hr and Ccl5 and Isg15 expression was analyzed by qPCR. Each panel is a representative experiment of at least 3 independent repeated experiments (except panels D-E). Data in bar graphs are represented as mean ± SEM.
Figure 3.
Figure 3.. pLxIS-containing domains are activators and substrates of TBK1 phosphorylation.
(A-B) Recombinant nanomachines were incubated with recombinant GST-tagged TBK1, with or without the addition of λ-phosphatase, for 1 hour at 30°C and FKBP was analyzed by western blot. (C) Recombinant nanomachines were incubated with recombinant GST-tagged TBK1 for 1 hour at 30°C and reaction products were analyzed by LC-MS/MS for phosphopeptides. Phosphorylated residues with ModScores of ≥19 are illustrated within each pLxIS-containing domain. (D) iBMDMs expressing WT or mutant versions of the indicated nanomachines were treated with B/B or LPS for 16 hr and IP-10 release was analyzed by ELISA. (E) (left) iBMDMs expressing WT or truncated versions of the FKBP-IRSp53 or FKBP-GMIP nanomachines were treated with B/B or LPS for 16 hr and IP-10 release was analyzed by ELISA. (right) Schematic depicting the truncations performed on the pLxIS-containing domains from IRSp53 and GMIP. (F) iBMDMs expressing WT or mutant versions of the FKBP-STING or FKBP-MAVS nanomachines were treated with B/B for 30 min and phospho-TBK1 was analyzed by western blot. (G) iBMDMs expressing WT or mutant versions of the FKBP-IRSp53 or FKBP-GMIP nanomachines were treated with B/B for 30 min and phospho-TBK1 was analyzed by western blot. (H) FLAG-tagged nanomachines were immunoprecipitated 30 min after B/B treatment and TBK1 and FKBP levels were analyzed by western blot. (I) iBMDMs expressing the indicated nanomachines were treated with B/B for 30 min and phospho-IRF3 was analyzed by western blot. (J) iBMDMs expressing chimeric versions of the FKBP-STING (RLL361NLV) or FKBP-IRSp53 (NLV265RLL) nanomachines were treated with B/B for 16 hr and IP-10 release was analyzed by ELISA. Each panel is a representative experiment of at least 3 independent repeated experiments (except panel C). Data in bar graphs are represented as mean ± SEM.
Figure 4.
Figure 4.. pLxIS-containing domains induce glycolysis and metabolic activities.
(A) TBK1- or IRF3-deficient iBMDMs expressing the FKBP-IRSp53 or FKBP-GMIP nanomachines were treated with B/B for 16 hr and IP-10 release was analyzed by ELISA. (B) iBMDMs expressing the FKBP-IRSp53 or FKBP-GMIP nanomachines were treated with MRT67307 for 1 hour, then treated with B/B or LPS for 16 hr, and IP-10 release was analyzed by ELISA. (C) iBMDMs expressing the indicated nanomachines were treated with B/B or LPS for 2 hours and extracellular acidification rate (ECAR) was monitored by Seahorse. The vertical dotted line represents addition of B/B or LPS to the media by the Seahorse analyzer. (D) Same as (C) except with TBK-deficient iBMDMs expressing the indicated nanomachines. (E) iBMDMs expressing the indicated nanomachines were treated with B/B for 1 or 24 hrs and the intracellular metabolite levels were measured by metabolomic analysis against a targeted panel. n=5. (F) iBMDMs expressing the indicated nanomachines were pretreated with the indicated inhibitor for 30 min prior to a 16 hr treatment with B/B, and IP-10 release was analyzed by ELISA. (G) Same as (E). Each panel is a representative experiment Each panel is a representative experiment of at least 3 independent repeated experiments (except panels E and G). Data in bar graphs are represented as mean ± SEM.
Figure 5.
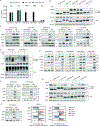
Figure 5.. Direct TRAF6 engagement by select pLxIS-containing domains diversifies downstream signaling pathways.
(A) WT or TRAF6-deficient iFLDMs expressing the indicated nanomachines were treated with B/B for 16 hr and IP-10 release was analyzed by ELISA. (B) FLAG-tagged nanomachines were immunoprecipitated from iBMDMs 30 min after B/B treatment and TRAF6 and FKBP levels were analyzed by western blot. (C) WT or TRAF6-deficient iFLDMs expressing the indicated nanomachines were treated with B/B for 16 hr and viperin, phospho-STAT1, and total STAT1 were analyzed by western blot. (D) FLAG-tagged FKBP-MAVS or FKBP-IRSp53 nanomachines were immunoprecipitated from WT or TRAF6-deficient iFLDMs 30 min after B/B treatment and total ubiquitin and FKBP levels were analyzed by western blot. (E) iBMDMs expressing the indicated nanomachines were treated with B/B or LPS for 30 min and phospho-TBK1, phospho-IKKα/β, phospho-p65, phospho-p38, and phospho-JNK were analyzed by western blot. (F) WT or TRAF6-deficient iFLDMs expressing the FKBP-MAVS or FKBP-IRSp53 nanomachines were treated with B/B for 30 min and phospho-TBK1, phospho-p65, phospho-p38, and phospho-JNK were analyzed by western blot. (G) FLAG-tagged nanomachines were immunoprecipitated from WT or TRAF6-deficient iFLDMs 30 min after B/B treatment and TBK1 and FKBP levels were analyzed by western blot. (H) iBMDMs expressing the WT or mutant FKBP-IRSp53 nanomachine were treated with B/B for 30 min and phospho-p65, phospho-p38, and phospho-JNK were analyzed by western blot. (I) Ingenuity pathway analysis (IPA) was performed to compare the activation status of the NF-κB and AP-1 transcription factors between nanomachines after 2 hr of B/B treatment. Activation scores are illustrated such that the nanomachine on the y-axis is compared to the nanomachine in the legend. Each panel is a representative experiment of at least 3 independent repeated experiments (except panel I). Data in bar graphs are represented as mean ± SEM.
Figure 6.
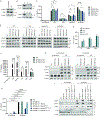
Figure 6.. The IRSp53 and GMIP domains signal independently of known IFN pathways.
(A) WT iBMDMs were treated with 1 μg/mL LPS for 4 hours and IRSp53 and GMIP levels were analyzed by western blot. (B) Cas9-expressing iBMDMs were electroporated with gRNAs against IRSp53 or GMIP and the selected clones were analyzed for IRSp53 or GMIP levels by western blot. (C-D) IRSp53- or GMIP-deficient iBMDMs were treated with LPS, CpG, electroporated poly(dA:dT), or electroporated 3p-hpRNA for 16 hr and (C) IP-10 release was analyzed by ELISA, and (D) viperin, phospho-STAT1, total STAT1, and FKBP levels were analyzed by western blot. (E) Tet3G-expressing iBMDMs were transduced with TRE3G vectors encoding IRSp53 or GMIP. Gene expression was induced by doxycycline treatment for 8 hr, followed by treatment with 100 ng/mL LPS for an additional 16 hr, and IP-10 release was analyzed by ELISA. (F) MyD88/TRIF/STING/MAVS(MTSM)-deficient cells were treated with LPS, DMXAA, CpG, recombinant IFN-β, or infected with SeV (MOI=0.00001) and IP-10 release was analyzed by ELISA. (G) MTSM-deficient cells expressing the FKBP-IRSp53 or FKBP-GMIP nanomachines were treated with B/B for 16 hr and viperin, phospho-STAT1, total STAT1, and FKBP levels were analyzed by western blot. (H-I) MTSM-deficient cells expressing the indicated MAVS variants were transfected with 3p-hpRNA for 16 hr and IP-10 release was analyzed by ELISA, or viperin, phospho-STAT1, total STAT1, and FKBP levels were analyzed by western blot. Each panel is a representative experiment of at least 3 independent repeated experiments. Data in bar graphs are represented as mean ± SEM.
Figure 7.
Figure 7.. MAVS and IRSp53 pLxIS-containing domains are the most potent agents of anti-viral immunity.
(A) A549s expressing the indicated nanomachines were treated with B/B and IFNB1 expression was analyzed by qPCR after 2 hr, ISG15 expression was analyzed by qPCR after 4 hr, and IP-10 release was analyzed by ELISA after 16 hr. (B) A549s expressing the indicated nanomachines were treated with B/B for 16 hr and viperin, phosphoSTAT1, total STAT1, and FKBP levels were analyzed by western blot. (C-D) A549s expressing the indicated nanomachines were pretreated with B/B for 2 hr and then infected with (C) VSV at an MOI of 1 or (D) IAV at an MOI of 0.1 for 16 hr and indicated viral mRNA was analyzed by qPCR or pfu/mL was analyzed by plaque assay. (E) A549s expressing the FKBP-MAVS or FKBP-IRSp53 nanomachines were pretreated with MRT67307 for 1 hr, the treated with B/B for 2 hr, and then infected with VSV at an MOI of 1 or IAV at an MOI of 0.1 for 16 hr and pfu/mL was analyzed by plaque assay. (F) A549s expressing the FKBP-MAVS or FKBP-IRSp53 nanomachines were pretreated with MRT67307 for 1 hr and then treated with B/B for 16 hr and IP-10 release was analyzed by ELISA. (G) Same as (E) except cells were pretreated with 2-DG for 1 hour prior to B/B treatment. (H-I) A549s expressing the FKBP-MAVS or FKBP-IRSp53 nanomachines were treated with B/B 2 hr before, concurrently with, or 2 hr after infection with VSV at an MOI of 1 or IAV at an MOI of 0.1 for 16 hr. (H) IP-10 release was analyzed by ELISA and ISG15 expression was analyzed by qPCR. (I) Pfu/mL was analyzed by plaque assay. (A, B, F) Each panel is a representative experiment of at least 3 independent repeated experiments. (C, D, E, G, H, I) Each panel is the combined data from 3 independent repeated experiments. Data in bar graphs are represented as mean ± SEM.

References

    1. Nanson JD, Kobe B, and Ve T. (2019). Death, TIR, and RHIM: Self-assembling domains involved in innate immunity and cell-death signaling. J Leukoc Biol 105, 363–375. 10.1002/JLB.MR0318-123R. - DOI - PubMed
    1. Mushegian A, and Medzhitov R. (2001). Evolutionary perspective on innate immune recognition. J Cell Biol 155, 705–710. 10.1083/jcb.200107040. - DOI - PMC - PubMed
    1. Fitzgerald KA, and Kagan JC (2020). Toll-like Receptors and the Control of Immunity. Cell 180, 1044–1066. 10.1016/j.cell.2020.02.041. - DOI - PMC - PubMed
    1. Webster JD, and Vucic D. (2020). The Balance of TNF Mediated Pathways Regulates Inflammatory Cell Death Signaling in Healthy and Diseased Tissues. Front Cell Dev Biol 8, 365. 10.3389/fcell.2020.00365. - DOI - PMC - PubMed
    1. Zheng D, Liwinski T, and Elinav E. (2020). Inflammasome activation and regulation: toward a better understanding of complex mechanisms. Cell Discov 6, 36. 10.1038/s41421-020-0167-x. - DOI - PMC - PubMed

MeSH terms

Substances