. 2024 Aug;300(8):107494.
doi: 10.1016/j.jbc.2024.107494. Epub 2024 Jun 24.

Systematic transcriptome profiling of hPSC-derived osteoblasts unveils CORIN's mastery in governing osteogenesis through CEBPD modulation

Affiliations

Systematic transcriptome profiling of hPSC-derived osteoblasts unveils CORIN's mastery in governing osteogenesis through CEBPD modulation

Dandan Zhu et al. J Biol Chem. 2024 Aug.

Abstract

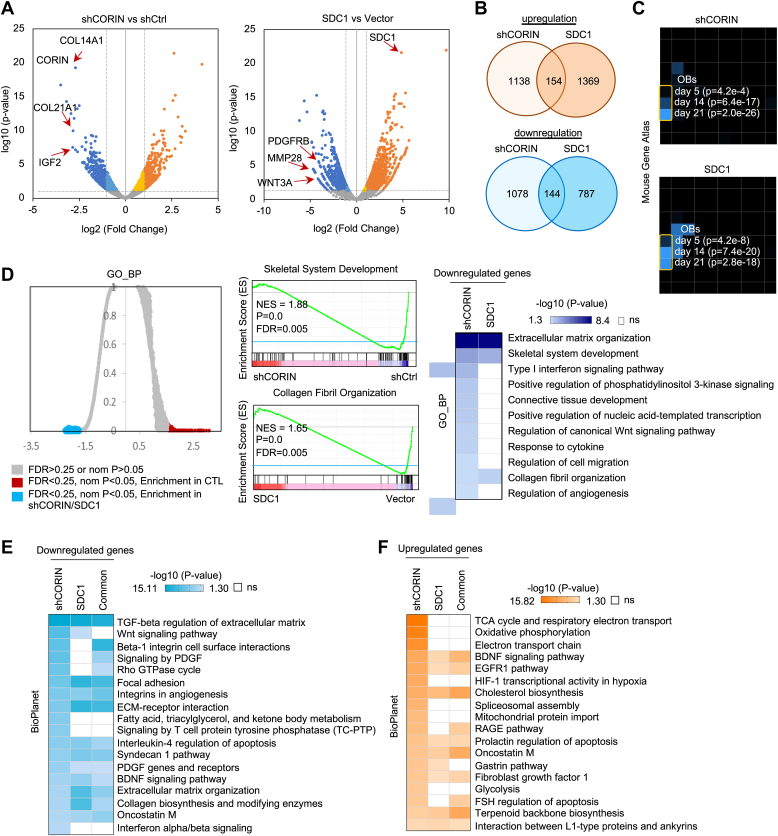
The commitment of stem cells to differentiate into osteoblasts is a highly regulated and complex process that involves the coordination of extrinsic signals and intrinsic transcriptional machinery. While rodent osteoblastic differentiation has been extensively studied, research on human osteogenesis has been limited by cell sources and existing models. Here, we systematically dissect human pluripotent stem cell-derived osteoblasts to identify functional membrane proteins and their downstream transcriptional networks involved in human osteogenesis. Our results reveal an enrichment of type II transmembrane serine protease CORIN in humans but not rodent osteoblasts. Functional analyses demonstrated that CORIN depletion significantly impairs osteogenesis. Genome-wide chromatin immunoprecipitation enrichment and mechanistic studies show that p38 MAPK-mediated CCAAT enhancer binding protein delta (CEBPD) upregulation is required for CORIN-modulated osteogenesis. Contrastingly, the type I transmembrane heparan sulfate proteoglycan SDC1 enriched in mesenchymal stem cells exerts a negative regulatory effect on osteogenesis through a similar mechanism. Chromatin immunoprecipitation-seq, bulk and single-cell transcriptomes, and functional validations indicated that CEBPD plays a critical role in controlling osteogenesis. In summary, our findings uncover previously unrecognized CORIN-mediated CEBPD transcriptomic networks in driving human osteoblast lineage commitment.

Keywords: ChIP-sequencing (ChIP-seq); induced pluripotent stem cells (iPSCs); mesenchymal stem cells (MSCs); osteoblasts; p38 MAPK.


Conflict of interest statement

Conflict of interest The authors declare that they have no conflicts of interest with the contents of this article.

Figures

Figure 1
Figure 1
hPSC-derived osteoblasts recapitulate functional osteoblast characteristics.A, the morphology of hESCs (H9) and hiPSCs (WT1-G, WT-1H, and WT-F6) at different stages: MSCs, preosteoblasts (Pre-OBs), maturing osteoblasts (Mat OBs), and osteoblasts (OBs). ARS staining revealed matrix mineralization in MSCs, preosteoblasts, maturing osteoblasts, and osteoblasts. The scale bar represents 100 mm. B, Spearman’s correlation of the RNA-seq results of hESC and hiPSC-derived MSCs, preosteoblasts, maturing osteoblasts, and mature osteoblasts. The pairwise correlation ranges from 0.91 (blue) to 1 (orange). C, principal component analysis (PCA) was used to calculate and compare the gene expression data of MSCs (light blue), preosteoblasts (Pre; green), maturing osteoblasts (Mat; orange), and osteoblasts (OBs; dark red). The two axes, PC1 and PC2, represent the first two principal components identified by the analysis. Squares indicate hESC-derived cells, while circles indicate hiPSC-derived cells. The grouping of MSCs, as well as Pre, Mat, and OBs, is outlined. D and E, Mouse Gene Atlas (D) and MGI Mammalian Phenotype (E) analyses indicate that the genes enriched in preosteoblasts (Pre-OBs), maturing osteoblasts (Mat OBs), and osteoblasts (OBs) are most significantly expressed in late-stage mouse osteoblasts (day 14 and 21) and associated with abnormal skeletal development, while genes enriched in MSCs are most highly expressed in early-stage mouse osteoblasts (day 5) and associated with cell cycle dysregulation. F, upper left graph: GSEA analyses identified Gene Ontology biological processes (GO_BP) from a collection of 7525 gene sets enriched in MSCs or osteoblasts. GO_BP gene sets enriched (orange, corresponding to a positive normalized enrichment score (NES)) or depleted (green, corresponding to a negative NES) in the transcriptome of osteoblasts compared to MSCs are shown. Enriched gene sets are selected based on statistical significance (normalized p-value < 0.05 and FDR q-value < 0.25). Upper center-right panels: heatmap of significantly altered GO_BPs in preosteoblasts (Pre-OBs), maturing osteoblasts (Mat OBs), and mature osteoblasts (OBs). Lower panel: GSEA leading edge analysis demonstrates the overlap between gene sets enriched in osteoblasts or MSCs. ARS, Alizarin Red S; FDR, false discovery rate; GO_BP, Gene Ontology biological process; GSEA, gene set enrichment analysis; hESC, human embryonic stem cell; hiPSC, human-induced pluripotent stem cell; hPSC, human pluripotent stem cell; MGI, Mouse Genome Informatics; MSC, mesenchymal stem cell.
Figure 2
Figure 2
Systematic transcriptome analyses of hPSC-derived cells reveal enriched membrane proteins in human osteoblasts.A, left panel: Cluster analysis of the gene expression patterns during osteogenesis. The horizontal axis represents the stages of osteoblast development: MSCs, preosteoblasts (Pre), maturing osteoblasts (Mat), and osteoblasts (OBs). The vertical axis represents FPKM values using 2 as the logarithmic base of a gene at different developmental stages. The red lines indicate the change in gene expression level between samples. Right panel: GO_BP pathway analysis of 12 gene expression clusters showed the enrichment of genes involved in different biological processes as indicated. B, left panel: diagrammatic depiction of stages of osteogenesis. Right panel: RNA-seq analysis of hPSC-derived osteoblasts revealed the enriched expression of AMIGO2, CDH13, CDH2, PVR, and SDC1 in MSCs and the enriched expression of CORIN, IL1R1, CD82, APOD, TGFBR2, ADAMTSL4, SERPING1, MME1, VCAM1, and LEPR in osteoblasts. C, heatmap showing the differential expression of identified membrane proteins during osteogenesis. The enriched membrane proteins in osteoblasts are in Clusters 3 and 6. The enriched membrane proteins in MSCs are in Cluster 12. D, RT-qPCR validated the upregulation/downregulation of the identified membrane proteins in multiple hPSC-derived osteoblasts as biological repeats (WT-1H, WT-1G, WT-1J, WT-F6, and WT-F37) compared to MSCs. MSCs were derived from hPSCs using the bFGF/PDGF-AB method. E, RT-qPCR demonstrated the upregulation/downregulation of the identified membrane proteins in H1, WT-F6, and WT-F37 hPSC-derived osteoblasts compared to MSCs. MSCs were derived from hPSCs using the SB-431542/7.5%CO2 method. (n = 3, mean ± S.D.). F, RT-qPCR demonstrated the upregulation/downregulation of the identified membrane proteins in osteoblasts differentiated from ad-HMSCs and bm-HMSCs. (n = 3, mean ± S.D.). G, RT-qPCR demonstrated the upregulation/downregulation of the identified membrane proteins in hFOB-differentiated osteoblasts. (n = 3, mean ± S.D.). ad-HMSC, adipose tissue-derived human MSC; CD, clusters of differentiation; FPKM, Fragments Per Kilobase per Million mapped fragments; GO_BP, Gene Ontology biological process; HMSC, human MSC; hPSC, human pluripotent stem cells; MSC, mesenchymal stem cell; RT-qPCR, real-time quantitative PCR; SDC1, syndecan-1; TGF-β transforming growth factor-β.
Figure 3
Figure 3
Functional studies on CORIN and SDC1 in osteogenesis.A, flow cytometry analysis of CORIN and SDC1 expression in hESC H9-derived MSCs and osteoblasts (OBs). B, IHC staining of CORIN and SDC1 expression in human femur bone tissue using anti-human CORIN and anti-human SDC1 antibodies. Goat and mouse IgG were utilized as a negative control. The scale bar represents 100 μm. C, RT-qPCR confirmed the impairment of osteoblast lineage genes COL1A1, PTH1R1, BGLAP, and RUNX2 in CORIN-depleted or SDC1-overexpressed hESC H1-derived osteoblasts. (n = 3, mean ± S.D.). D, ARS staining indicated that depletion of CORIN as well as overexpression of SDC1 in osteoblasts led to impaired bone mineral production. The scale bar represents 100 μm. E, diagrammatic depiction of preparation of GelMA discs. Hybridization of gelatin and methacrylic anhydride was followed by UV cross-linking to make the GelMA discs. F, morphology of GelMA discs, which had a diameter of 4 mm and a thickness of 1 mm. G, scanning electron microscope (SEM) image showing the surface and hollow structures of the GelMA discs. The scale bar represents 400 μm. H and I, left: 3D μCT images of GelMA discs loaded with CORIN-depleted or SDC1-overexpressed hESC H1-derived osteoblasts compared to control osteoblasts at 3 weeks and 6 weeks culture in osteoblastic differentiation media. Right: bone mineral density and BV/TV (%) analyses of GelMA discs loaded with CORIN-depleted (upper), or SDC1-overexpressed (lower) hESC H1-derived osteoblasts. The scale bar represents 1 mm. The difference between two groups was compared by the two-tailed unpaired Student’s t test or ANOVA to calculate the p-value. (n = 3, mean ± S.D.). ARS, Alizarin Red S; BV/TV, bone volume/total tissue volume; GelMA, gelatin methacrylate; hESC, human embryonic stem cell; IHC, immunohistochemistry; MSC, mesenchymal stem cell; RT-qPCR, real-time quantitative PCR; SDC1, syndecan-1; μCT, microcomputed tomography.
Figure 4
Figure 4
Systematic analyses of the CORIN/SDC1-regulated transcriptome.A, volcano plots for DEGs in CORIN-depleted (left panel) or SDC1-overexpressed (right panel) hESC H9-derived osteoblasts compared with control osteoblasts. DEGs were selected with the parameters p < 0.05 and log2 (fold-change) > 1. Vertical dashed lines demarcate the 2-fold change cutoff. Blue and dark blue dots represent genes significantly downregulated ≤2-fold or >2-fold, respectively; yellow and orange dots represent genes significantly upregulated ≤2-fold or >2-fold, respectively; gray dots represent genes without significantly differential expression following depletion or CORIN or overexpression of SDC1. B, Venn diagram depicting the number of genes considered to be DEGs in CORIN-knockdown and SDC1-overexpressed hESC H9-derived osteoblasts. The intersection represents commonly upregulated (upper panel) or downregulated (lower panel) genes in both the shCORIN and SDC1 groups. C, Mouse Gene Atlas analyses by Enrichr indicated that downregulated genes in CORIN-depleted and SDC1-overexpressed osteoblasts are significantly enriched in the later stages of mouse osteoblast differentiation (days 14 and 21). D, GSEA GO_BP analyses (left panel) demonstrated that genes significantly downregulated in CORIN-depleted and SDC1-overexpressed hESC H9-derived osteoblasts were involved in skeletal system development (right upper panel) and collagen fibril organization (right lower panel). Gene sets enriched in control cells are shown in dark blue (FDR q value < 0.25; normalized p value < 0.05), while white indicates a nonsignificant difference. E, BioPlanet pathway analyses demonstrate that genes significantly downregulated in CORIN-depleted and SDC1-overexpressed hESC H9-derived osteoblasts are involved in TGF-β regulation of extracellular matrix, extracellular matrix organization, and ECM receptor interactions. Gene sets enriched in control cells are shown in blue (FDR q value < 0.25; normalized p value < 0.05), while white indicates a nonsignificant difference. F, BioPlanet pathway analyses demonstrate that genes significantly upregulated in CORIN-depleted and SDC1-overexpressed hESC H9-derived osteoblasts are overrepresented for genes in cellular functions such as EGFR1 and cholesterol biosynthesis. ECM, extracellular matrix; EGFR, epidermal growth factor receptor; FDR, false discovery rate; hESC, human embryonic stem cell; GO_BP, Gene Ontology biological process; GSEA, gene set enrichment analysis; SDC1, syndecan-1; TGF-β transforming growth factor-β.
Figure 5
Figure 5
CORIN/SDC1 governs the determination of osteoblast identities via CEBPD.A, ChEA analysis of DEGs in hESC H9-derived osteoblasts upon CORIN depletion as well as SDC1 overexpression. Genes enriched in control cells are shown in blue, and genes enriched in osteoblasts with CORIN depletion or SDC1 overexpression are shown in orange. The color intensity of the circle indicates the number of targets by a given transcription factor in the dataset, while the circle size represents the significance of the interaction. B and C, immunoblotting of CEBPD in CORIN-depleted (B) and SDC-overexpressed (C) hESC H9-derived osteoblasts. RT-qPCR confirmed the efficacy of shCORIN and SDC1 in modifying gene expression. (n = 3, mean ± S.D.). D, immunoblotting showed an increase in p38 MAPK phosphorylation and subsequent CORIN and CEBPD expression in hESC H9-derived osteoblasts compared to MSCs. E, immunoblotting showed inhibition of p38 MAPK by p38 MAPK inhibitor SB202190 (200 nM) and an associated downregulation of CEBPD expression. F, ARS staining of hESC H9-derived differentiated osteoblasts treated with p38 MAPK inhibitor SB202190 (200 nM) compared with control osteoblasts and MSCs. The scale bar represents 5 mm. G, immunoblotting showed a decrease in p38 MAPK phosphorylation upon CORIN knockdown (upper panel) or SDC1 overexpression (lower panel) in H1 hESC-derived osteoblasts. H, IHC staining showed the expression of CEBPD in human and mouse femur bone tissues. Rabbit IgG served as a control. I, scRNA-seq analysis of human osteoblasts reveals the expression of CEBPD in a distinct osteoblast population. Left panel: three osteoblast clusters (preosteoblasts [Pre-OBs], osteoblasts [OBs], and undetermined osteoblasts [Undetermined OBs]) are defined, colored, and visualized by UMAP using 5329 osteoblasts. Middle panel: logarithm-normalized expression showed CEBPD is highly expressed in the three osteoblast clusters. Right panel: distributions of CEBPD expression within the three osteoblast clusters showed the highest CEBPD expression in the undetermined osteoblast cluster. J, ARS staining confirmed that depletion of CEBPD impairs bone mineralization in hESC H9-derived osteoblasts. The scale bar represents 100 μm. K, RT-qPCR reveals the impairment of osteoblast lineage genes COL1A1, PTH1R1, BGLAP, and RUNX2 in CEBPD-depleted hESC H9-derived osteoblasts. (n = 3, mean ± S.D.). L, left panels: 3D μCT images of GelMA discs loaded with CEBPD-depleted hESC H9-derived osteoblasts (sgCEBPD-1) at 3 weeks and 6 weeks culture in osteoblast differentiation media. Right panels: bone mineral density and BV/TV (%) analyses of GelMA discs loaded with CEBPD-depleted hESC H9-derived osteoblasts (sgCEBPD). The scale bar represents 1 mm. The difference between two groups was compared by the two-tailed unpaired Student’s t test or ANOVA to calculate the p-value. (n = 3, mean ± S.D.). ARS, Alizarin Red S; BV/TV, bone volume/total tissue volume; CEBPD, CCAAT enhancer binding protein delta; ChEA, ChIP enrichment analysis; DEG, differentially expressed gene; GelMA, gelatin methacrylate; hESC, human embryonic stem cell; IHC, immunohistochemistry; MAPK, mitogen-activated protein kinase; MSC, mesenchymal stem cell; RT-qPCR, real-time quantitative PCR; scRNA-seq, single-cell RNA-seq; SDC1, syndecan-1; μCT, microcomputed tomography; UMAP, uniform manifold approximation and projection.
Figure 6
Figure 6
ChIP-seq, ATAC-seq, and RNA-seq studies suggest CEBPD functions as an osteoblastic transcription factor.A, heatmaps depicting the commonalities and differences in the 3 kb genomic loci surrounding each of the identified ChIP-seq peaks and ATAC peaks, grouped by cluster. B, composite plots showing the average binding intensities of CEBPD+/ATAC and CEBPD+/ATAC+ peak regions. C, pie chart showing the genomic positional distribution of CEBPD/ATAC cotargeted binding sites for known and de novo RefSeq genes. D, motif analyses plot of the top-scoring Homer known binding motifs for CEBPD/ATAC cotargeted genomic binding peaks in osteoblasts. E, Venn diagram of genes identified via ChIP-seq, ATAC-seq, and RNA-seq studies reveal 179 genes transcriptionally regulated by CEBPD in osteoblasts. F, upper panel: heatmaps of CEBPD peak intensities in CEBPD/ATAC cotargeted gene regions (±3 kb from TSS). lower panel: heatmaps of changes in gene expression in CEBPD-depleted hESC H9-derived osteoblasts as examined by RNA-seq. G, GO_BP analyses showed that the 179 enriched genes regulated by CEBPD are involved in extracellular matrix organization, regulation of ossification, regulation of bone mineralization, and other bone physiology-related functions. H, IGV snapshot of CEBPD/ATAC occupancy over the promoter regions of COL12A1, COL21A1, SMAD6, and ADAMTS5. I, ChIP-qPCR at CEBPD TSS peak sites assess CEBPD or IgG enrichment (ChIP/input). ChIP-qPCR confirms specific enrichment of COL12A1, COL21A1, SMAD6, and ADAMTS5 at peak regions in hESC H9-derived osteoblasts. (n = 3, mean ± S.D.). J, scRNA-seq analysis demonstrated logarithm-normalized expression of the CEBPD transcriptional targets COL12A1, SMAD6, C1RL, SMIM14, and FBXO32, and are displayed according to the three osteoblast clusters. The difference between two groups was compared by the two-tailed unpaired Student’s t test to calculate the p-value. ATAC, assay for transposase-accessible chromatin; CEBPD, CCAAT enhancer binding protein delta; ChIP, chromatin immunoprecipitation; GO_BP, Gene Ontology biological process; hESC, human embryonic stem cell; IgG, immunoglobulin G; IGV, Integrative Genomics Viewer; scRNA-seq, single-cell RNA-seq; TSS, transcription start site.

References

    1. Huang W., Yang S., Shao J., Li Y.P. Signaling and transcriptional regulation in osteoblast commitment and differentiation. Front. Biosci. 2007;12:3068–3092. - PMC - PubMed
    1. Mathews S., Bhonde R., Gupta P.K., Totey S. Extracellular matrix protein mediated regulation of the osteoblast differentiation of bone marrow derived human mesenchymal stem cells. Differentiation. 2012;84:185–192. - PubMed
    1. Lin Y.H., Jewell B.E., Gingold J., Lu L., Zhao R., Wang L.L., et al. Osteosarcoma: molecular pathogenesis and iPSC modeling. Trends Mol. Med. 2017;23:737–755. - PMC - PubMed
    1. Neve A., Corrado A., Cantatore F.P. Osteoblast physiology in normal and pathological conditions. Cell Tissue Res. 2011;343:289–302. - PubMed
    1. Dong N., Niu Y., Chen Y., Sun S., Wu Q. Function and regulation of corin in physiology and disease. Biochem. Soc. Trans. 2020;48:1905–1916. - PubMed

Publication types

Substances

Associated data